迭代子图并将特定变量彼此相邻放置
python 195
原文标题 :Iterate subplots and place specific variables adjacent to each other
假设我有一个 30 列的数据框,前 10 列是各种收集数据的“平均值”,接下来的 10 列是“中位数”,最后 10 列是“模式”。例如,第 1 列是 height_mean,第 10 列是 height_median,第 20 列是 height_mode。第 2 列是 weight_mean,第 11 列是 weight_median,第 21 列是 weight median。
| height_mean | … | height_median | … | height_mode | … |
|---|---|---|---|---|---|
| 56 | … | 58 | … | 55 | … |
我想创建一个 10×3 的子图,它为每个变量获取平均值、中位数和众数图,并将它们相邻绘制,这样子图的每一行都是一个新变量。因此,子图的第一行将包含身高的均值、中位数和众数图,子图的第二行将包含体重的均值、中位数和众数,依此类推。
到目前为止,我有这个,它按照列在数据框中的顺序创建子图:
fig, axs = plt.subplots(10,3, figsize=(20,20))

for count, ax in zip(df.columns, axs.ravel()):
  df_data.loc[:,[count]].boxplot(ax=ax)
plt.show()
我试图做这样的事情,但不起作用:
for n, column in enumerate(df_columns):
    # add a new subplot iteratively
    ax = plt.subplot(10, 3, n + 1)
    df_data.iloc[:,[n]].boxplot(ax=ax)
    ax = plt.subplot(10, 3, n + 2)
    df_data.iloc[:,[n+9]].boxplot(ax=ax)
    ax=plt.subplot(10,3,n+3)
    df_data.iloc[:,[n+19]].boxplot(ax=ax)
回复
我来回复-
 tdy 评论
由于您想逐列迭代轴,因此在散开之前转置轴,即
axs.T.ravel():for col, ax in zip(df.columns, axs.T.ravel()):最小的例子:
headers = ['height_mean', 'weight_mean', 'height_median', 'weight_median', 'height_mode', 'weight_mode'] df = pd.DataFrame(np.random.random((10, 6)), columns=headers) # height_mean weight_mean height_median weight_median height_mode weight_mode # 0 0.982351 0.548713 0.559040 0.497497 0.842977 0.738946 # 1 0.832716 0.660227 0.754149 0.286536 0.315156 0.312089 # 2 0.997460 0.290112 0.501917 0.974751 0.097419 0.559542 ncols = 3 nrows = len(df.columns) // ncols fig, axs = plt.subplots(nrows, ncols, sharey=True, constrained_layout=True) for col, ax in zip(df.columns, axs.T.ravel()): df[[col]].boxplot(ax=ax)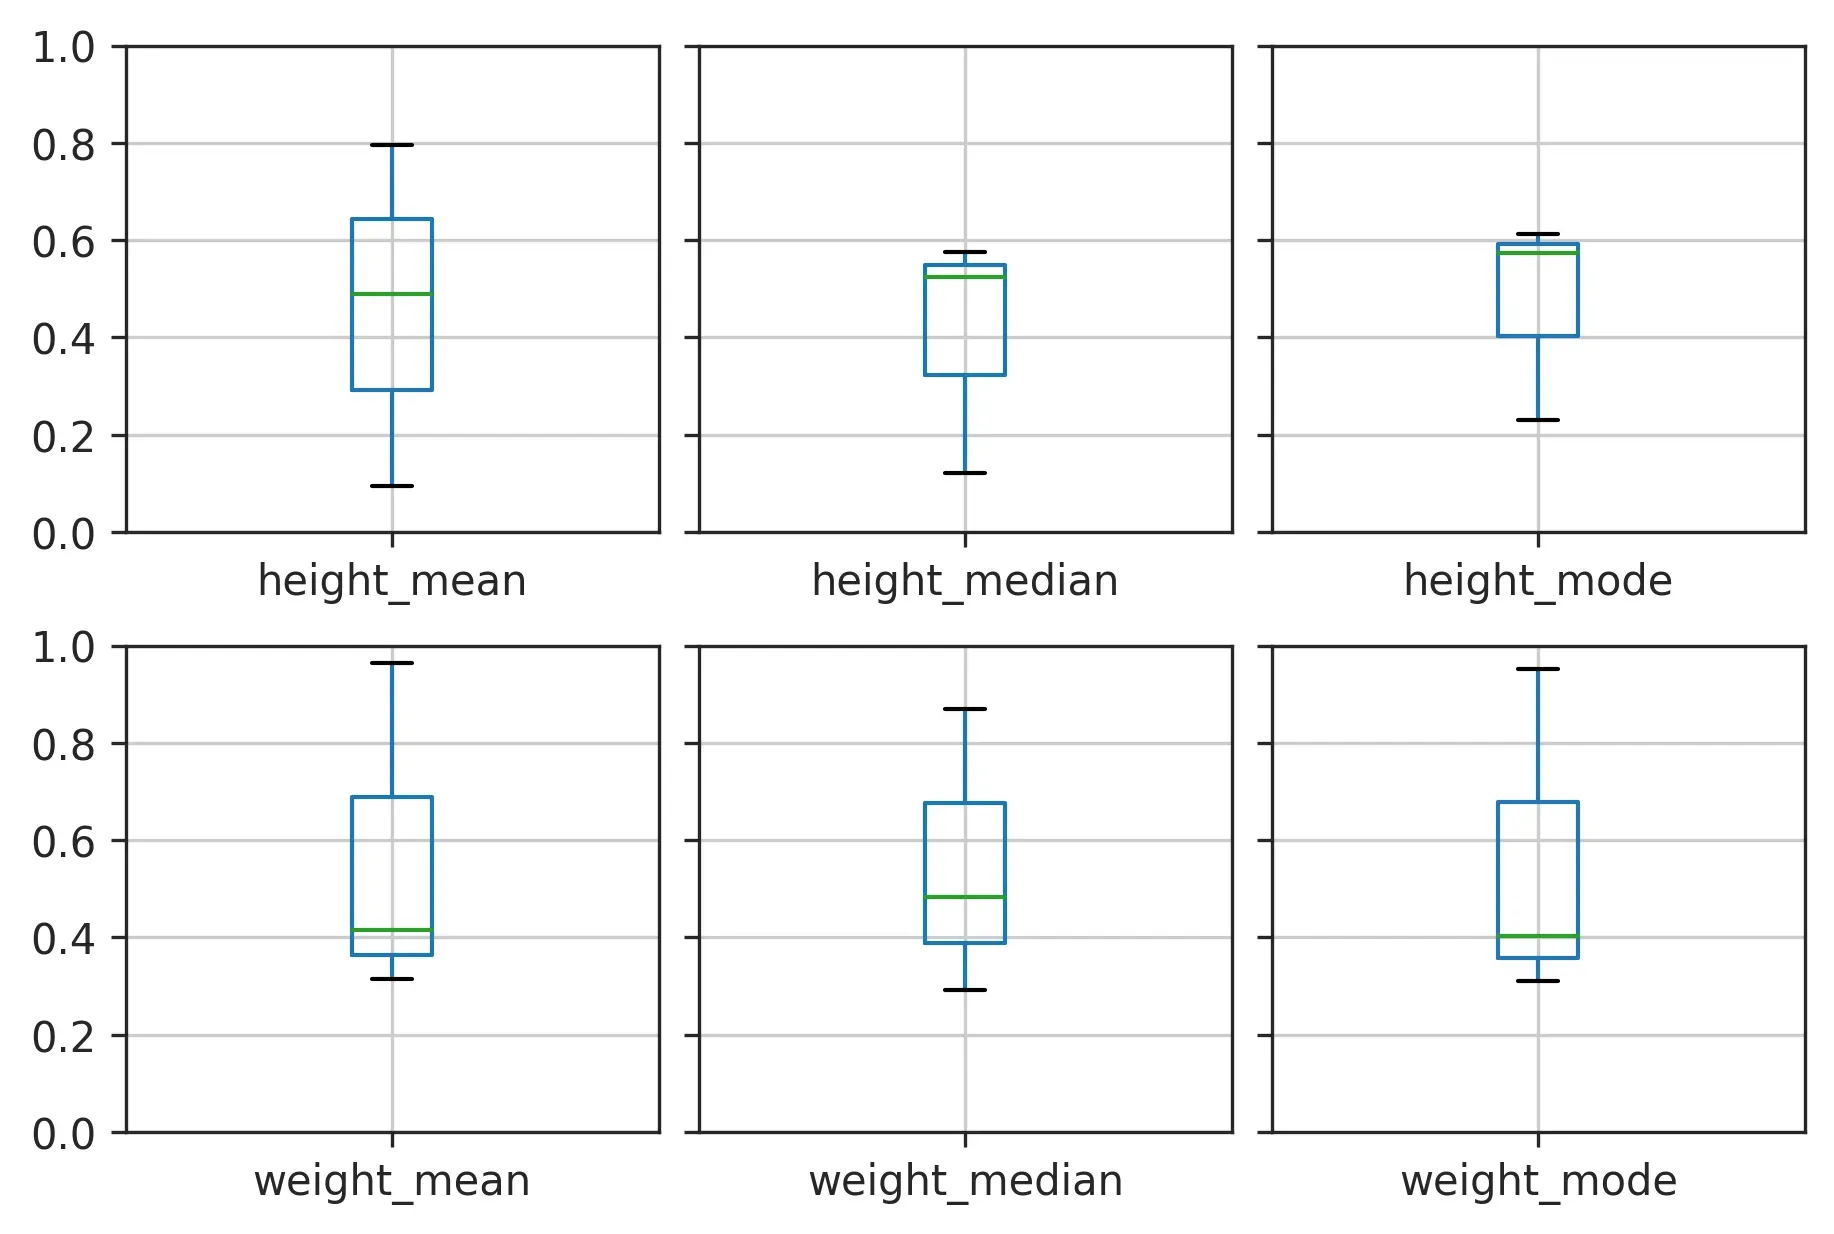 2年前
2年前