主题一:阅读、展示、存储
读入一幅RGB图像,变换为灰度图像和二值图像,并在同一个窗口内分别显示RGB图像和灰度图像,注上文字标题,并将结果以文件形式存到磁盘上。
灵活使用百度即可。
a=imread('01.jpg')
i=rgb2gray(a)
I=im2bw(i,0.5)
subplot(2,2,1);imshow(a);title('RGB');          %2x2的区域里的第一幅图,标题为RGB
subplot(2,2,2);imshow(i);title('Gray');
subplot(2,2,3);imshow(I);title('Binary')
imwrite(a,'01_rgb.jpg');imwrite(i,'01_gray.jpg');imwrite(I,'01_binary.jpg');
结果如下,哎就很烦不知道matlab装的时候出了什么问题不能显示中文,但是用英文看起来很牛,浅用一下。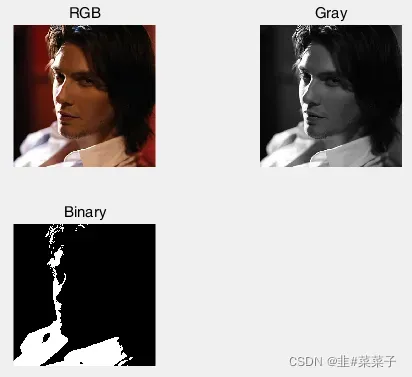
主题 2:平移、镜像、放大、缩小、旋转
对图像进行平移、镜像(水平镜像、垂直镜像)、放大、缩小和旋转操作。放大和旋转操作分别通过最近邻插值和双线性插值实现。需要根据算法编写代码,对两者进行分析。插值方法的优缺点。
就matlab相关的真的很难找,是我搜索的关键词不对吗,csdn能不能努努力下次直接把我想要的给我推到最前面。
平移、镜像和缩小的参考在这里
巧妙的复制了一下,参考网址里的代码只能处理灰度图,我用百度灵活加了颜色处理。如果用原码翻译彩色图像(我不知道学名是什么),会变成三张图,非常牛逼。
最近邻插值和双线性插值的放大和旋转参考这里
我删除了双立方的,并复制了其他的。自信才是王道!
平底锅
src=imread('u.jpg');
[m,n,c]=size(src);
dst=zeros(m,n,c);
left=[1,0,-50;0,1,-50;0,0,1];
for i=1:m
    for j=1:n
        t=left*[i;j;1];
        if t(1,1)<=m&&t(2,1)<=n&&t(1,1)>=1&&t(2,1)>=1
            dst(t(1,1),t(2,1),:)=src(i,j,:);
        end
    end
end
subplot(1,2,1),imshow(uint8(src)),title('Src');
subplot(1,2,2),imshow(uint8(dst)),title('Dst');
镜子
水平的:
src=imread('u.jpg');
[m,n,c]=size(src);
dst=zeros(m,n,c);
left=[1,0,0;0,-1,m;0,0,1];
for i=1:m
    for j=1:n
        t=left*[i;j;1];
        if t(1,1)<=m&&t(2,1)<=n&&t(1,1)>=1&&t(2,1)>=1
            dst(t(1,1),t(2,1),:)=src(i,j,:);
        end
    end
end
subplot(1,2,1),imshow(uint8(src)),title('Origin');
subplot(1,2,2),imshow(uint8(dst)),title('Mirror Horizontally');
垂直的:
src=imread('u.jpg');
[m,n,c]=size(src);
dst=zeros(m,n,c);
left=[-1,0,n;0,1,0;0,0,1];
for i=1:m
    for j=1:n
        t=left*[i;j;1];
        if t(1,1)<=m&&t(2,1)<=n&&t(1,1)>=1&&t(2,1)>=1
            dst(t(1,1),t(2,1),:)=src(i,j,:);
        end
    end
end
subplot(1,2,1),imshow(uint8(src)),title('Origin');
subplot(1,2,2),imshow(uint8(dst)),title('Mirror Vertically');
放大
srcimg=imread('u.jpg');
[srcWidth ,srcHeight,Color]=size(srcimg);
dstWidth=srcWidth+50*2;
dstHeight=srcHeight+50*2;
dstimg0=zeros(dstWidth,dstHeight,Color,class(srcimg));
dstimg1=zeros(dstWidth,dstHeight,Color,class(srcimg));
for i=1:dstWidth  %最近邻插值
    for j=1:dstHeight
        for n = 1:Color
            src_i=i*(srcWidth/dstWidth);
            src_j=j*(srcHeight/dstHeight);
            dstimg0(i,j,n)=srcimg(round(src_i),round(src_j),n);
        end
    end
end
for i=1:dstWidth-1    %双线性插值
    for j=1:dstHeight-1
        for n = 1:Color
            src_i=i*(srcWidth/dstWidth);
            src_j=j*(srcHeight/dstHeight);
            src_ii=fix(src_i);
            src_iu=src_i - src_ii;
            src_jj=fix(src_j);
            src_jv=src_j - src_jj;
            if src_ii == 0
                src_ii=src_ii+1;
            end
            if src_jj ==0
                src_jj=src_jj+1;
            end
            dstimg1(i,j,n)=(1-src_iu)*(1-src_jv)*srcimg(src_ii,src_jj,n)+(1-src_iu)*src_jv*srcimg(src_ii,src_jj+1,n)+src_iu*(1-src_jv)*srcimg(src_ii+1,src_jj,n) +src_iu*src_jv*srcimg(src_ii+1,src_jj+1,n);
        end
    end
end
figure,imshow(srcimg),title('Origin');
figure,imshow(uint8(dstimg0)),title('Nearest Neighbor');
figure,imshow(dstimg1),title('Bilinear Interpolation');
缩小
src=imread('u.jpg');
[m,n,c]=size(src);
dst=zeros(m,n,c,class(src));
left=[1/2,0,0;0,1/2,0;0,0,1];
for i=1:m
    for j=1:n
        t=left*[i;j;1];
        if t(1,1)<=m&&t(2,1)<=n&&t(1,1)>=1&&t(2,1)>=1
            dst(round(t(1,1)),round(t(2,1)),:)=src(i,j,:);
        end
    end
end
subplot(1,2,1),imshow(uint8(src));subplot(1,2,2),imshow(uint8(dst));
旋转
srcimg=imread('u.jpg');
srcimg=double(srcimg);
[srcHeight,srcWidth,Color]=size(srcimg);
angle=pi/6;
dstWidth=srcWidth*cos(angle)+srcHeight*sin(angle);
dstHeight=srcWidth*sin(angle)+srcHeight*cos(angle);
dstHeight=ceil(dstHeight);
dstWidth=ceil(dstWidth);
u0=srcWidth*sin(angle);
T=[cos(angle),sin(angle);-sin(angle),cos(angle)];
dstimg0=zeros(dstWidth,dstHeight,Color,class(srcimg));
dstimg1=zeros(dstWidth,dstHeight,Color,class(srcimg));
for u=1:dstWidth  %最近邻插值
    for v=1:dstHeight
        for n=1:Color
            tem=T*([u;v]-[u0;0]);
            x=tem(1);
            y=tem(2);
            if x>=1 & x<=srcHeight & y>=1 & y<=srcWidth
                x_low=floor(x);
                x_up=ceil(x);
                y_low=floor(y);
                y_up=ceil(y);
                if (x-x_low)<=(x_up-x)
                    x=x_low;
                else
                    x=x_up;
                end
                if (y-y_low)<=(y_up-y)
                    y=y_low;
                else
                    y=y_up;
                end
                p1=srcimg(x_low,y_low,n);     %双线性插值
                p2=srcimg(x_up,y_low,n);
                p3=srcimg(x_low,y_low,n);
                p4=srcimg(x_up,y_up,n);
                s=x-x_low;
                t=y-y_low;
                dstimg0(u,v,n)=srcimg(x,y,n);
                dstimg1(u,v,n)=(1-s)*(1-t)*p1+(1-s)*t*p3+(1-t)*s*p2+s*t*p4;
            end
        end
    end
end
subplot(2,2,1),imshow(uint8(srcimg)),title('Origin');
subplot(2,2,2),imshow(uint8(dstimg0)),title('Nearest Neighbor');
subplot(2,2,3),imshow(dstimg1/255),title('Bilinear Interpolation');
文章出处登录后可见!
已经登录?立即刷新