1.数据文件形数据分析

# 提前准备数据
https://download.csdn.net/download/sd1_mc/85049785
这个代码有bug。。。
import numpy as np
from sklearn.datasets import load_iris
import numpy as np
import pandas as pd
import csv
#导入数据
data=pd.read_csv('iris.data')
np_t=np.array(data)
n=len(np_t)
#聚类分类数
k = 3
#第一次随机取3个中心点
cent=[np_t[1],np_t[80],np_t[100]]
cent_s=[]
#储存分类情况
fenlei=[[],[],[]]
#计数其余数据到中心点距离分类到最近中心点范围
def getDistance():
    for i in range(n):
        #存每个点到中心点最小值
        ds=0
        for j in range(3):
            m=0
            for l in range(4):
 # 计算与中心点距离
                m=m+(np_t[i][l]-cent[j][l])*(np_t[i][l]-cent[j][l])

  # 比较与上个中心距离,将节点分到相应范围
            if(j==0):
                ds=m
                np_t[i][4]=j
            if(m<ds):
                ds=m
                #分类
                np_t[i][4]=j
                #将数据加入分类
        fenlei[np_t[i][4]].append(np_t[i])

#计算分类后的中心点
def cent_t():
    cent_s=0
    for i in range(3):
        x=0
        y=0
        z=0
        v=0
        h=0
        for j in fenlei[i]:
            x=x+j[0]
            y=y+j[1]
            z=z+j[2]
            v=v+j[3]
            h=h+1
        if(h==0):
            continue
        x=x/h
        y=y/h
        z=z/h
        v=v/h
        # if((x-cent[i][0]<0.00000001)and (y-cent[i][1]<0.00000001)and (z-cent[i][2]<0.00000001)and (v-cent[i][3]<0.00000001)):
        #     cent_s=cent_s+1
        if(x==cent[i][0]and y==cent[i][1]and z==cent[i][2] and v==cent[i][3]):
            cent_s=cent_s+1
        #更新中心点
        cent[i]=[x,y,z,v,i]
        print(i)
    return cent_s
#第一次聚类
getDistance()
#比较记录中心点与上次中心点是否相同
cent_s=cent_t()
fenlei=[[],[],[]]
a=1

#循环聚类当中心点不变时聚类结束
while 1:
    getDistance()
    cent_s=cent_t()
    a=a+1
    if(cent_s==3):
        break
    fenlei=[[],[],[]]
print("迭代次数:",a)
filname = './is1.csv'
#打开csv文件
#最好提前准备文件
csvfile = open(filname, 'w', newline='')
#csv画笔
writer = csv.writer(csvfile)
#写入标题
writer.writerow(["sl", "sw", "pl","pw","分类"])
for i in range(3):
    for j in fenlei[i]:
        #录入数据
            writer.writerow(j)
#关闭文件
csvfile.close()
2.画图形聚类
import numpy as np
import matplotlib.pyplot as plt
from sklearn.datasets import load_iris
import numpy as np
#支持坐标轴中文
plt.rcParams['font.sans-serif']=['SimHei']
iris = load_iris()
X = iris.data # 特征向量,并且是按顺序排列的
lable = iris.target # 标签
#数据集预处理,以花萼面积为横坐标,以花瓣面积做纵坐标
arr = np.array(X)
hua_e = arr[:,0]*arr[:,1]
hua_ban = arr[:,2]*arr[:,3]
############################################
#定义需要的函数
def shuju(k):
b =set()
while(len(b)<k):
b.add(np.random.randint(0,150))
return(b)
#每个点到中心点距离距离
def getDistance(point_x,point_y,cent_x,cent_y,k):
x = point_x
y = point_y
x0 = cent_x
y0 = cent_y
i = 0
j = 0
ds = [[]for i in range(len(x))]
while i < len(x):
while j < k:
M = np.sqrt((x[i]-x0[j]) * (x[i]-x0[j]) + (y[i]-y0[j]) * (y[i]-y0[j]))
M = round(M,1)
j = j + 1
ds[i].append(M)
j = 0
i = i + 1
return(ds)
#计算距离误差
def EDistance(point_x,point_y,cent_x,cent_y,k):
x = point_x
y = point_y
x0 = cent_x
y0 = cent_y
i = 0
j = 0
sum = 0
while i < k:
while j < len(x):
M = (x[j]-x0[i]) * (x[j]-x0[i]) + (y[j]-y0[i]) * (y[j]-y0[i])
M = round(M,1)
sum += M
j = j + 1
#ds[i].append(M)
j = 0
i = i + 1
return(sum)
#计算中心点
def cent(lable):
temp = lable
mean_x = []
mean_y = []
i = 0
j = 0
while i < 3:
cent_x = 0
cent_y = 0
count = 0
while j < len(x):
if i == temp[j]:
count = count + 1
cent_x = cent_x + x[j]
cent_y = cent_y + y[j]
j = j + 1
cent_x = cent_x / count
cent_y = cent_y / count
#更新中心点
mean_x.append(cent_x)
mean_y.append(cent_y)
j = 0
i = i + 1
return[mean_x,mean_y]
#按照k值聚类
def julei(ds,x):
x = x
x = len(x)
i = 0
temp = []
while i < x:
temp.append(ds[i].index(min(ds[i])))
i = i + 1
return(temp)
##############################################
#主程序部分
#这里聚3类,k取3
k = 3
b = shuju(k)
ceshi_hua_e = [hua_e[i] for i in range(len(hua_e)) if (i in b)]
ceshi_hua_ban = [hua_ban[i] for i in range(len(hua_ban)) if (i in b)]
ceshi_lable = [lable[i] for i in range(len(lable)) if (i in b)]
x = hua_e
y = hua_ban
x0 = ceshi_hua_e
y0 = ceshi_hua_ban
#第一次根据随机种子聚类
n = 0
ds = getDistance(x,y,x0,y0,k)
temp = julei(ds,x)
temp1 = EDistance(x,y,x0,y0,k)
n = n + 1
center = cent(temp)
x0 = center[0]
y0 = center[1]
ds = getDistance(x,y,x0,y0,k)
temp = julei(ds,x)
temp2 = EDistance(x,y,x0,y0,k)
n = n + 1
#比较两次平方误差 判断是否相等,不相等继续迭代
while np.abs(temp2 - temp1) != 0:
temp1 = temp2
center = cent(temp)
x0 = center[0]
y0 = center[1]
ds = getDistance(x,y,x0,y0,k)
temp = julei(ds,x)
temp2 = EDistance(x,y,x0,y0,k)
n = n + 1
print(n,temp2)
#结果可视化
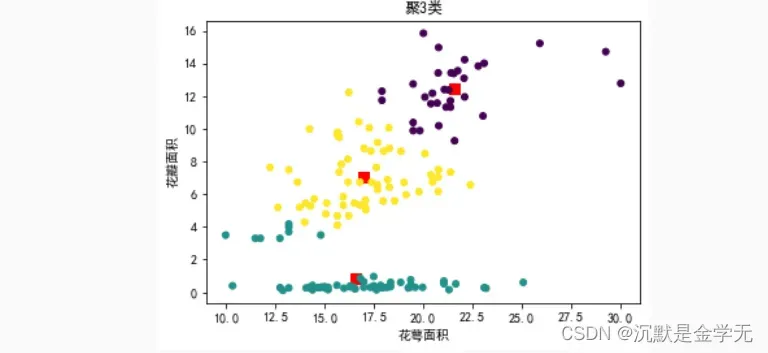
print("迭代次数: ", n) # 统计出迭代次数
print('质心位置:',x0,y0)
plt.scatter(x0,y0,color='r',s=50,marker='s')
plt.scatter(x,y,c=temp,s=25,marker='o')
plt.xlabel('花萼面积')
plt.ylabel('花瓣面积')
plt.title("聚3类")
plt.show()
文章出处登录后可见!
已经登录?立即刷新