5. K-means for compression
(a)
import numpy as np
import matplotlib.pyplot as plt
from matplotlib.image import imread
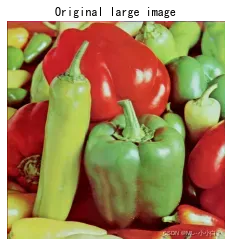
A = imread('./data/peppers-large.tiff')
plt.imshow(A)
plt.title('Original large image')
plt.savefig('./output/origin_large_sss.png')
plt.show()
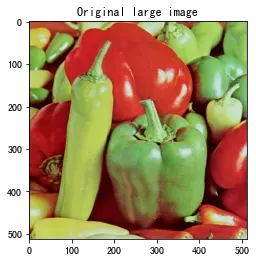
A.shape
(512, 512, 3)
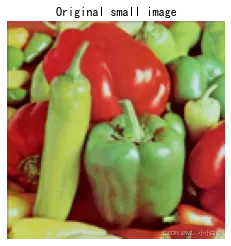
B = imread('./data/peppers-small.tiff')
plt.imshow(B)
plt.title('Original small image')
plt.savefig('./output/origin_small_sss.png')
plt.show()
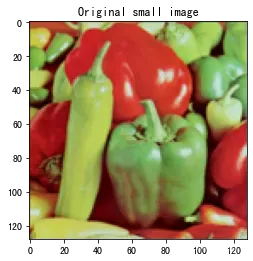
B.shape
(128, 128, 3)
K = 16 # number of cluster

# Vectorization
data = np.zeros((B.shape[0]*B.shape[1], B.shape[2]))
for i in range(B.shape[2]):
    data[:, i] = B[:, :, i].flatten()


def classification(data, centroids):
    cluster_label = np.zeros((data.shape[0], 1))
    for i in range(data.shape[0]):
        min_distance = np.inf
        for idx, cent in enumerate(centroids):
            distance = np.linalg.norm(data[i] - cent)
            if distance < min_distance:
                min_distance = distance
                cluster_label[i] = idx
    return cluster_label

def clustering(data, centroids, max_iter=500, eps=1e-3):
    it = 0
    delta = None
    while it<max_iter and (delta is None or (delta > eps)):
        cluster_label = classification(data, centroids)
        pre_centroids = centroids.copy()
        for k in range(centroids.shape[0]):
            centroids[k, :] = data[(cluster_label==k).flatten()].mean(axis=0)
        it += 1
        delta = np.zeros((centroids.shape[0]))
        for k in range(centroids.shape[0]):
            delta[k] = np.linalg.norm(centroids[k] - pre_centroids[k])
        delta = delta.sum()
        if it%20==0:
            print(f'iter {it}; delta: {delta}')
    print(f'converge at iter: {it}')
    return centroids


# Initilize centroids
idx = np.random.choice(data.shape[0], K)
centroids = data[idx]

# Clustering
centroids = clustering(data, centroids, max_iter=500, eps=1e-3)
iter 20; delta: 10.958814248018108
iter 40; delta: 7.650785575480222
iter 60; delta: 3.464410790854772
iter 80; delta: 2.386007401884572
iter 100; delta: 0.7228731285630646
iter 120; delta: 0.020889361865652663
converge at iter: 130
centroids
array([[ 51.67832957,   3.36794582,   2.4469526 ],
       [120.35643016, 166.04379157,  80.69456763],
       [138.25799794, 188.62435501, 109.53560372],
       [ 89.72991851,  19.57159488,  14.80209546],
       [113.4451683 ,  76.71009772,  41.53311618],
       [155.57385524, 179.52732644,  79.35450517],
       [197.03320312,  82.69140625,  58.44140625],
       [109.49053201, 127.93237151,  60.871055  ],
       [144.57407407, 121.23868313,  57.35390947],
       [177.6183274 ,  40.86298932,  38.09163701],
       [184.28264556, 201.71113624,  89.60542679],
       [193.62132353, 218.06433824, 191.63051471],
       [201.44946026,  50.8562316 ,  41.68547596],
       [202.66255144, 134.78600823,  95.10288066],
       [181.15721649, 202.4806701 , 147.27963918],
       [144.21515152,  22.28585859,  24.46464646]])
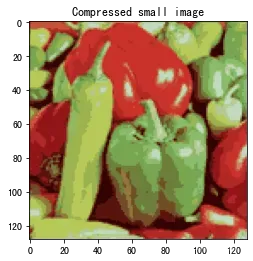
有了聚类以后的中心点以后,利用这16种颜色,重新输出small的imange看一下:
cluster_label = classification(data, centroids)
data_cmp = centroids[cluster_label.flatten().astype('int')]
def vector_to_image(data):
    n = int(np.sqrt(data.shape[0]))
    channel_num = data.shape[1]
    image_array = np.zeros((n, n, channel_num))
    for channel in range(channel_num):
        for i in range(n):
            for j in range(n):
                image_array[i, j, channel] = data[j+i*n, channel]
    return image_array

image_cmp = vector_to_image(data_cmp).astype('int')
plt.imshow(image_cmp)
plt.title('Compressed small image')
plt.savefig('./output/small_cmp.png')
plt.show()
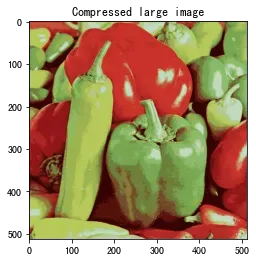
利用这个聚类压缩,显示一下原来的large图:
data_large = np.zeros((A.shape[0]*A.shape[1], A.shape[2]))
for i in range(A.shape[2]):
    data_large[:, i] = A[:, :, i].flatten()
cluster_label = classification(data_large, centroids)
data_cmp = centroids[cluster_label.flatten().astype('int')]
image_cmp = vector_to_image(data_cmp).astype('int')
plt.imshow(image_cmp)
plt.title('Compressed large image')
plt.savefig('./output/large_cmp.png')
plt.show()
以上实现了题主的要求,但是没有使用他提供的代码。提供的代码在下面使用:
import argparse
import matplotlib.image as mpimg
import matplotlib.pyplot as plt
import numpy as np
import os
import random
def init_centroids(num_clusters, image):
"""
Initialize a `num_clusters` x image_shape[-1] nparray to RGB
values of randomly chosen pixels of`image`
Parameters
----------
num_clusters : int
Number of centroids/clusters
image : nparray
(H, W, C) image represented as an nparray
Returns
-------
centroids_init : nparray
Randomly initialized centroids
"""
# *** START YOUR CODE ***
H, W, C = image.shape
idx = np.random.randint(H * W, size=num_clusters)
centroids_init = image[(idx / W).astype('int'), idx % W].astype('float64')
# *** END YOUR CODE ***
return centroids_init
def update_centroids(centroids, image, max_iter=30, print_every=10):
"""
Carry out k-means centroid update step `max_iter` times
Parameters
----------
centroids : nparray
The centroids stored as an nparray
image : nparray
(H, W, C) image represented as an nparray
max_iter : int
Number of iterations to run
print_every : int
Frequency of status update
Returns
-------
new_centroids : nparray
Updated centroids
"""
# *** START YOUR CODE ***
# raise NotImplementedError('update_centroids function not implemented')
# Usually expected to converge long before `max_iter` iterations
# Initialize `dist` vector to keep track of distance to every centroid
# Loop over all centroids and store distances in `dist`
# Find closest centroid and update `new_centroids`
# Update `new_centroids`
H, W, C = image.shape
it = 0
while it<max_iter:
idx = np.zeros((H, W))
for i in range(H):
for j in range(W):
idx[i, j] = np.argmin(np.linalg.norm(centroids - image[i, j], axis=1))
loss = 0
for k in range(centroids.shape[0]):
pixel_group = image[idx==k]
if pixel_group.shape[0] > 0:
centroids[k] = pixel_group.mean(axis=0)
loss += np.linalg.norm(pixel_group - centroids[k], axis=1).sum() / pixel_group.shape[0]
it += 1
if it%print_every == 0:
print(f'Update centroids for {it} iterations. loss: {loss}')
new_centroids = centroids.astype('int')
# *** END YOUR CODE ***
return new_centroids
def update_image(image, centroids):
"""
Update RGB values of pixels in `image` by finding
the closest among the `centroids`
Parameters
----------
image : nparray
(H, W, C) image represented as an nparray
centroids : int
The centroids stored as an nparray
Returns
-------
image : nparray
Updated image
"""
# *** START YOUR CODE ***
# raise NotImplementedError('update_image function not implemented')
# Initialize `dist` vector to keep track of distance to every centroid
# Loop over all centroids and store distances in `dist`
# Find closest centroid and update pixel value in `image`
H, W, C = image.shape
for i in range(H):
for j in range(W):
idx = np.argmin(np.linalg.norm(centroids - image[i, j], axis=1))
image[i, j] = centroids[idx]
# *** END YOUR CODE ***
return image
def main(args):
# Setup
max_iter = args['max_iter']
print_every = args['print_every']
image_path_small = args['small_path']
image_path_large = args['large_path']
num_clusters = args['num_clusters']
figure_idx = 0
# Load small image
image = np.copy(mpimg.imread(image_path_small))
print('[INFO] Loaded small image with shape: {}'.format(np.shape(image)))
plt.figure(figure_idx)
figure_idx += 1
plt.imshow(image)
plt.title('Original small image')
plt.axis('off')
savepath = os.path.join('./output', 'orig_small.png')
plt.savefig(savepath, transparent=True, format='png', bbox_inches='tight')
# Initialize centroids
print('[INFO] Centroids initialized')
centroids_init = init_centroids(num_clusters, image)
# Update centroids
print(25 * '=')
print('Updating centroids ...')
print(25 * '=')
centroids = update_centroids(centroids_init, image, max_iter, print_every)
# Load large image
image = np.copy(mpimg.imread(image_path_large))
image.setflags(write=1)
print('[INFO] Loaded large image with shape: {}'.format(np.shape(image)))
plt.figure(figure_idx)
figure_idx += 1
plt.imshow(image)
plt.title('Original large image')
plt.axis('off')
savepath = os.path.join('.', 'orig_large.png')
plt.savefig(fname=savepath, transparent=True, format='png', bbox_inches='tight')
# Update large image with centroids calculated on small image
print(25 * '=')
print('Updating large image ...')
print(25 * '=')
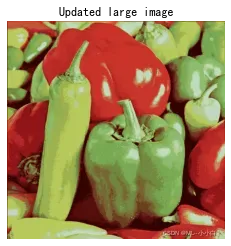
image_clustered = update_image(image, centroids)
plt.figure(figure_idx)
figure_idx += 1
plt.imshow(image_clustered)
plt.title('Updated large image')
plt.axis('off')
savepath = os.path.join('.', 'updated_large.png')
plt.savefig(fname=savepath, transparent=True, format='png', bbox_inches='tight')
print('\nCOMPLETE')
plt.show()
args = {'small_path':'./data/peppers-small.tiff',
        'large_path':'./data/peppers-large.tiff',
        'max_iter':150,
        'num_clusters':16,
        'print_every':10}
main(args)
[INFO] Loaded small image with shape: (128, 128, 3)
[INFO] Centroids initialized
=========================
Updating centroids ...
=========================
Update centroids for 10 iterations. loss: 287.33406566714154
Update centroids for 20 iterations. loss: 293.17031707511075
Update centroids for 30 iterations. loss: 289.05463689408185
Update centroids for 40 iterations. loss: 289.7203342683508
Update centroids for 50 iterations. loss: 291.69857088474464
Update centroids for 60 iterations. loss: 292.7079380586075
Update centroids for 70 iterations. loss: 294.0093854504812
Update centroids for 80 iterations. loss: 290.71606658419853
Update centroids for 90 iterations. loss: 289.3786115762488
Update centroids for 100 iterations. loss: 289.2435041593222
Update centroids for 110 iterations. loss: 289.3114982662104
Update centroids for 120 iterations. loss: 289.4224368481482
Update centroids for 130 iterations. loss: 289.4559613074356
Update centroids for 140 iterations. loss: 289.66534816497483
Update centroids for 150 iterations. loss: 289.74233512832046
[INFO] Loaded large image with shape: (512, 512, 3)
=========================
Updating large image ...
=========================

COMPLETE
(f)
原始图像3个通道,对于其中一个像素,每个通道使用一个字节(8bits=1Byte)表示通道颜色,所以一共是3个字节(24bits),变换之后,对一个像素而言,只有16种颜色可以选择,只需要,也就是4bits就可以表示,因此压缩因子为
文章出处登录后可见!
已经登录?立即刷新