前言
MATLAB进行图像处理相关的学习是非常友好的,可以从零开始,对基础的图像处理都已经有了封装好的许多可直接调用的函数,这个系列文章的话主要就是介绍一些大家在MATLAB中常用一些概念函数进行例程演示!
MATLAB分别绘制图像在RGB,HSI,CIE各颜色空间通道的图像,在MATLAB2015平台仿真成功,记录一下。
一. MATLAB仿真
%%%%%%%%%%%%%%%%%%%%%%%%%%%%%%%%%%%%%%%%%%%%%%%%%%%%
%功能:绘制图像RGB与HSI颜色空间
%环境:Win7,Matlab2015b
%Modi: C.S
%时间:2022-05-09
%%%%%%%%%%%%%%%%%%%%%%%%%%%%%%%%%%%%%%%%%%%%%%%%%%%%
close all;
clear all
clc
tic
[filename,pathname]=uigetfile('*.jpg;*.png;*.bmp','select the file');
im=[pathname,filename];
%% RGB
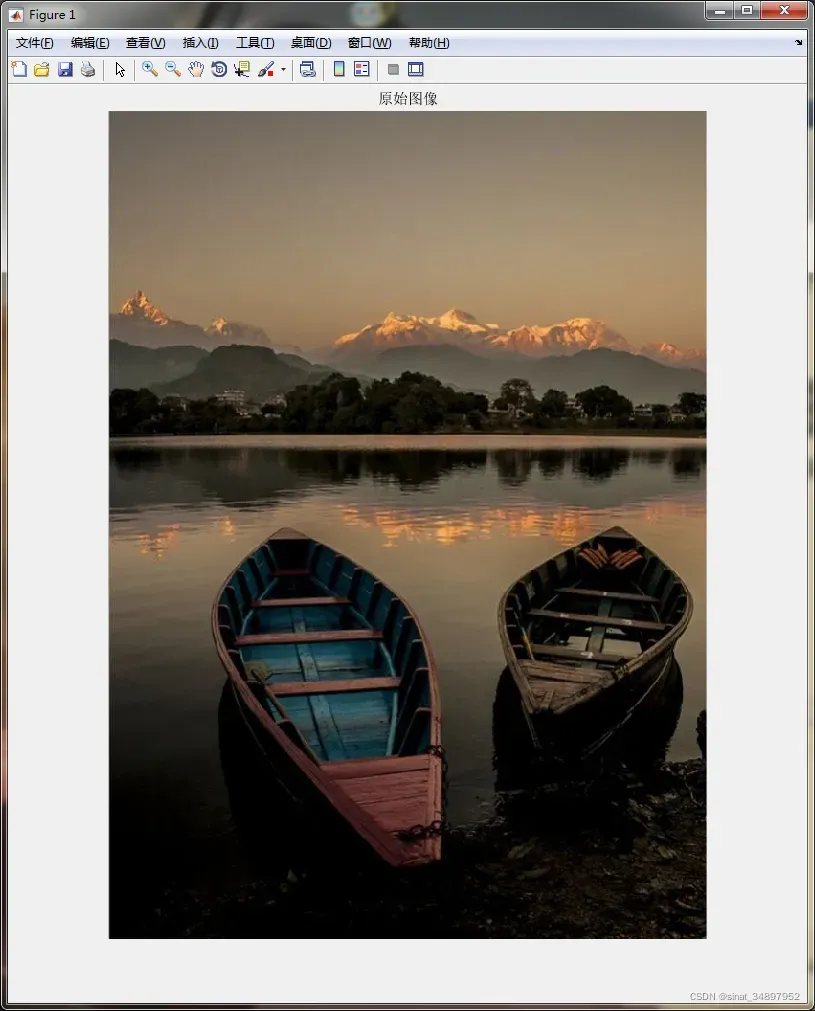
I=imread(im);
figure(1);imshow(I);%显示原始彩色图像
title('原始图像');
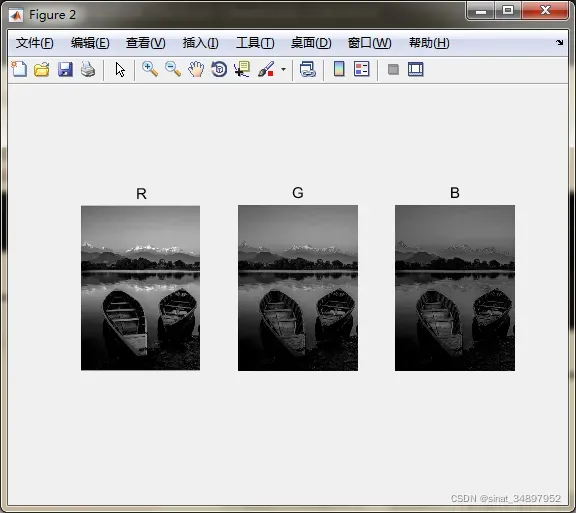
r = I(:,:,1); %通道R
g = I(:,:,2); %通道G
b = I(:,:,3); %通道B
figure(2);subplot(131);imshow(r);title('R');
subplot(132);imshow(g);title('G');
subplot(133);imshow(b);title('B');
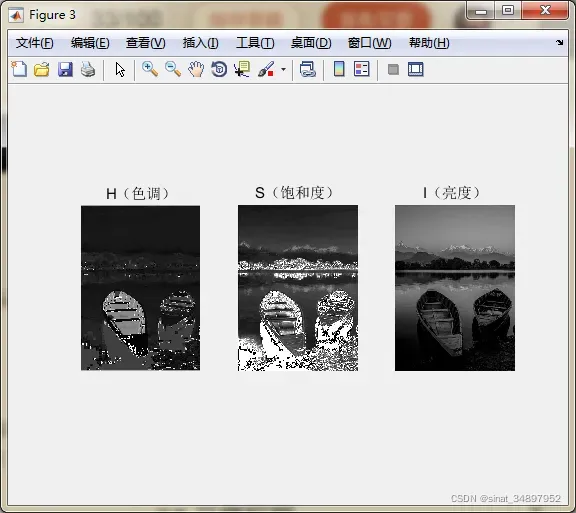
%% HSI颜色空间
iHsi=rgb2hsi(I);
hsi_H=iHsi(:,:,1); %色调
hsi_S=iHsi(:,:,2); %饱和度
hsi_I=iHsi(:,:,3); %亮度
figure(3);subplot(131);imshow(hsi_H);title('H(色调)');
subplot(132);imshow(hsi_S);title('S(饱和度)');
subplot(133);imshow(hsi_I);title('I(亮度)');
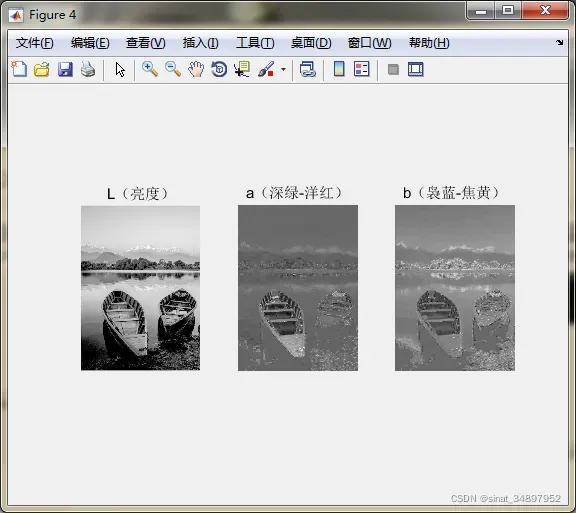
%% CIE颜色空间
iLab = RGB2Lab(I);
L=iLab(:,:,1); %色调
a=iLab(:,:,2); %饱和度
b=iLab(:,:,3); %亮度
figure(4);subplot(131);imshow(L,[]);title('L(亮度)');
subplot(132);imshow(a,[]);title('a(深绿-洋红)');
subplot(133);imshow(b,[]);title('b(袅蓝-焦黄)');
toc
function [hsi] = rgb2hsi(rgb)
%   此处显示详细说明
rgb=im2double(rgb);
r=rgb(:,:,1);
g=rgb(:,:,2);
b=rgb(:,:,3);

%   H 单位弧度
num=0.5*((r-g)+(r-b));
den=sqrt( (r-g).^2 + (r-b).*(g-b) );
theta=acos(num./(den+eps)); %分母+eps防止为0  acos得到的是弧度
H0=theta.*(g>=b);   %G>=B
H1=(2*pi-theta).*(g<b);  %G<B
H=H0+H1;
% %转成角度
% H=H.*360./(2*pi);

%   S
num=3.*min(min(r,g),b);
S=1-num./(r+g+b+eps);

%   I
I=(r+g+b)/3;

H=(H-min(min(H)))./(max(max(H))-min(min(H)));
S=(S-min(min(S)))./(max(max(S))-min(min(S)));

hsi=cat(3,H,S,I);

end
function [Lab] = RGB2Lab(img)
%   此处显示详细说明
if nargin == 1     %nargin:输入参数的个数
    img=im2double(img);
    R=img(:,:,1);
    G=img(:,:,2);
    B=img(:,:,3);
end

% Set a threshold
T = 0.008856;   % (6/29)^3

[M, N] = size(R);
s = M * N;
RGB = [reshape(R,1,s); reshape(G,1,s); reshape(B,1,s)];

% RGB to XYZ
MAT = [0.412453 0.357580 0.180423;
       0.212671 0.715160 0.072169;
       0.019334 0.119193 0.950227];
XYZ = MAT * RGB;

% Normalize for D65 white point
%   调整x y z的取值范围在[0,255]
X = XYZ(1,:) / 0.950456;
Y = XYZ(2,:);
Z = XYZ(3,:) / 1.088754;

XT = X > T;
YT = Y > T;
ZT = Z > T;

Y3 = Y.^(1/3);


% ~XT:举证0 1 取反
fX = XT .* X.^(1/3) + (~XT) .* (7.787 .* X + 4/29);
fY = YT .* Y.^(1/3) + (~YT) .* (7.787 .* Y + 4/29);
fZ = ZT .* Z.^(1/3) + (~ZT) .* (7.787 .* Z + 4/29);

% L = reshape(YT .* (116 * Y3 - 16.0) + (~YT) .* (903.3 * Y), M, N);
L = reshape( 116 * fY - 16.0, M, N);
a = reshape(500 * (fX - fY), M, N);
b = reshape(200 * (fY - fZ), M, N);

if nargout < 2      %nargout:输出参数的个数
  Lab = cat(3,L,a,b);
  % 结果归一化到0-1
  Lab=Lab./255;
end
二. 仿真结果
三. 小结
也是问答中看到的需求,图像的颜色空间无非是通过不同的通道数据表示图像,所以各颜色空间可以通过转换相互得到,简单笔记一下。每天学一个MATLAB小知识,大家一起来学习进步阿!
文章出处登录后可见!
已经登录?立即刷新