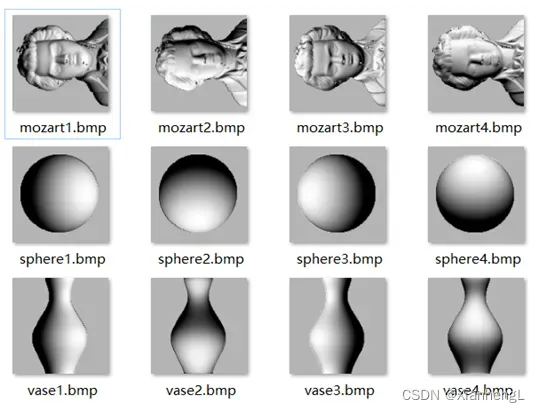
(1)实验素材中提供了花瓶,球,莫扎特半身像的高度数据(vase.mat, mozart.mat, sphere.mat)。利用load命令将高度数据加载后,对高度数据求出梯度,并转化为法向量。自行编写程序绘制各物体(花瓶,球,莫扎特)基于朗伯模型的四幅图像,四幅图像的光照角度设置为:slant角45度不变,Tilt角度分别为0,90,180,270度的四幅照片,分别存为sphere1.bmp,sphere2.bmp,sphere3.bmp,sphere4.bmp;vase1.bmp, vase2.bmp,vase3.bmp,vase4.bmp;Mozart1.bmp,Mozart2.bmp,Mozart3.bmp, Mozart4.bmp。
MATLAB代码:
clc;clear;close all;
input_path = './';
out_path = './result_langbo/';
file_mat = dir([input_path '*.mat']);
for j = 1:3
    Z = load([input_path file_mat(j).name]);
    Z = Z.Z;
    figure,mesh(Z);title([file_mat(j).name(1:end-4),'高度数据'])  %画三维网格图

    for i = 0:3
        slant = 45*pi/180; %光照方向
        tilt = i*90*pi/180;
        [p,q] = calculate_gradients(Z,0,0); %计算x,y方向梯度
        % albedo = 1;  %反照率
        bb = sqrt(p.^2+q.^2+1); %分母
        %I = a + ρ*n*l
        %I:朗博图像
        %a: 背景光,(反照率 = 反射光能力/入射光能量)
        %ρ:
        %n:法向量 n=[-p,-q,1]  归一化
        %l:方向光(光照向量)l = [cos(tilt)sin(slant),sin(tilt)sin(slant),cos(slant)].T

        I = (-p.*cos(tilt).*sin(slant)-...
            q.*sin(tilt).*sin(slant)+cos(slant))./bb;
        figure,imshow(I);title(['tilt为',num2str(i*90),'度的朗伯模型']);
        imwrite(I,[out_path file_mat(j).name(1:end-4),num2str(i+1),'.bmp']);
    end
end
代码中的函数文件:
calculate_gradients.m
function [gx,gy,gx_d,gy_d] = calculate_gradients(img,GRADIENTS_CALCULATION,USE_DIAG)
gx_d = [];
gy_d = [];
if(~exist('USE_DIAG','var'))
    USE_DIAG = 0;
end
% find gradients in ambient image
if(GRADIENTS_CALCULATION==0)
    [H,W] = size(img);
    gx = zeros(H,W);
    gy = zeros(H,W);
    if(USE_DIAG)
        j = 2:H-1;
        k = 2:W-1;
        gx(j,k) = img(j,k+1) - img(j,k);
        gy(j,k) = img(j+1,k) - img(j,k);
        gx_d = zeros(H,W);
        gy_d = zeros(H,W);
        gx_d(j,k) = img(j+1,k+1) - img(j,k);
        gy_d(j,k) = img(j-1,k+1) - img(j,k);
    else
        j = 1:H;
        k = 1:W-1;
        gx(j,k) = img(j,k+1) - img(j,k);
        j = 1:H-1;
        k = 1:W;
        gy(j,k) = img(j+1,k) - img(j,k);
    end
    clear j k
elseif(GRADIENTS_CALCULATION==1)
    [gx,gy] = gradient(img);
elseif(GRADIENTS_CALCULATION==2)
    gradop = firstOrderDerivative(6);
    gx = imfilter(img,gradop,'symmetric');
    gy = imfilter(img,gradop','symmetric');
elseif(GRADIENTS_CALCULATION==3)
    [gx,gy] = cubic_gradients(img);
elseif(GRADIENTS_CALCULATION==-1)
    % New gradient definition
    [H,W] = size(img);
    gx = zeros(H,W);
    gy = zeros(H,W);
    if(USE_DIAG)
        j = 2:H-1;
        k = 2:W-1;
    else
        j = 1:H-1;
        k = 1:W-1;
    end
    gx(j,k) = img(j+1,k+1) - img(j+1,k);
    gy(j,k) = img(j+1,k+1) - img(j,k+1);
    if(USE_DIAG)
        error('Calculate_GRadients: code not written');
    end
    clear j k
elseif(GRADIENTS_CALCULATION==-2)
    %backward differences
    [H,W] = size(img);
    gx = zeros(H,W);
    gy = zeros(H,W);
    j = 2:H;
    k = 2:W;
    gx(j,k) = img(j,k) - img(j,k-1);
    gy(j,k) = img(j,k) - img(j-1,k);
    clear j k
    if(USE_DIAG)
        error('Calculate_GRadients: code not written');
    end
elseif(GRADIENTS_CALCULATION==4)
    [H,W] = size(img);
    img = padarray(img,[1 1],0,'post');
    gx = zeros(H,W);
    gy = zeros(H,W);
    if(USE_DIAG)
        error('Code not written');
    else
        j = 1:H;
        k = 1:W;
    end
    gx(j,k) = img(j,k+1) - img(j,k);
    gy(j,k) = img(j+1,k) - img(j,k);
    clear j k
else
    error('Variable GRADIENTS_CALCULATION is not set');
end
结果:
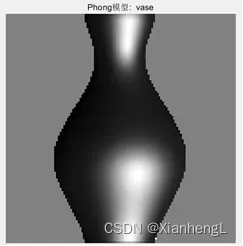
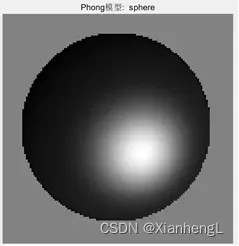
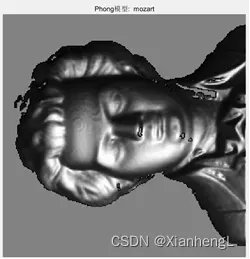
(2)实验素材中提供了花瓶,球,莫扎特半身像的高度数据(vase.mat, mozart.mat, sphere.mat)。利用load命令将高度数据加载后,对高度数据求出梯度,并转化为法向量。自行编写程序绘制各物体(花瓶,球,莫扎特)基于Phong模型的四幅图像,Phong模型常数项设置如:ka=0.1; kd=0.1; ks=1; ke=10; 视角方向设置为[0,0,1]; 光照方向随意设置。分别绘制花瓶,球,莫扎特各物体的Phong图像一幅。
MATLAB代码:
clc;clear;close all;
input_path = './';
out_path = './result_phong/';
file_mat = dir([input_path '*.mat']);
for i = 1:3
    Z = load([input_path file_mat(i).name]);
    Z = Z.Z;
    %figure,mesh(Z);title([file_mat(i).name(1:end-4),'高度数据'])  %画三维网格图

    [m,n] = size(Z);
    slant = 45*pi/180; %光照方向任意
    tilt =45*pi/180;
    V = [0,0,1]';  %定义视角方向
    L = [cos(tilt).*sin(slant),sin(tilt).*sin(slant),cos(slant)]';
    %L : 定光照方向
    H = (V+L); %定光照和视角的平分向量
    H = H./norm(H); %计算平分向量 norm:反回两点欧氏距离
    [p,q] = calculate_gradients(Z,0,0); %计算x,y方向梯度
    bb = sqrt(p.^2+q.^2+1); %分母

    N = zeros(m*n,3);  %法向量
    N(:,1)=reshape(-p./bb,[m*n,1]);%Nx
    N(:,2)=reshape(-q./bb,[m*n,1]);%Ny
    N(:,3)=reshape(1./bb,[m*n,1]); %Nz
    %光照参数设置
    ka=0.1; %环境光参数
    kd=0.1;%漫反射参数
    ks=1;  %镜面反射参数
    ke=10; %镜面反射指数
    image=ka+kd*(N*L)+ks*power((N*H),ke);
    im=reshape(image,[m,n]);
    figure;imshow(mat2gray(im));
    title(['Phong模型:  ',file_mat(i).name(1:end-4)]);
end
结果:
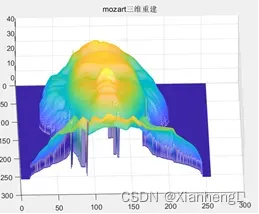
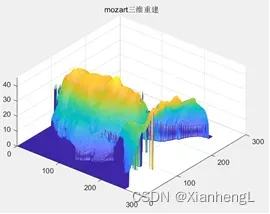
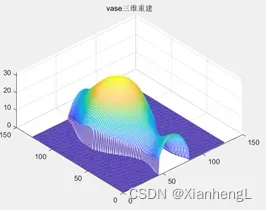
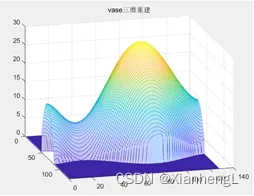
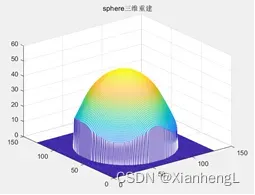
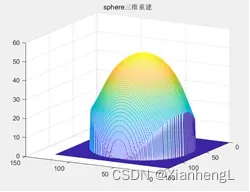
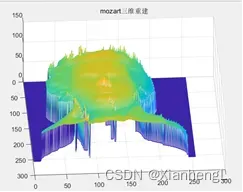
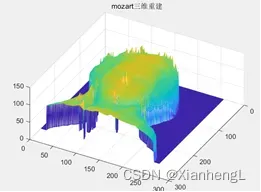
(3)利用(1)中绘制的每个物体四幅图像,重建物体的表面三维形状
a.利用I1=im2double(imread(‘vase45_0.bmp(以实际图像名为准)’))分别将图像导入。
b. 根据四幅图像估算梯度的原理,自行计算物体的梯度值。将计算得到的梯度p,q,用mesh函数绘制出来,观察是否正确,调用方法为figure,mesh§;figure,mesh(q);
c.自行生成图像的掩模图像(掩模要求背景处为0,物体处为1),并将该掩模图像转换为二值矩阵mask,利用提供的积分函数(integrate_horn2,或者integration,请根据各自参数要求调用)对梯度p,q进行积分,并显示。
提示:需自己生成掩模图像,生成掩模图像mask时,可设一阈值,如thresh,大于thresh的像素处赋值为1,小于thresh的像素处赋值为0;如:mask=I>thresh;当然,这样生成的掩模可能还有好多黑点或者噪声,可将该掩模存为图像,并手动在画图软件中将噪声去除。
MATLAB代码:
clc;clear;close all;
input_path = './result_langbo/';
file = dir([input_path '*.bmp']);
mat_file = dir(['./' '*.mat']);

for i = 1:3
    I1=im2double(imread([input_path file(1+(i-1)*4).name]));
    I2=im2double(imread([input_path file(2+(i-1)*4).name]));
    I3=im2double(imread([input_path file(3+(i-1)*4).name]));
    I4=im2double(imread([input_path file(4+(i-1)*4).name]));

    back=I1+I2+I3+I4;
    p=-2*(I1-I3)./(back+0.0001);
    q=-2*(I2-I4)./(back+0.0001);

    %figure,subplot(121);mesh(p);subplot(122);mesh(q);
    %生成掩模图像
    mask = load(mat_file(i).name).Z;
    immask= mask > 0.6 ;
    %figure,imshow(immask);
    %imwrite(immask,['./' mat_file(i).name(1:end-4),'imask.bmp']);

    %height=integration(p,q,immask);
    height=integrate_horn2(p,q,immask,5000,1);
    figure,mesh(height);
    title([file(1+(i-1)*4).name(1:end-5) '三维重建']);
end
上述代码中的函数文件:
①integration.m
function [height]=integration(p,q,M)
[H,W]=size(p);
[ycord,xcord]=find(M);%%%%%%%  M=1,represent the no height point
[noValidPoints,j]=size(ycord);
height1=zeros(H,W);
height2=zeros(H,W);
T=zeros(H,W);
S=zeros(2,H*W+1);
S(1,1:noValidPoints)=xcord(:);
S(2,1:noValidPoints)=ycord(:);%%%% the known height of piont

n=noValidPoints;  %%the number of the known height of piont
m=1;
x=S(1,m);
y=S(2,m);
clear j ycord xcord;

while m<n | m==n
    y1=y;
    if M(y1,x) %如果M处为1
        if x<W&~M(y1,x+1)
            height1(y1,x)=height1(y1,x+1)-p(y1,x);
            M(y1,x)=0;
        else
            if x>1&~M(y1,x-1)
            height1(y1,x)=height1(y1,x-1)+p(y1,x-1);
            M(y1,x)=0;
            end
        end
    end
%     while (~M(y1,x) & y1>1& M(y1-1,x))
%         height(y1-1,x) = height(y1,x) - q(y1-1,x);
%         M(y1-1,x) = 0;
%         y1 = y1-1;
%     end
%
%     spanLeft = 0;
%     spanRight = 0;
%
%     % scanline  % get height from top
%     while y1<H | y1==H
%         if T(y1,x)
%             break; % avoid being scanned twice
%         end
%         if M(y1,x)
%            height(y1,x) = height(y1-1,x) + q(y1-1,x); % get height from top
%            M(y1,x) = 0;
%         end
%         T(y1,x) = 1; % Mark the points scaned both left and right sides
%         if (y1<H )
%             y1=y1+1;
%         else
%             break;
%         end
%     end

    m = m+1;
    x = S(1,m);
    y = S(2,m);
end
%figure,mesh(height1);
while m<n | m==n
   if M(y,x) %如果M处为1
        if y<H&~M(y+1,x)
            height2(y,x)=height2(y+1,x+1)-p(y,x);
            M(y,x)=0;
        else
            if y>1&~M(y-1,x)
            height2(y,x)=height2(y-1,x)+p(y-1,x);
            M(y,x)=0;
            end
        end
    end

    m = m+1;
    x = S(1,m);
    y = S(2,m);
end
%figure,mesh(height2);
height=(height1+height2)/2;
②integrate_horn2,m
function g = integrate_horn2(gx,gy,mask,niter,verbose,filename,init)
%function g = integrate_horn(gx,gy,mask,niter,verbose,filename,init)
% integrate_horn.m recovers the function g from its partial derivatives gx and gy.
%  mask is a binary image which tells which pixels are involved in  integration.
% niter is the number of iterations.typically 100,000 or 200,000, although the trend can be seen even after 1000 iterations.
% verbose gives the option of displaying or  not displaying intermediate  value of g.  g is displayed every 1000 iterations if verbose is 1.
% In the given example, I have included gx, gy and the mask. The usage is: integrate_horn(gx,gy,mask,5000,1).
% Also, note that integrate_horn integrates in a piecewise manner. In the example, we are showing a sphere in front of a back-ground, The sphere is segmented out as
% one object and the background is another object. mask ensures that we integrate only the region belonging to the sphere.
% To integrate the background,we will have to run integrate_horn.m all over again with a  different mask. Lastly, x is the dimension
% from left to right  and y is from top to bottom.

interval = 10000;

if nargin < 6;
    save_flag = 0;
else
    save_flag = 1;
end

[N1,N2]=size(gx);
if nargin < 7;
    g= ones(N1,N2);
else
    fprintf('reading data');
  g = struct2array(load(init,'g'));
end

gx = gx.*mask;
gy = gy.*mask;

tic;
A = [0 1 0;
     0 0 0
     0 0 0]; % y-1

B = [0 0 0;
     1 0 0;
     0 0 0]; % x-1

C = [0 0 0
     0 0 1
     0 0 0]; % x+1

D = [0 0 0;
     0 0 0;
     0 1 0]; % y+1

d_mask =double(A+B+C+D);
mask=double(mask);

den = conv2(mask,d_mask,'same').*mask;
den(den==0)=1;
rden=1.0 ./den;
m_a = conv2(mask,A,'same');
m_b = conv2(mask,B,'same');
m_c = conv2(mask,C,'same');
m_d = conv2(mask,D,'same');

term_right =  m_c.*gx +m_d.*gy;
t_a = -conv2(gx,B,'same');
t_b = -conv2(gy,A,'same');
term_right = term_right+t_a+t_b;


fprintf('\n');
mask2=rden.*mask;
term_right_tmp=mask2.*term_right;
for k=1:niter
    g = mask2.*conv2(g,d_mask,'same') +term_right_tmp;

    if(verbose)
        if mod(k,1000) == 0;
            handle=figure(1);
            imagesc(g);
            axis image;
            axis off
            axis equal
            colormap jet;
            drawnow;
            fprintf('%d\n',k);
        end
    end

    if save_flag & mod(k, interval ) == 0;
        fprintf('saving\n');
        save(filename,'g');
    end;

end;

if save_flag;
    save(filename,'g');
end
%%%%%%%%the following is added by syj

ming=min(min(g));
g=g+abs(ming);
g=g.*mask;
结果:
MATLAB代码:
clc;clear;close all;
input_path = './result_langbo/';
file = dir([input_path '*.bmp']);
mat_file = dir(['./' '*.mat']);
for i = 1:3
I=[];
Z = load(mat_file(i).name).Z;
[m,n] = size(Z);
for j = 1:3
bmp = imread([input_path strcat(mat_file(i).name(1:end-4),num2str(j),'.bmp')]);
doub = bmp(1:m*m);
doub = double(doub);
I = [I; doub];
end
I = I';
A = ones(m*n,3);
l1 = sqrt(2)/2 * [1,0,1];
l2 = sqrt(2)/2 * [0,1,1];
l3 = sqrt(2)/2 * [-1,0,1];
L = [l1;l2;l3]'; %3*3
N = A.^(-1) .* (I*L^(-1));
Nx = N(:,1);
Ny = N(:,2);
Nz = N(:,3);
p = -Nx./Nz;
p = reshape(p,m,n);
q = -Ny./Nz;
q = reshape(q,m,n);
immask= Z > 0.8 ;
%height=integration(p,q,immask);
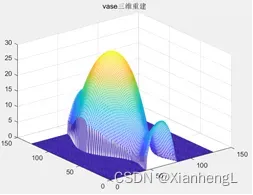
height = integrate_horn2(p,q,immask,5000,1);
figure,mesh(height);
title([file(1+(i-1)*4).name(1:end-5) '三维重建']);
end
结果:
文章出处登录后可见!