import numpy as np
import matplotlib.pyplot as plt
import pandas as pd
from sklearn.preprocessing import LabelEncoder
from sklearn.svm import SVC
data = pd.read_table('watermelon30a.txt', delimiter=',')
x = pd.DataFrame({'密度': data['密度'], '含糖率': data['含糖率']})
x = x.values.tolist()
encoder = LabelEncoder()
y = encoder.fit_transform(data['好瓜']).tolist()
x, y = np.array(x), np.array(y)
fig = plt.figure(figsize=[15, 10])
fig.add_subplot(1,2,1)
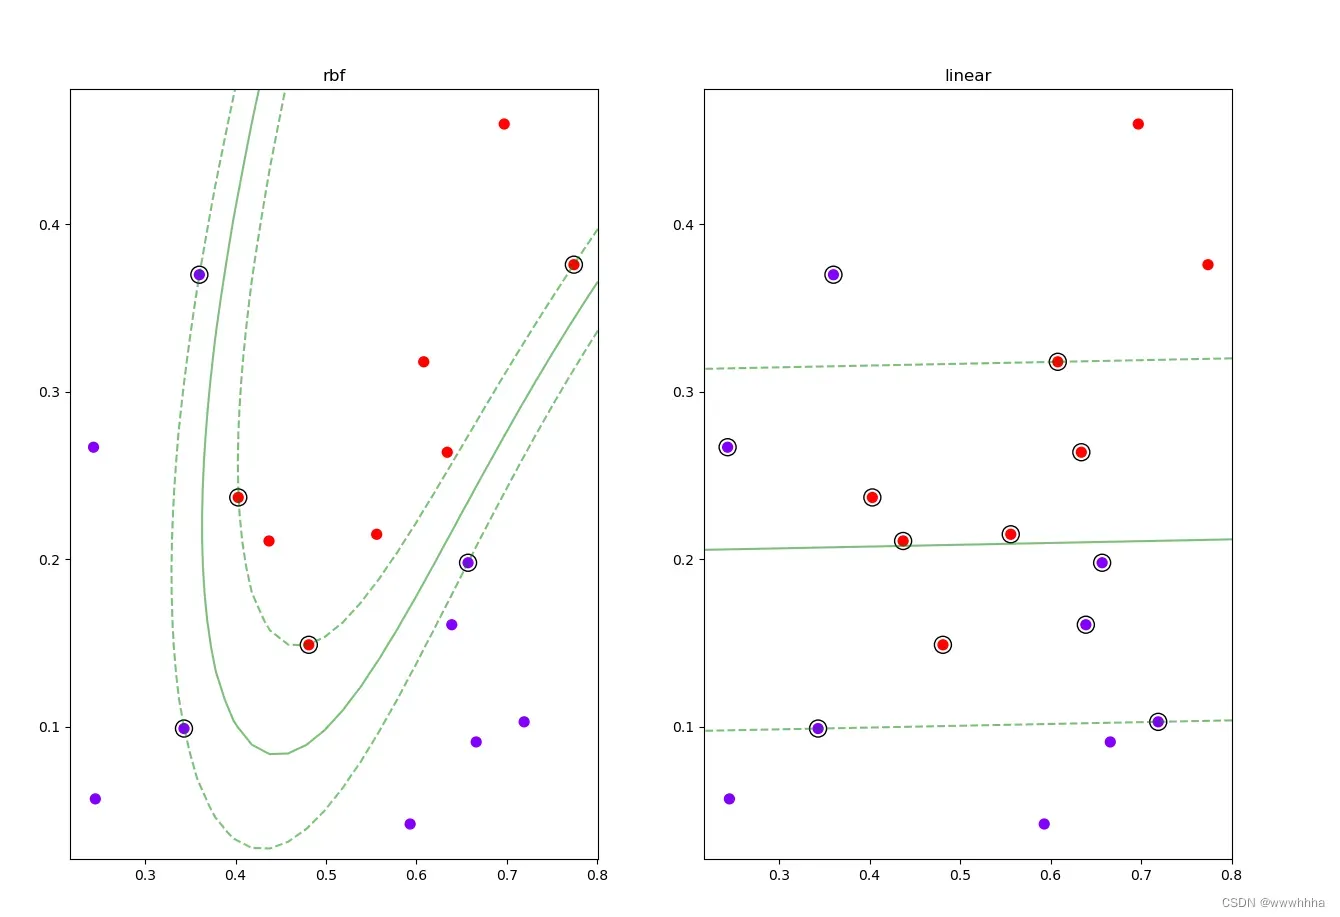
clf = SVC(kernel='rbf', gamma=2, C=1000)
clf.fit(x, y)
plt.scatter(x[:, 0], x[:, 1], c=y, cmap='rainbow', s=50)
ax = plt.gca()
xLim = ax.get_xlim()
yLim = ax.get_ylim()
xx = np.linspace(xLim[0], xLim[1], 30)
yy = np.linspace(yLim[0], yLim[1], 30)
yy, xx = np.meshgrid(yy, xx)
xy = np.vstack([xx.ravel(), yy.ravel()]).T
z = clf.decision_function(xy).reshape(xx.shape)
plt.contour(xx, yy, z, colors='g', levels=[-1, 0, 1], alpha=0.5, linestyles=['--', '-', '--'])
plt.scatter(clf.support_vectors_[:, 0], clf.support_vectors_[:, 1], s=150,
linewidths=1, facecolors='none', edgecolors='k', cmap='rainbow')
plt.title('rbf')
fig.add_subplot(1,2,2)
clf = SVC(kernel='linear', gamma=2, C=1000)
clf.fit(x, y)
plt.scatter(x[:, 0], x[:, 1], c=y, cmap='rainbow', s=50)
ax = plt.gca()
xLim = ax.get_xlim()
yLim = ax.get_ylim()
xx = np.linspace(xLim[0], xLim[1], 30)
yy = np.linspace(yLim[0], yLim[1], 30)
yy, xx = np.meshgrid(yy, xx)
xy = np.vstack([xx.ravel(), yy.ravel()]).T
z = clf.decision_function(xy).reshape(xx.shape)
plt.contour(xx, yy, z, colors='g', levels=[-1, 0, 1], alpha=0.5, linestyles=['--', '-', '--'])
plt.scatter(clf.support_vectors_[:, 0], clf.support_vectors_[:, 1], s=150,
linewidths=1, facecolors='none', edgecolors='k', cmap='rainbow')
plt.title('linear')
plt.show()
文章出处登录后可见!
已经登录?立即刷新