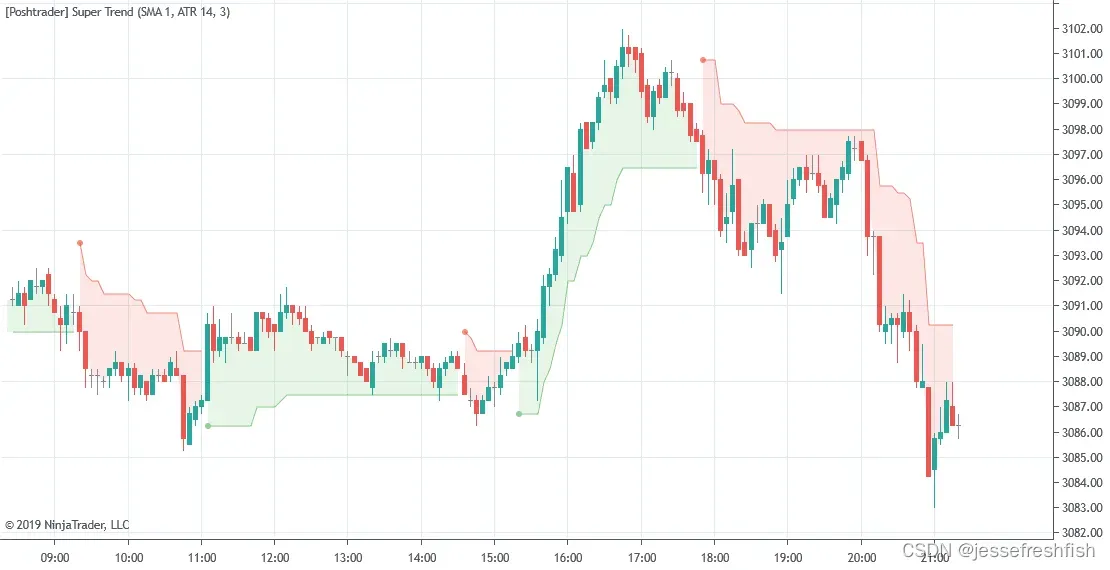
趋势指标(Super Trend Indicator)
超级趋势指标是一种显示当前趋势方向的指标,很像移动平均线。和其他的趋势指标相似,可以在趋势市场中运行良好,但震荡市场中,可能会给出过多错误信号。
这个指标听过见过很多次,但是在国内的行情软件上很少见,原因我觉得也无他:他并没有表现的比其他趋势指标优秀。
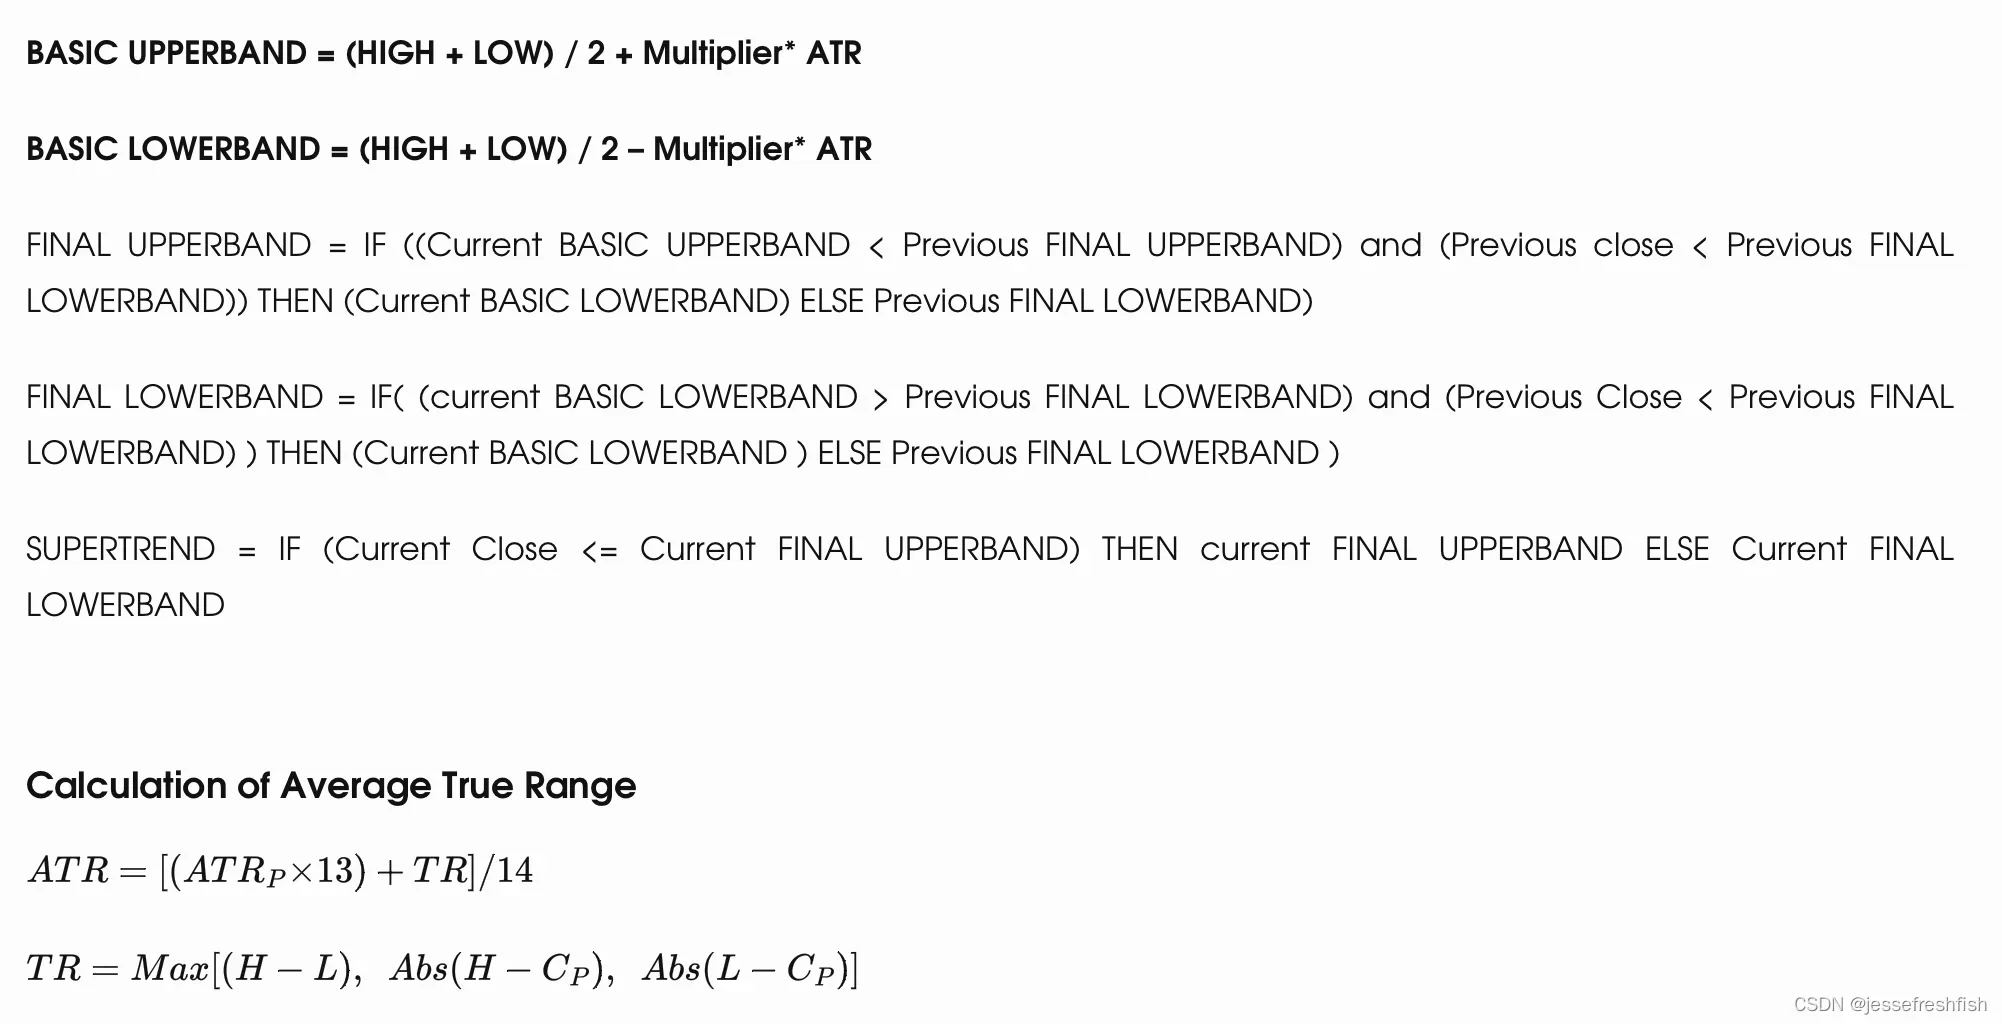
1、超级趋势指标(Super Trend Indicator)计算公式:
2、Python实现
import numpy as np
import pandas as pd


def super_trend(df, atr_period, multiplier):
	high = df['high']
	low = df['low']
	close = df['close']

	# 首先计算ATR
	price_diffs = [high - low, high - close.shift(), close.shift() - low]
	true_range = pd.concat(price_diffs, axis=1)
	true_range = true_range.abs().max(axis=1)
	atr = true_range.ewm(alpha=1 / atr_period, min_periods=atr_period).mean()

	#计算超级趋势指标
	hl2 = (high + low) / 2
	final_upperband = hl2 + (multiplier * atr)
	final_lowerband = hl2 - (multiplier * atr)

	st = [True] * len(df) # True代表上行趋势,False代表下行趋势

	for i in range(1, len(df.index)):
	    curr, prev = i, i - 1

	    # 如果当前收盘价上传上轨
	    if close[curr] > final_upperband[prev]:
	        st[curr] = True
	    # 当前收盘价下穿下轨
	    elif close[curr] < final_lowerband[prev]:
	        st[curr] = False
	    # 否则趋势延续
	    else:
	        st[curr] = st[prev]
	        if st[curr] and final_lowerband[curr] < final_lowerband[prev]:
	            final_lowerband[curr] = final_lowerband[prev]
	        if not st[curr] and final_upperband[curr] > final_upperband[prev]:
	            final_upperband[curr] = final_upperband[prev]

	    # 根据趋势方向分别移除相应的上下轨
	    if st[curr]:
	        final_upperband[curr] = np.nan
	    else:
	        final_lowerband[curr] = np.nan
    return pd.DataFrame({
        'Supertrend': st,
        'Final Lowerband': final_lowerband,
        'Final Upperband': final_upperband
    }, index=df.index)
3、测试
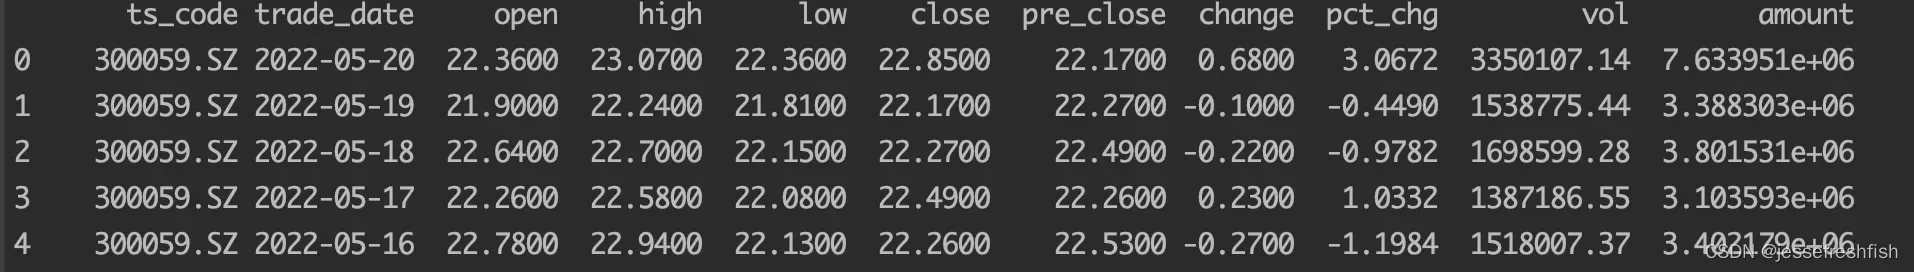
以东方财富2021-01-04~2022-05-20的日K数据测试,并使用mplfinance绘制图形。
import mplfinace as mpf
data = pd.read_csv('../csv_data/stocks/300059.SZ.csv', parse_dates=["trade_date"], index_col=0)
data = data[['trade_date', 'open', 'high', 'low', 'close', 'vol']].sort_index(ascending=False)
data = data.reset_index(drop=True)
data.set_index('trade_date', drop=True, inplace=True)

atr_period = 34
atr_multiplier = 3.0
supertrend = super_trend(data, atr_period, atr_multiplier)
data = data.join(supertrend)
print(data.tail())
std = [mpf.make_addplot(data['Final Upperband'], color='g'), mpf.make_addplot(data['Final Lowerband'], color='r')]
mpf.plot(data, type='candle', style='charles', addplot=std, tight_layout=True)
绘制的图形如下:
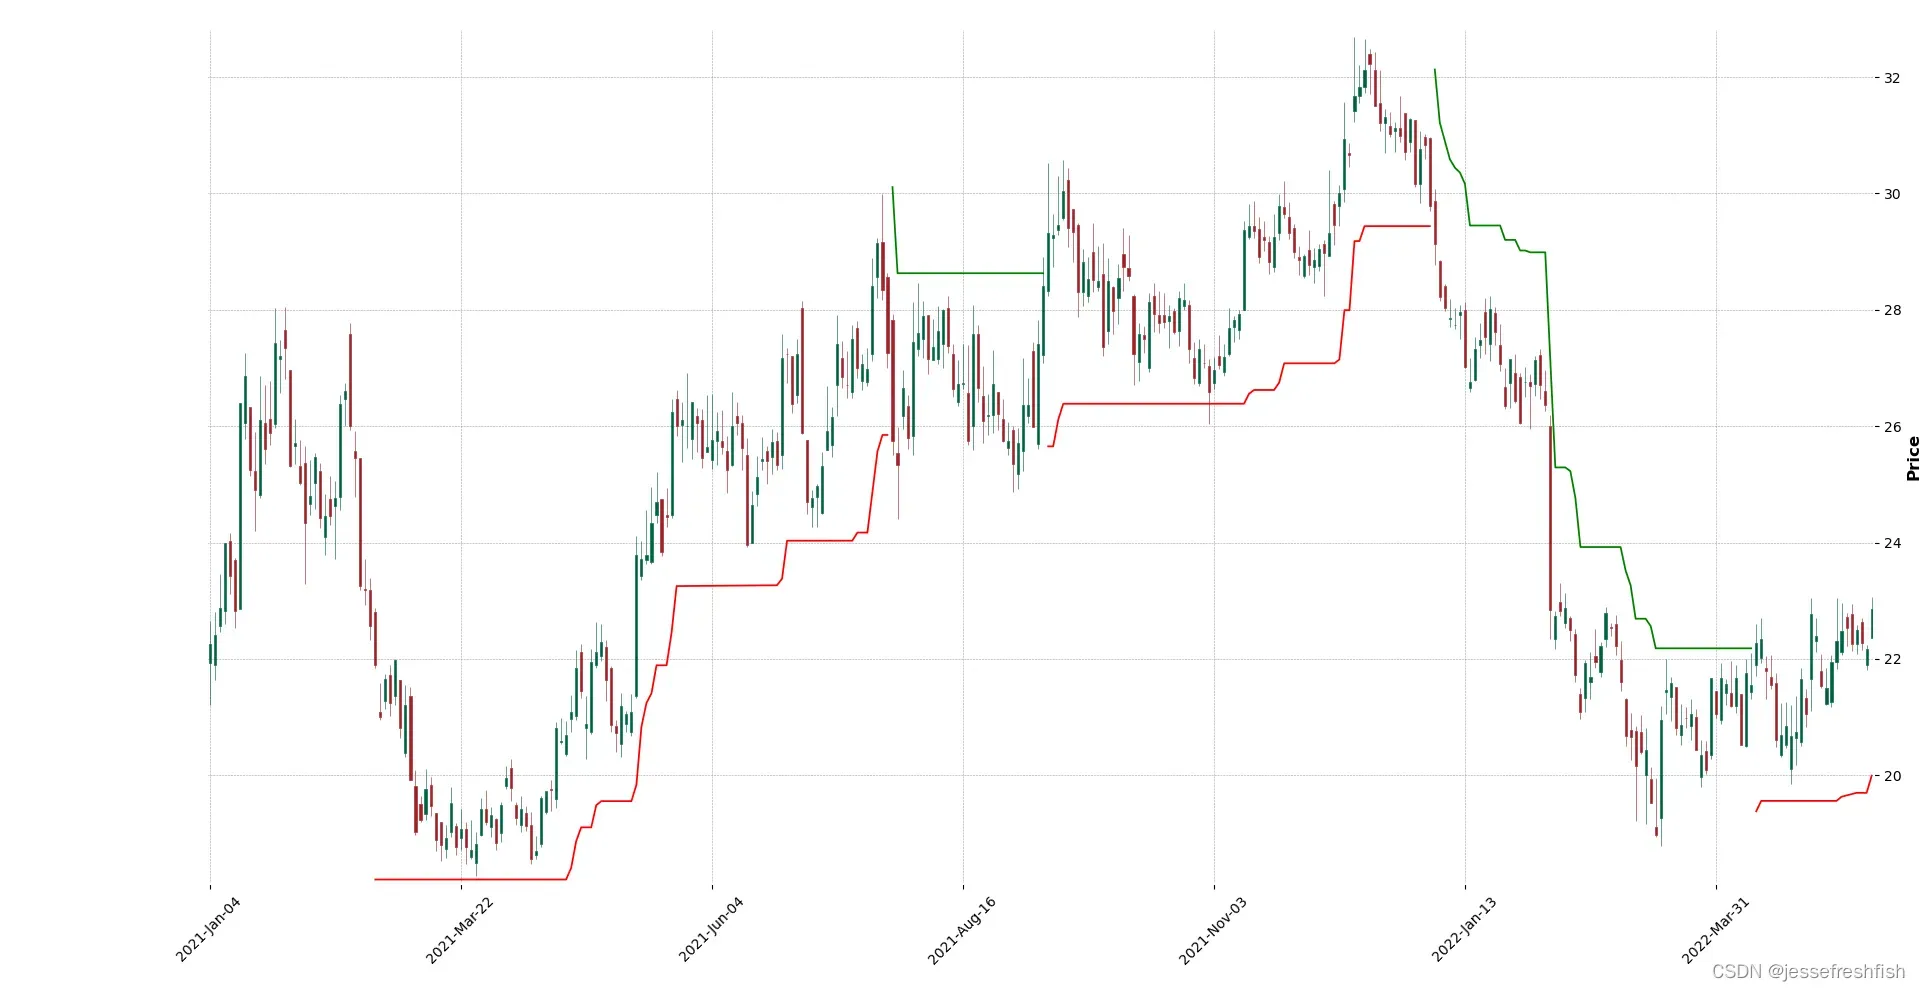
看上去正确的刻画了趋势,也符合直觉。OVER!
文章出处登录后可见!
已经登录?立即刷新