1.鸢尾花数据集
-
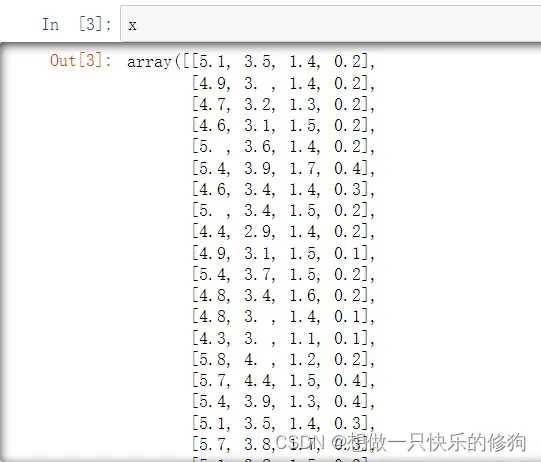
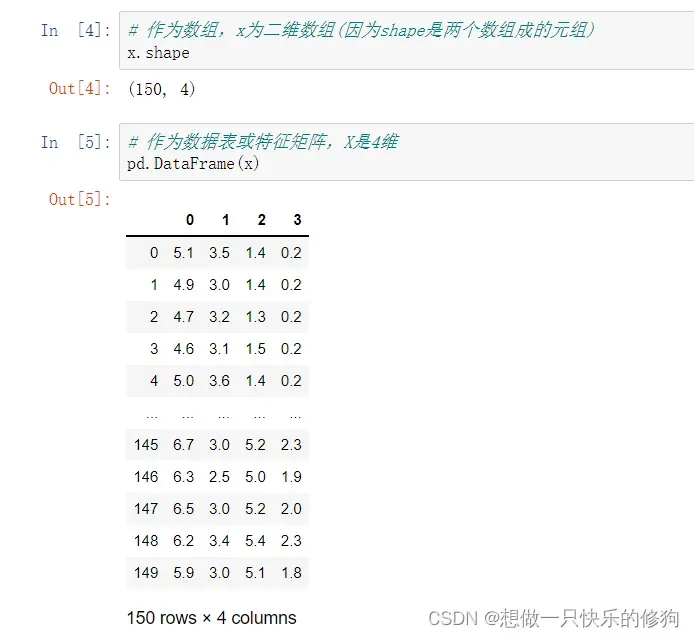
特征
-
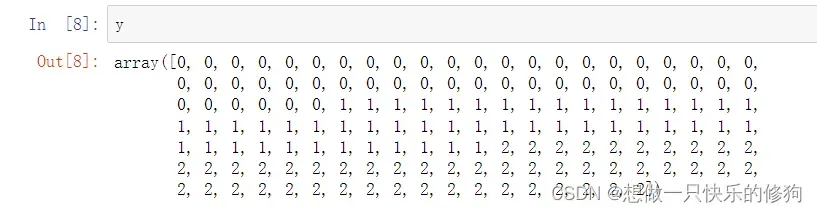
目标值
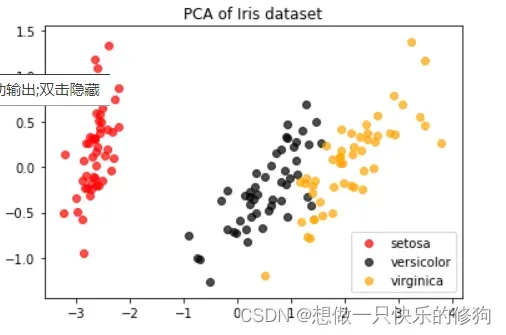
2. PCA降维实现
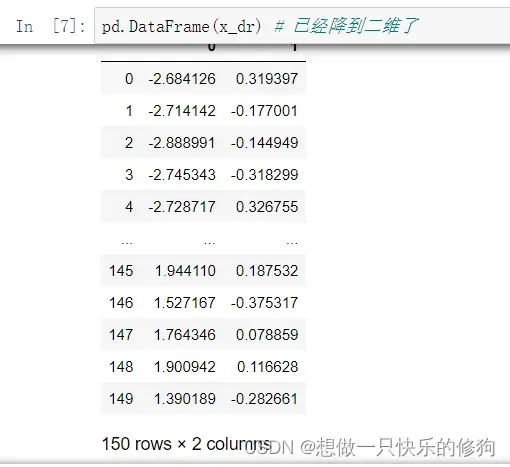
将4维特征降维到2维,并对三类目标值对应的x1、x2进行可视化。
# 获取数据集
iris = load_iris()
x = iris.data
y = iris.target
# 进行PCA降维,建模
pca = PCA(n_components=2) # 实例化
pca.fit(x) # 拟合模型
x_dr = pca.transform(x)
# 将三种鸢尾花的数据分布显示在二维平面坐标系中,对应的两个坐标(两个特征向量)应该是三种鸢尾花降维后的x1和x2
colors = ['red', 'black', 'orange']
plt.figure()
for i in [0,1,2]:
    plt.scatter(x_dr[y==i, 0]
               ,x_dr[y==i, 1]
               ,alpha = 0.7
               ,c=colors[i]
               ,label=iris.target_names[i])
plt.legend()
plt.title('PCA of Iris dataset')
plt.show()
结果:
- PCA降维后的特征矩阵:
- 绘图结果:
文章出处登录后可见!
已经登录?立即刷新