说明:本文代码资料等来源于Pyecharts官网,进行了一些重要节点的备注说明梳理,便于学习。
今日学习柱形图!
目录
百分比柱形图
from pyecharts import options as opts
from pyecharts.charts import Bar
from pyecharts.commons.utils import JsCode
from pyecharts.globals import ThemeType

list2 = [
    {"value": 12, "percent": 12 / (12 + 3)},
    {"value": 23, "percent": 23 / (23 + 21)},
    {"value": 33, "percent": 33 / (33 + 5)},
    {"value": 3, "percent": 3 / (3 + 52)},
    {"value": 33, "percent": 33 / (33 + 43)},
]

list3 = [
    {"value": 3, "percent": 3 / (12 + 3)},
    {"value": 21, "percent": 21 / (23 + 21)},
    {"value": 5, "percent": 5 / (33 + 5)},
    {"value": 52, "percent": 52 / (3 + 52)},
    {"value": 43, "percent": 43 / (33 + 43)},
]

c = (
    Bar(init_opts=opts.InitOpts(theme=ThemeType.LIGHT))   #主题
    .add_xaxis([1, 2, 3, 4, 5])
    .add_yaxis("product1", list2, stack="stack1", category_gap="50%")
    # stack数据堆叠,同个类目轴上系列配置相同的stack值可以堆叠放置
    # category_gap同一系列的柱间距离,默认为类目间距的 20%,可设固定值
    .add_yaxis("product2", list3, stack="stack1", category_gap="50%")
    .set_series_opts(
        label_opts=opts.LabelOpts(   #标签配置项
            position="right",  #标签位置靠右
            formatter=JsCode(   #回调函数
                "function(x){return Number(x.data.percent * 100).toFixed() + '%';}"
            ),
        )
    )

#     .render("stack_bar_percent.html")
)
c.render_notebook()    #Jupyter Notebook直接显示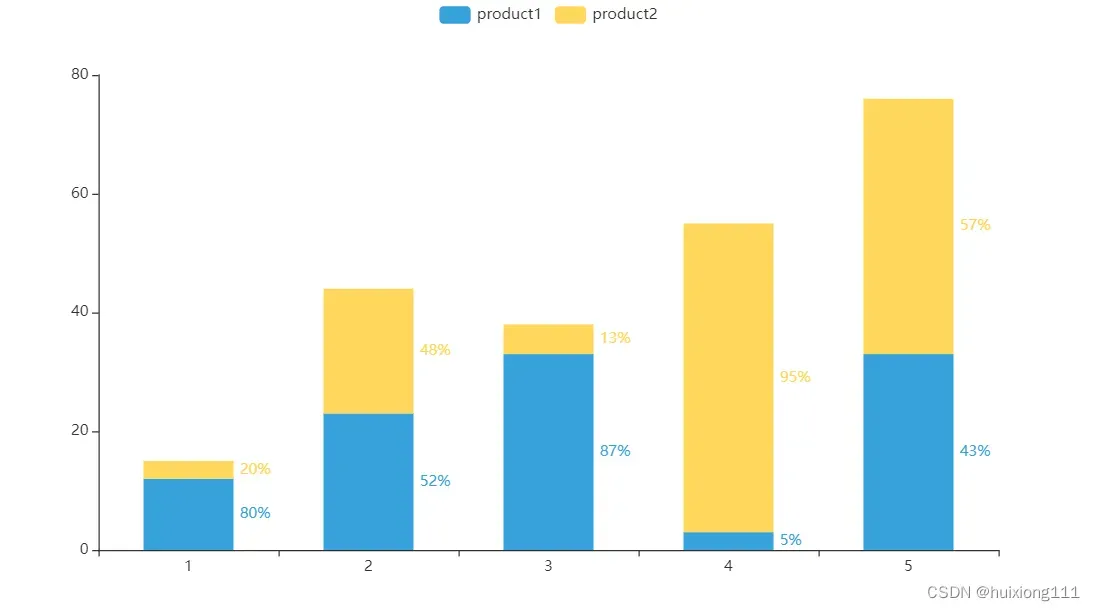
x轴标签旋转
from pyecharts import options as opts
from pyecharts.charts import Bar

c = (
    Bar()
    .add_xaxis(
        [
            "名字很长的X轴标签1",
            "名字很长的X轴标签2",
            "名字很长的X轴标签3",
            "名字很长的X轴标签4",
            "名字很长的X轴标签5",
            "名字很长的X轴标签6",
        ]
    )
    .add_yaxis("商家A", [10, 20, 30, 40, 50, 40])
    .add_yaxis("商家B", [20, 10, 40, 30, 40, 50])
    .set_global_opts(  #全局配置项
        xaxis_opts=opts.AxisOpts(axislabel_opts=opts.LabelOpts(rotate=-15)),  #坐标轴配置项  ,rotate标签旋转。从 -90 度到 90 度。正值是逆时针
        title_opts=opts.TitleOpts(title="Bar-旋转X轴标签", subtitle="解决标签名字过长的问题"),  #标题配置项
    )
#     .render("bar_rotate_xaxis_label.html")
)
c.render_notebook() #Jupyter Notebook直接显示 
堆叠数据
from pyecharts import options as opts
from pyecharts.charts import Bar
from pyecharts.faker import Faker  #导入伪数据库

c = (
    Bar()
    .add_xaxis(Faker.choose())   #随机横坐标
    .add_yaxis("商家A", Faker.values(), stack="stack1", category_gap="50%") # stack数据堆叠,同个类目轴上系列配置相同的stack值可以堆叠放置
    .add_yaxis("商家B", Faker.values(), stack="stack1", category_gap="50%") # category_gap同一系列的柱间距离,默认为类目间距的 20%,可设固定值
    .set_series_opts(label_opts=opts.LabelOpts(is_show=True,position='right'))  #is_show是否显示标签
    .set_global_opts(title_opts=opts.TitleOpts(title="Bar-堆叠数据(全部)"))
#     .render("bar_stack0.html")
)
c.render_notebook()    #Jupyter Notebook直接显示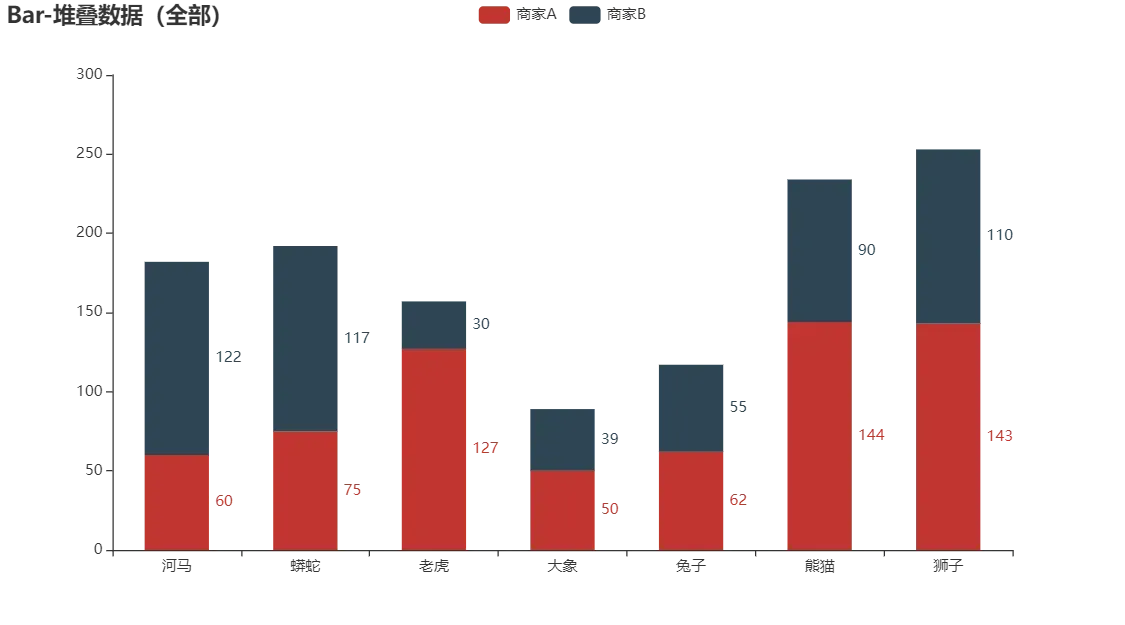
动态宏观经济指标图
import pyecharts.options as opts
from pyecharts.charts import Timeline, Bar, Pie
"""
Gallery 使用 pyecharts 1.1.0
参考地址: https://www.echartsjs.com/examples/editor.html?c=mix-timeline-finance
目前无法实现的功能:
1、暂无
"""
total_data = {}
name_list = [
"北京",
"天津",
"河北",
"山西",
"内蒙古",
"辽宁",
"吉林",
"黑龙江",
"上海",
"江苏",
"浙江",
"安徽",
"福建",
"江西",
"山东",
"河南",
"湖北",
"湖南",
"广东",
"广西",
"海南",
"重庆",
"四川",
"贵州",
"云南",
"西藏",
"陕西",
"甘肃",
"青海",
"宁夏",
"新疆",
]
data_gdp = {
2011: [
16251.93,
11307.28,
24515.76,
11237.55,
14359.88,
22226.7,
10568.83,
12582,
19195.69,
49110.27,
32318.85,
15300.65,
17560.18,
11702.82,
45361.85,
26931.03,
19632.26,
19669.56,
53210.28,
11720.87,
2522.66,
10011.37,
21026.68,
5701.84,
8893.12,
605.83,
12512.3,
5020.37,
1670.44,
2102.21,
6610.05,
],
2010: [
14113.58,
9224.46,
20394.26,
9200.86,
11672,
18457.27,
8667.58,
10368.6,
17165.98,
41425.48,
27722.31,
12359.33,
14737.12,
9451.26,
39169.92,
23092.36,
15967.61,
16037.96,
46013.06,
9569.85,
2064.5,
7925.58,
17185.48,
4602.16,
7224.18,
507.46,
10123.48,
4120.75,
1350.43,
1689.65,
5437.47,
],
2009: [
12153.03,
7521.85,
17235.48,
7358.31,
9740.25,
15212.49,
7278.75,
8587,
15046.45,
34457.3,
22990.35,
10062.82,
12236.53,
7655.18,
33896.65,
19480.46,
12961.1,
13059.69,
39482.56,
7759.16,
1654.21,
6530.01,
14151.28,
3912.68,
6169.75,
441.36,
8169.8,
3387.56,
1081.27,
1353.31,
4277.05,
],
2008: [
11115,
6719.01,
16011.97,
7315.4,
8496.2,
13668.58,
6426.1,
8314.37,
14069.87,
30981.98,
21462.69,
8851.66,
10823.01,
6971.05,
30933.28,
18018.53,
11328.92,
11555,
36796.71,
7021,
1503.06,
5793.66,
12601.23,
3561.56,
5692.12,
394.85,
7314.58,
3166.82,
1018.62,
1203.92,
4183.21,
],
2007: [
9846.81,
5252.76,
13607.32,
6024.45,
6423.18,
11164.3,
5284.69,
7104,
12494.01,
26018.48,
18753.73,
7360.92,
9248.53,
5800.25,
25776.91,
15012.46,
9333.4,
9439.6,
31777.01,
5823.41,
1254.17,
4676.13,
10562.39,
2884.11,
4772.52,
341.43,
5757.29,
2703.98,
797.35,
919.11,
3523.16,
],
2006: [
8117.78,
4462.74,
11467.6,
4878.61,
4944.25,
9304.52,
4275.12,
6211.8,
10572.24,
21742.05,
15718.47,
6112.5,
7583.85,
4820.53,
21900.19,
12362.79,
7617.47,
7688.67,
26587.76,
4746.16,
1065.67,
3907.23,
8690.24,
2338.98,
3988.14,
290.76,
4743.61,
2277.35,
648.5,
725.9,
3045.26,
],
2005: [
6969.52,
3905.64,
10012.11,
4230.53,
3905.03,
8047.26,
3620.27,
5513.7,
9247.66,
18598.69,
13417.68,
5350.17,
6554.69,
4056.76,
18366.87,
10587.42,
6590.19,
6596.1,
22557.37,
3984.1,
918.75,
3467.72,
7385.1,
2005.42,
3462.73,
248.8,
3933.72,
1933.98,
543.32,
612.61,
2604.19,
],
2004: [
6033.21,
3110.97,
8477.63,
3571.37,
3041.07,
6672,
3122.01,
4750.6,
8072.83,
15003.6,
11648.7,
4759.3,
5763.35,
3456.7,
15021.84,
8553.79,
5633.24,
5641.94,
18864.62,
3433.5,
819.66,
3034.58,
6379.63,
1677.8,
3081.91,
220.34,
3175.58,
1688.49,
466.1,
537.11,
2209.09,
],
2003: [
5007.21,
2578.03,
6921.29,
2855.23,
2388.38,
6002.54,
2662.08,
4057.4,
6694.23,
12442.87,
9705.02,
3923.11,
4983.67,
2807.41,
12078.15,
6867.7,
4757.45,
4659.99,
15844.64,
2821.11,
713.96,
2555.72,
5333.09,
1426.34,
2556.02,
185.09,
2587.72,
1399.83,
390.2,
445.36,
1886.35,
],
2002: [
4315,
2150.76,
6018.28,
2324.8,
1940.94,
5458.22,
2348.54,
3637.2,
5741.03,
10606.85,
8003.67,
3519.72,
4467.55,
2450.48,
10275.5,
6035.48,
4212.82,
4151.54,
13502.42,
2523.73,
642.73,
2232.86,
4725.01,
1243.43,
2312.82,
162.04,
2253.39,
1232.03,
340.65,
377.16,
1612.6,
],
}
data_pi = {
2011: [
136.27,
159.72,
2905.73,
641.42,
1306.3,
1915.57,
1277.44,
1701.5,
124.94,
3064.78,
1583.04,
2015.31,
1612.24,
1391.07,
3973.85,
3512.24,
2569.3,
2768.03,
2665.2,
2047.23,
659.23,
844.52,
2983.51,
726.22,
1411.01,
74.47,
1220.9,
678.75,
155.08,
184.14,
1139.03,
],
2010: [
124.36,
145.58,
2562.81,
554.48,
1095.28,
1631.08,
1050.15,
1302.9,
114.15,
2540.1,
1360.56,
1729.02,
1363.67,
1206.98,
3588.28,
3258.09,
2147,
2325.5,
2286.98,
1675.06,
539.83,
685.38,
2482.89,
625.03,
1108.38,
68.72,
988.45,
599.28,
134.92,
159.29,
1078.63,
],
2009: [
118.29,
128.85,
2207.34,
477.59,
929.6,
1414.9,
980.57,
1154.33,
113.82,
2261.86,
1163.08,
1495.45,
1182.74,
1098.66,
3226.64,
2769.05,
1795.9,
1969.69,
2010.27,
1458.49,
462.19,
606.8,
2240.61,
550.27,
1067.6,
63.88,
789.64,
497.05,
107.4,
127.25,
759.74,
],
2008: [
112.83,
122.58,
2034.59,
313.58,
907.95,
1302.02,
916.72,
1088.94,
111.8,
2100.11,
1095.96,
1418.09,
1158.17,
1060.38,
3002.65,
2658.78,
1780,
1892.4,
1973.05,
1453.75,
436.04,
575.4,
2216.15,
539.19,
1020.56,
60.62,
753.72,
462.27,
105.57,
118.94,
691.07,
],
2007: [
101.26,
110.19,
1804.72,
311.97,
762.1,
1133.42,
783.8,
915.38,
101.84,
1816.31,
986.02,
1200.18,
1002.11,
905.77,
2509.14,
2217.66,
1378,
1626.48,
1695.57,
1241.35,
361.07,
482.39,
2032,
446.38,
837.35,
54.89,
592.63,
387.55,
83.41,
97.89,
628.72,
],
2006: [
88.8,
103.35,
1461.81,
276.77,
634.94,
939.43,
672.76,
750.14,
93.81,
1545.05,
925.1,
1011.03,
865.98,
786.14,
2138.9,
1916.74,
1140.41,
1272.2,
1532.17,
1032.47,
323.48,
386.38,
1595.48,
382.06,
724.4,
50.9,
484.81,
334,
67.55,
79.54,
527.8,
],
2005: [
88.68,
112.38,
1400,
262.42,
589.56,
882.41,
625.61,
684.6,
90.26,
1461.51,
892.83,
966.5,
827.36,
727.37,
1963.51,
1892.01,
1082.13,
1100.65,
1428.27,
912.5,
300.75,
463.4,
1481.14,
368.94,
661.69,
48.04,
435.77,
308.06,
65.34,
72.07,
509.99,
],
2004: [
87.36,
105.28,
1370.43,
276.3,
522.8,
798.43,
568.69,
605.79,
83.45,
1367.58,
814.1,
950.5,
786.84,
664.5,
1778.45,
1649.29,
1020.09,
1022.45,
1248.59,
817.88,
278.76,
428.05,
1379.93,
334.5,
607.75,
44.3,
387.88,
286.78,
60.7,
65.33,
461.26,
],
2003: [
84.11,
89.91,
1064.05,
215.19,
420.1,
615.8,
488.23,
504.8,
81.02,
1162.45,
717.85,
749.4,
692.94,
560,
1480.67,
1198.7,
798.35,
886.47,
1072.91,
658.78,
244.29,
339.06,
1128.61,
298.69,
494.6,
40.7,
302.66,
237.91,
48.47,
55.63,
412.9,
],
2002: [
82.44,
84.21,
956.84,
197.8,
374.69,
590.2,
446.17,
474.2,
79.68,
1110.44,
685.2,
783.66,
664.78,
535.98,
1390,
1288.36,
707,
847.25,
1015.08,
601.99,
222.89,
317.87,
1047.95,
281.1,
463.44,
39.75,
282.21,
215.51,
47.31,
52.95,
305,
],
}
data_si = {
2011: [
3752.48,
5928.32,
13126.86,
6635.26,
8037.69,
12152.15,
5611.48,
5962.41,
7927.89,
25203.28,
16555.58,
8309.38,
9069.2,
6390.55,
24017.11,
15427.08,
9815.94,
9361.99,
26447.38,
5675.32,
714.5,
5543.04,
11029.13,
2194.33,
3780.32,
208.79,
6935.59,
2377.83,
975.18,
1056.15,
3225.9,
],
2010: [
3388.38,
4840.23,
10707.68,
5234,
6367.69,
9976.82,
4506.31,
5025.15,
7218.32,
21753.93,
14297.93,
6436.62,
7522.83,
5122.88,
21238.49,
13226.38,
7767.24,
7343.19,
23014.53,
4511.68,
571,
4359.12,
8672.18,
1800.06,
3223.49,
163.92,
5446.1,
1984.97,
744.63,
827.91,
2592.15,
],
2009: [
2855.55,
3987.84,
8959.83,
3993.8,
5114,
7906.34,
3541.92,
4060.72,
6001.78,
18566.37,
11908.49,
4905.22,
6005.3,
3919.45,
18901.83,
11010.5,
6038.08,
5687.19,
19419.7,
3381.54,
443.43,
3448.77,
6711.87,
1476.62,
2582.53,
136.63,
4236.42,
1527.24,
575.33,
662.32,
1929.59,
],
2008: [
2626.41,
3709.78,
8701.34,
4242.36,
4376.19,
7158.84,
3097.12,
4319.75,
6085.84,
16993.34,
11567.42,
4198.93,
5318.44,
3554.81,
17571.98,
10259.99,
5082.07,
5028.93,
18502.2,
3037.74,
423.55,
3057.78,
5823.39,
1370.03,
2452.75,
115.56,
3861.12,
1470.34,
557.12,
609.98,
2070.76,
],
2007: [
2509.4,
2892.53,
7201.88,
3454.49,
3193.67,
5544.14,
2475.45,
3695.58,
5571.06,
14471.26,
10154.25,
3370.96,
4476.42,
2975.53,
14647.53,
8282.83,
4143.06,
3977.72,
16004.61,
2425.29,
364.26,
2368.53,
4648.79,
1124.79,
2038.39,
98.48,
2986.46,
1279.32,
419.03,
455.04,
1647.55,
],
2006: [
2191.43,
2457.08,
6110.43,
2755.66,
2374.96,
4566.83,
1915.29,
3365.31,
4969.95,
12282.89,
8511.51,
2711.18,
3695.04,
2419.74,
12574.03,
6724.61,
3365.08,
3187.05,
13469.77,
1878.56,
308.62,
1871.65,
3775.14,
967.54,
1705.83,
80.1,
2452.44,
1043.19,
331.91,
351.58,
1459.3,
],
2005: [
2026.51,
2135.07,
5271.57,
2357.04,
1773.21,
3869.4,
1580.83,
2971.68,
4381.2,
10524.96,
7164.75,
2245.9,
3175.92,
1917.47,
10478.62,
5514.14,
2852.12,
2612.57,
11356.6,
1510.68,
240.83,
1564,
3067.23,
821.16,
1426.42,
63.52,
1951.36,
838.56,
264.61,
281.05,
1164.79,
],
2004: [
1853.58,
1685.93,
4301.73,
1919.4,
1248.27,
3061.62,
1329.68,
2487.04,
3892.12,
8437.99,
6250.38,
1844.9,
2770.49,
1566.4,
8478.69,
4182.1,
2320.6,
2190.54,
9280.73,
1253.7,
205.6,
1376.91,
2489.4,
681.5,
1281.63,
52.74,
1553.1,
713.3,
211.7,
244.05,
914.47,
],
2003: [
1487.15,
1337.31,
3417.56,
1463.38,
967.49,
2898.89,
1098.37,
2084.7,
3209.02,
6787.11,
5096.38,
1535.29,
2340.82,
1204.33,
6485.05,
3310.14,
1956.02,
1777.74,
7592.78,
984.08,
175.82,
1135.31,
2014.8,
569.37,
1047.66,
47.64,
1221.17,
572.02,
171.92,
194.27,
719.54,
],
2002: [
1249.99,
1069.08,
2911.69,
1134.31,
754.78,
2609.85,
943.49,
1843.6,
2622.45,
5604.49,
4090.48,
1337.04,
2036.97,
941.77,
5184.98,
2768.75,
1709.89,
1523.5,
6143.4,
846.89,
148.88,
958.87,
1733.38,
481.96,
934.88,
32.72,
1007.56,
501.69,
144.51,
153.06,
603.15,
],
}
data_ti = {
2011: [
12363.18,
5219.24,
8483.17,
3960.87,
5015.89,
8158.98,
3679.91,
4918.09,
11142.86,
20842.21,
14180.23,
4975.96,
6878.74,
3921.2,
17370.89,
7991.72,
7247.02,
7539.54,
24097.7,
3998.33,
1148.93,
3623.81,
7014.04,
2781.29,
3701.79,
322.57,
4355.81,
1963.79,
540.18,
861.92,
2245.12,
],
2010: [
10600.84,
4238.65,
7123.77,
3412.38,
4209.03,
6849.37,
3111.12,
4040.55,
9833.51,
17131.45,
12063.82,
4193.69,
5850.62,
3121.4,
14343.14,
6607.89,
6053.37,
6369.27,
20711.55,
3383.11,
953.67,
2881.08,
6030.41,
2177.07,
2892.31,
274.82,
3688.93,
1536.5,
470.88,
702.45,
1766.69,
],
2009: [
9179.19,
3405.16,
6068.31,
2886.92,
3696.65,
5891.25,
2756.26,
3371.95,
8930.85,
13629.07,
9918.78,
3662.15,
5048.49,
2637.07,
11768.18,
5700.91,
5127.12,
5402.81,
18052.59,
2919.13,
748.59,
2474.44,
5198.8,
1885.79,
2519.62,
240.85,
3143.74,
1363.27,
398.54,
563.74,
1587.72,
],
2008: [
8375.76,
2886.65,
5276.04,
2759.46,
3212.06,
5207.72,
2412.26,
2905.68,
7872.23,
11888.53,
8799.31,
3234.64,
4346.4,
2355.86,
10358.64,
5099.76,
4466.85,
4633.67,
16321.46,
2529.51,
643.47,
2160.48,
4561.69,
1652.34,
2218.81,
218.67,
2699.74,
1234.21,
355.93,
475,
1421.38,
],
2007: [
7236.15,
2250.04,
4600.72,
2257.99,
2467.41,
4486.74,
2025.44,
2493.04,
6821.11,
9730.91,
7613.46,
2789.78,
3770,
1918.95,
8620.24,
4511.97,
3812.34,
3835.4,
14076.83,
2156.76,
528.84,
1825.21,
3881.6,
1312.94,
1896.78,
188.06,
2178.2,
1037.11,
294.91,
366.18,
1246.89,
],
2006: [
5837.55,
1902.31,
3895.36,
1846.18,
1934.35,
3798.26,
1687.07,
2096.35,
5508.48,
7914.11,
6281.86,
2390.29,
3022.83,
1614.65,
7187.26,
3721.44,
3111.98,
3229.42,
11585.82,
1835.12,
433.57,
1649.2,
3319.62,
989.38,
1557.91,
159.76,
1806.36,
900.16,
249.04,
294.78,
1058.16,
],
2005: [
4854.33,
1658.19,
3340.54,
1611.07,
1542.26,
3295.45,
1413.83,
1857.42,
4776.2,
6612.22,
5360.1,
2137.77,
2551.41,
1411.92,
5924.74,
3181.27,
2655.94,
2882.88,
9772.5,
1560.92,
377.17,
1440.32,
2836.73,
815.32,
1374.62,
137.24,
1546.59,
787.36,
213.37,
259.49,
929.41,
],
2004: [
4092.27,
1319.76,
2805.47,
1375.67,
1270,
2811.95,
1223.64,
1657.77,
4097.26,
5198.03,
4584.22,
1963.9,
2206.02,
1225.8,
4764.7,
2722.4,
2292.55,
2428.95,
8335.3,
1361.92,
335.3,
1229.62,
2510.3,
661.8,
1192.53,
123.3,
1234.6,
688.41,
193.7,
227.73,
833.36,
],
2003: [
3435.95,
1150.81,
2439.68,
1176.65,
1000.79,
2487.85,
1075.48,
1467.9,
3404.19,
4493.31,
3890.79,
1638.42,
1949.91,
1043.08,
4112.43,
2358.86,
2003.08,
1995.78,
7178.94,
1178.25,
293.85,
1081.35,
2189.68,
558.28,
1013.76,
96.76,
1063.89,
589.91,
169.81,
195.46,
753.91,
],
2002: [
2982.57,
997.47,
2149.75,
992.69,
811.47,
2258.17,
958.88,
1319.4,
3038.9,
3891.92,
3227.99,
1399.02,
1765.8,
972.73,
3700.52,
1978.37,
1795.93,
1780.79,
6343.94,
1074.85,
270.96,
956.12,
1943.68,
480.37,
914.5,
89.56,
963.62,
514.83,
148.83,
171.14,
704.5,
],
}
data_estate = {
2011: [
12363.18,
5219.24,
8483.17,
3960.87,
5015.89,
8158.98,
3679.91,
4918.09,
11142.86,
20842.21,
14180.23,
4975.96,
6878.74,
3921.2,
17370.89,
7991.72,
7247.02,
7539.54,
24097.7,
3998.33,
1148.93,
3623.81,
7014.04,
2781.29,
3701.79,
322.57,
4355.81,
1963.79,
540.18,
861.92,
2245.12,
],
2010: [
10600.84,
4238.65,
7123.77,
3412.38,
4209.03,
6849.37,
3111.12,
4040.55,
9833.51,
17131.45,
12063.82,
4193.69,
5850.62,
3121.4,
14343.14,
6607.89,
6053.37,
6369.27,
20711.55,
3383.11,
953.67,
2881.08,
6030.41,
2177.07,
2892.31,
274.82,
3688.93,
1536.5,
470.88,
702.45,
1766.69,
],
2009: [
9179.19,
3405.16,
6068.31,
2886.92,
3696.65,
5891.25,
2756.26,
3371.95,
8930.85,
13629.07,
9918.78,
3662.15,
5048.49,
2637.07,
11768.18,
5700.91,
5127.12,
5402.81,
18052.59,
2919.13,
748.59,
2474.44,
5198.8,
1885.79,
2519.62,
240.85,
3143.74,
1363.27,
398.54,
563.74,
1587.72,
],
2008: [
8375.76,
2886.65,
5276.04,
2759.46,
3212.06,
5207.72,
2412.26,
2905.68,
7872.23,
11888.53,
8799.31,
3234.64,
4346.4,
2355.86,
10358.64,
5099.76,
4466.85,
4633.67,
16321.46,
2529.51,
643.47,
2160.48,
4561.69,
1652.34,
2218.81,
218.67,
2699.74,
1234.21,
355.93,
475,
1421.38,
],
2007: [
7236.15,
2250.04,
4600.72,
2257.99,
2467.41,
4486.74,
2025.44,
2493.04,
6821.11,
9730.91,
7613.46,
2789.78,
3770,
1918.95,
8620.24,
4511.97,
3812.34,
3835.4,
14076.83,
2156.76,
528.84,
1825.21,
3881.6,
1312.94,
1896.78,
188.06,
2178.2,
1037.11,
294.91,
366.18,
1246.89,
],
2006: [
5837.55,
1902.31,
3895.36,
1846.18,
1934.35,
3798.26,
1687.07,
2096.35,
5508.48,
7914.11,
6281.86,
2390.29,
3022.83,
1614.65,
7187.26,
3721.44,
3111.98,
3229.42,
11585.82,
1835.12,
433.57,
1649.2,
3319.62,
989.38,
1557.91,
159.76,
1806.36,
900.16,
249.04,
294.78,
1058.16,
],
2005: [
4854.33,
1658.19,
3340.54,
1611.07,
1542.26,
3295.45,
1413.83,
1857.42,
4776.2,
6612.22,
5360.1,
2137.77,
2551.41,
1411.92,
5924.74,
3181.27,
2655.94,
2882.88,
9772.5,
1560.92,
377.17,
1440.32,
2836.73,
815.32,
1374.62,
137.24,
1546.59,
787.36,
213.37,
259.49,
929.41,
],
2004: [
4092.27,
1319.76,
2805.47,
1375.67,
1270,
2811.95,
1223.64,
1657.77,
4097.26,
5198.03,
4584.22,
1963.9,
2206.02,
1225.8,
4764.7,
2722.4,
2292.55,
2428.95,
8335.3,
1361.92,
335.3,
1229.62,
2510.3,
661.8,
1192.53,
123.3,
1234.6,
688.41,
193.7,
227.73,
833.36,
],
2003: [
3435.95,
1150.81,
2439.68,
1176.65,
1000.79,
2487.85,
1075.48,
1467.9,
3404.19,
4493.31,
3890.79,
1638.42,
1949.91,
1043.08,
4112.43,
2358.86,
2003.08,
1995.78,
7178.94,
1178.25,
293.85,
1081.35,
2189.68,
558.28,
1013.76,
96.76,
1063.89,
589.91,
169.81,
195.46,
753.91,
],
2002: [
2982.57,
997.47,
2149.75,
992.69,
811.47,
2258.17,
958.88,
1319.4,
3038.9,
3891.92,
3227.99,
1399.02,
1765.8,
972.73,
3700.52,
1978.37,
1795.93,
1780.79,
6343.94,
1074.85,
270.96,
956.12,
1943.68,
480.37,
914.5,
89.56,
963.62,
514.83,
148.83,
171.14,
704.5,
],
}
data_financial = {
2011: [
12363.18,
5219.24,
8483.17,
3960.87,
5015.89,
8158.98,
3679.91,
4918.09,
11142.86,
20842.21,
14180.23,
4975.96,
6878.74,
3921.2,
17370.89,
7991.72,
7247.02,
7539.54,
24097.7,
3998.33,
1148.93,
3623.81,
7014.04,
2781.29,
3701.79,
322.57,
4355.81,
1963.79,
540.18,
861.92,
2245.12,
],
2010: [
10600.84,
4238.65,
7123.77,
3412.38,
4209.03,
6849.37,
3111.12,
4040.55,
9833.51,
17131.45,
12063.82,
4193.69,
5850.62,
3121.4,
14343.14,
6607.89,
6053.37,
6369.27,
20711.55,
3383.11,
953.67,
2881.08,
6030.41,
2177.07,
2892.31,
274.82,
3688.93,
1536.5,
470.88,
702.45,
1766.69,
],
2009: [
9179.19,
3405.16,
6068.31,
2886.92,
3696.65,
5891.25,
2756.26,
3371.95,
8930.85,
13629.07,
9918.78,
3662.15,
5048.49,
2637.07,
11768.18,
5700.91,
5127.12,
5402.81,
18052.59,
2919.13,
748.59,
2474.44,
5198.8,
1885.79,
2519.62,
240.85,
3143.74,
1363.27,
398.54,
563.74,
1587.72,
],
2008: [
8375.76,
2886.65,
5276.04,
2759.46,
3212.06,
5207.72,
2412.26,
2905.68,
7872.23,
11888.53,
8799.31,
3234.64,
4346.4,
2355.86,
10358.64,
5099.76,
4466.85,
4633.67,
16321.46,
2529.51,
643.47,
2160.48,
4561.69,
1652.34,
2218.81,
218.67,
2699.74,
1234.21,
355.93,
475,
1421.38,
],
2007: [
7236.15,
2250.04,
4600.72,
2257.99,
2467.41,
4486.74,
2025.44,
2493.04,
6821.11,
9730.91,
7613.46,
2789.78,
3770,
1918.95,
8620.24,
4511.97,
3812.34,
3835.4,
14076.83,
2156.76,
528.84,
1825.21,
3881.6,
1312.94,
1896.78,
188.06,
2178.2,
1037.11,
294.91,
366.18,
1246.89,
],
2006: [
5837.55,
1902.31,
3895.36,
1846.18,
1934.35,
3798.26,
1687.07,
2096.35,
5508.48,
7914.11,
6281.86,
2390.29,
3022.83,
1614.65,
7187.26,
3721.44,
3111.98,
3229.42,
11585.82,
1835.12,
433.57,
1649.2,
3319.62,
989.38,
1557.91,
159.76,
1806.36,
900.16,
249.04,
294.78,
1058.16,
],
2005: [
4854.33,
1658.19,
3340.54,
1611.07,
1542.26,
3295.45,
1413.83,
1857.42,
4776.2,
6612.22,
5360.1,
2137.77,
2551.41,
1411.92,
5924.74,
3181.27,
2655.94,
2882.88,
9772.5,
1560.92,
377.17,
1440.32,
2836.73,
815.32,
1374.62,
137.24,
1546.59,
787.36,
213.37,
259.49,
929.41,
],
2004: [
4092.27,
1319.76,
2805.47,
1375.67,
1270,
2811.95,
1223.64,
1657.77,
4097.26,
5198.03,
4584.22,
1963.9,
2206.02,
1225.8,
4764.7,
2722.4,
2292.55,
2428.95,
8335.3,
1361.92,
335.3,
1229.62,
2510.3,
661.8,
1192.53,
123.3,
1234.6,
688.41,
193.7,
227.73,
833.36,
],
2003: [
3435.95,
1150.81,
2439.68,
1176.65,
1000.79,
2487.85,
1075.48,
1467.9,
3404.19,
4493.31,
3890.79,
1638.42,
1949.91,
1043.08,
4112.43,
2358.86,
2003.08,
1995.78,
7178.94,
1178.25,
293.85,
1081.35,
2189.68,
558.28,
1013.76,
96.76,
1063.89,
589.91,
169.81,
195.46,
753.91,
],
2002: [
2982.57,
997.47,
2149.75,
992.69,
811.47,
2258.17,
958.88,
1319.4,
3038.9,
3891.92,
3227.99,
1399.02,
1765.8,
972.73,
3700.52,
1978.37,
1795.93,
1780.79,
6343.94,
1074.85,
270.96,
956.12,
1943.68,
480.37,
914.5,
89.56,
963.62,
514.83,
148.83,
171.14,
704.5,
],
}
def format_data(data: dict) -> dict:
for year in range(2002, 2012):
max_data, sum_data = 0, 0
temp = data[year]
max_data = max(temp)
for i in range(len(temp)):
sum_data += temp[i]
data[year][i] = {"name": name_list[i], "value": temp[i]}
data[str(year) + "max"] = int(max_data / 100) * 100
data[str(year) + "sum"] = sum_data
return data
# GDP
total_data["dataGDP"] = format_data(data=data_gdp)
# 第一产业
total_data["dataPI"] = format_data(data=data_pi)
# 第二产业
total_data["dataSI"] = format_data(data=data_si)
# 第三产业
total_data["dataTI"] = format_data(data=data_ti)
# 房地产
total_data["dataEstate"] = format_data(data=data_estate)
# 金融
total_data["dataFinancial"] = format_data(data=data_financial)
#####################################################################################
# 2002 - 2011 年的数据
def get_year_overlap_chart(year: int) -> Bar:
bar = (
Bar()
.add_xaxis(xaxis_data=name_list)
.add_yaxis(
series_name="GDP",
y_axis=total_data["dataGDP"][year],
is_selected=False, # is_selected是否选中图例
label_opts=opts.LabelOpts(is_show=False),
)
.add_yaxis(
series_name="金融",
y_axis=total_data["dataFinancial"][year],
is_selected=False, # is_selected是否选中图例
label_opts=opts.LabelOpts(is_show=False),
)
.add_yaxis(
series_name="房地产",
y_axis=total_data["dataEstate"][year],
is_selected=False, # is_selected是否选中图例
label_opts=opts.LabelOpts(is_show=False),
)
.add_yaxis(
series_name="第一产业",
y_axis=total_data["dataPI"][year],
label_opts=opts.LabelOpts(is_show=False),
)
.add_yaxis(
series_name="第二产业",
y_axis=total_data["dataSI"][year],
label_opts=opts.LabelOpts(is_show=False),
)
.add_yaxis(
series_name="第三产业",
y_axis=total_data["dataTI"][year],
label_opts=opts.LabelOpts(is_show=False),
)
.set_global_opts(
title_opts=opts.TitleOpts(
title="{}全国宏观经济指标".format(year), subtitle="数据来自国家统计局"
),
tooltip_opts=opts.TooltipOpts(
is_show=True, trigger="axis", axis_pointer_type="shadow"
),
)
)
pie = (
Pie()
.add(
series_name="GDP占比",
data_pair=[
["第一产业", total_data["dataPI"]["{}sum".format(year)]],
["第二产业", total_data["dataSI"]["{}sum".format(year)]],
["第三产业", total_data["dataTI"]["{}sum".format(year)]],
],
center=["75%", "35%"],
radius="28%",
)
.set_series_opts(tooltip_opts=opts.TooltipOpts(is_show=True, trigger="item"))
)
return bar.overlap(pie)
# 生成时间轴的图
timeline = Timeline(init_opts=opts.InitOpts(width="1600px", height="800px"))
for y in range(2002, 2012):
timeline.add(get_year_overlap_chart(year=y), time_point=str(y))
# 1.0.0 版本的 add_schema 暂时没有补上 return self 所以只能这么写着
timeline.add_schema(is_auto_play=True, play_interval=1000)
# timeline.render("finance_indices_2002.html")
timeline.render_notebook() #Jupyter Notebook直接显示 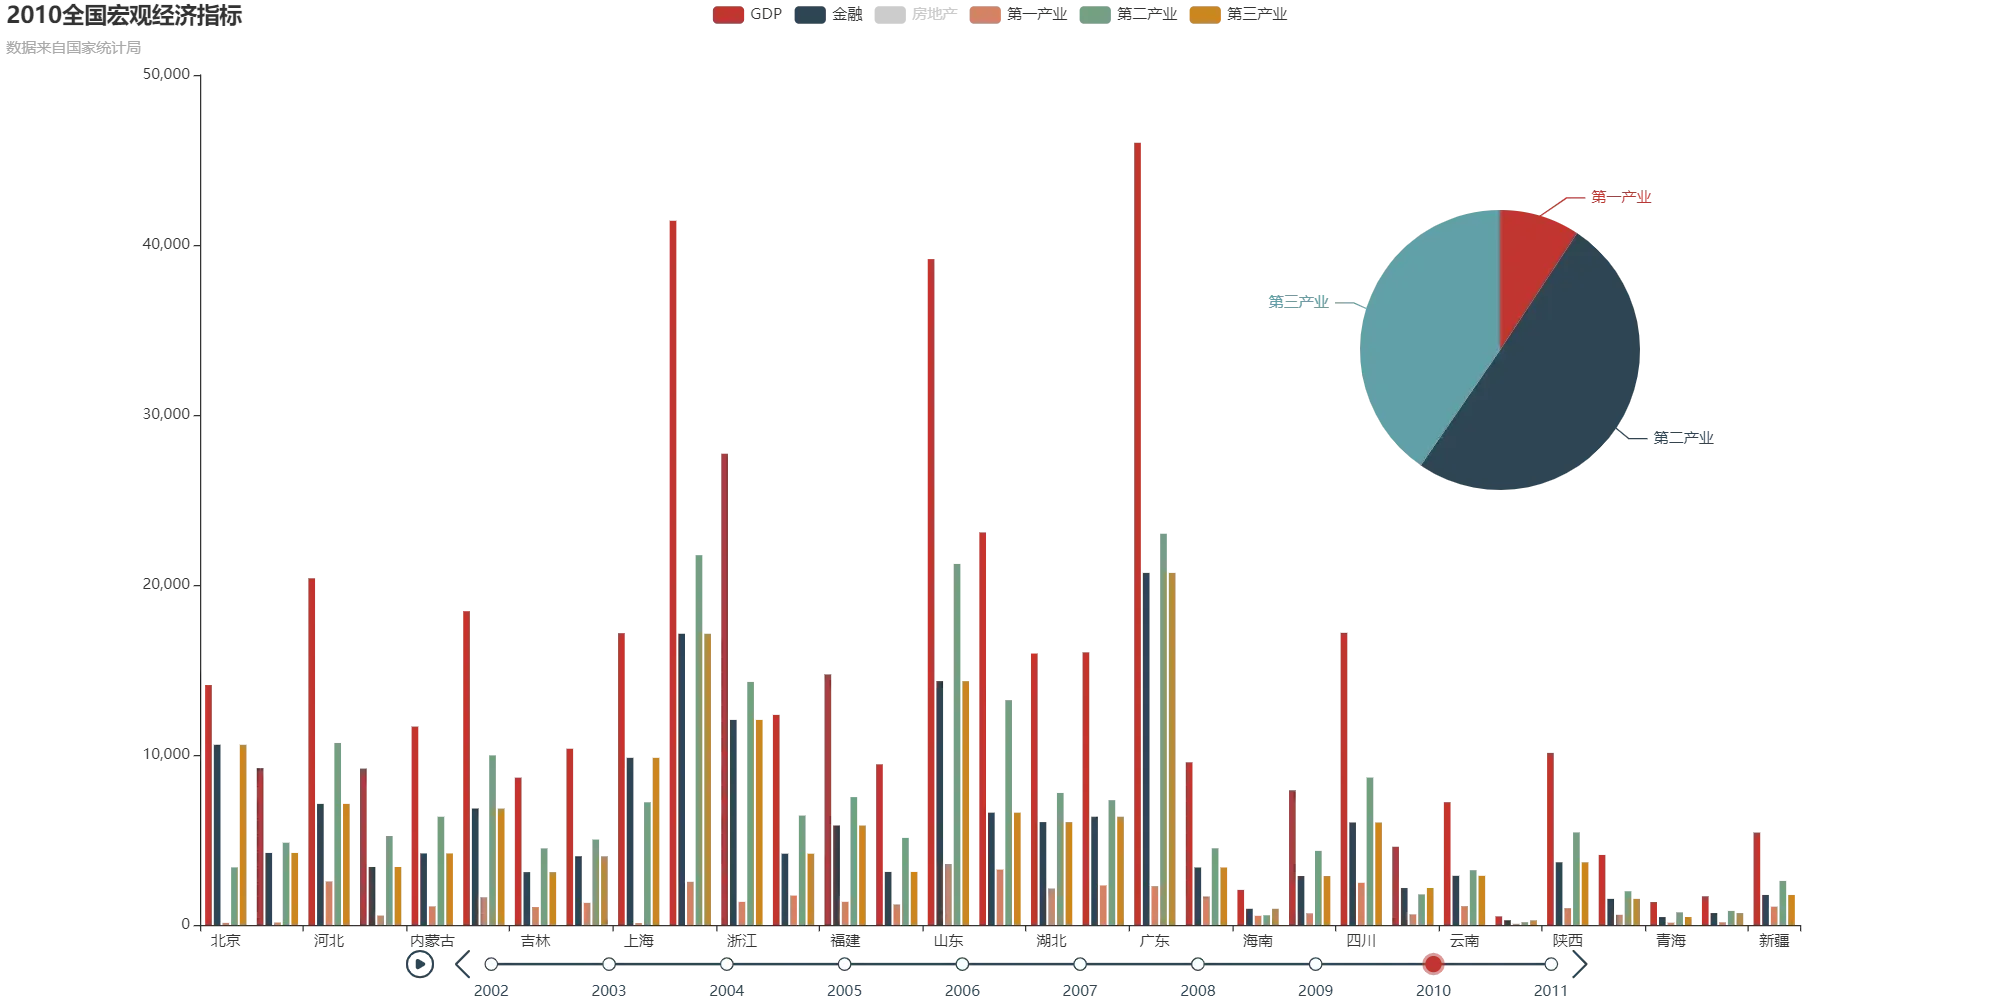
通过 dict 进行配置柱形图
from pyecharts.charts import Bar
from pyecharts.faker import Faker
from pyecharts.globals import ThemeType

c = (
    Bar({"theme": ThemeType.MACARONS})
    .add_xaxis(Faker.choose())
    .add_yaxis("商家A", Faker.values())
    .add_yaxis("商家B", Faker.values())
    .set_global_opts(
        title_opts={"text": "Bar-通过 dict 进行配置", "subtext": "我也是通过 dict 进行配置的"}
    )
#     .render("bar_base_dict_config.html")
)
c.render_notebook()    #Jupyter Notebook直接显示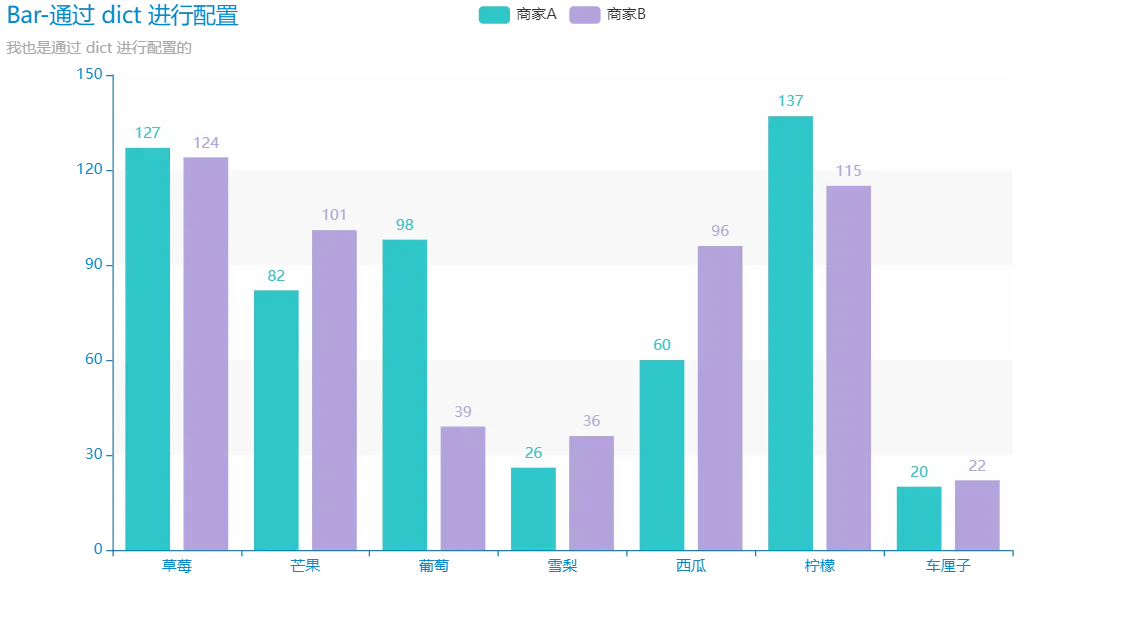
区域选择组件配置项
from pyecharts import options as opts
from pyecharts.charts import Bar
from pyecharts.faker import Faker


c = (
    Bar()
    .add_xaxis(Faker.choose())
    .add_yaxis("商家A", Faker.values())
    .add_yaxis("商家B", Faker.values())
    .set_global_opts(
        title_opts=opts.TitleOpts(title="Bar-Brush示例", subtitle="我是副标题"),
        brush_opts=opts.BrushOpts(),  #区域选择组件配置项
    )
#     .render("bar_with_brush.html")
)
c.render_notebook()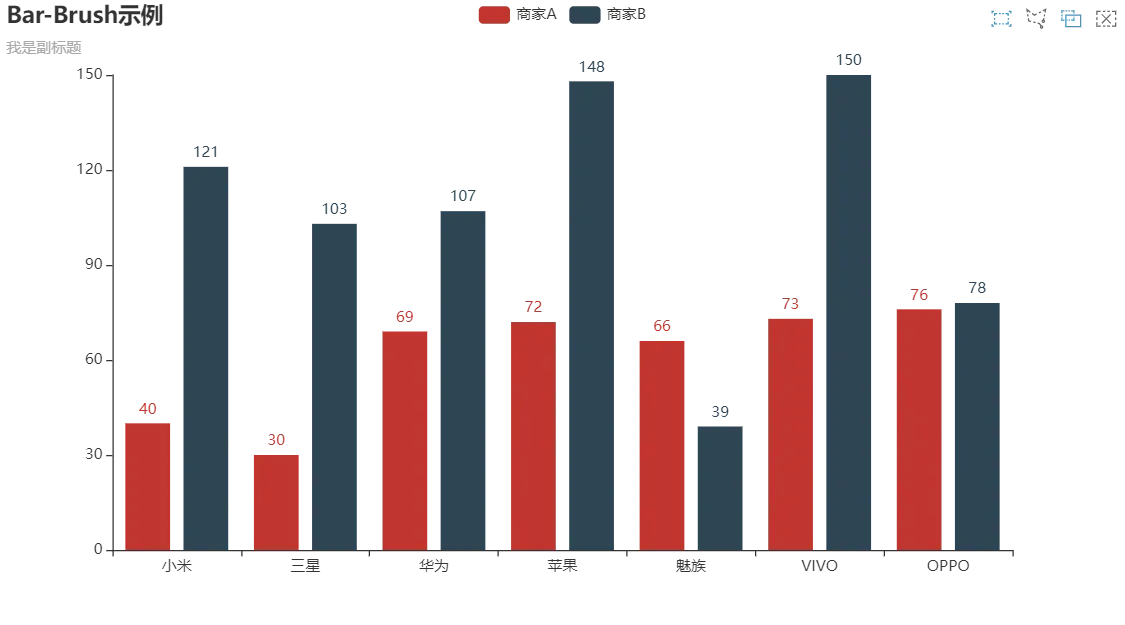
区域缩放配置项
from pyecharts import options as opts
from pyecharts.charts import Bar
from pyecharts.faker import Faker

c = (
    Bar()
    .add_xaxis(Faker.days_attrs)
    .add_yaxis("商家A", Faker.days_values)
    .set_global_opts(
        title_opts=opts.TitleOpts(title="Bar-DataZoom(slider-水平)"),
        datazoom_opts=opts.DataZoomOpts(),  #区域缩放配置项
    )
#     .render("bar_datazoom_slider.html")
)
c.render_notebook()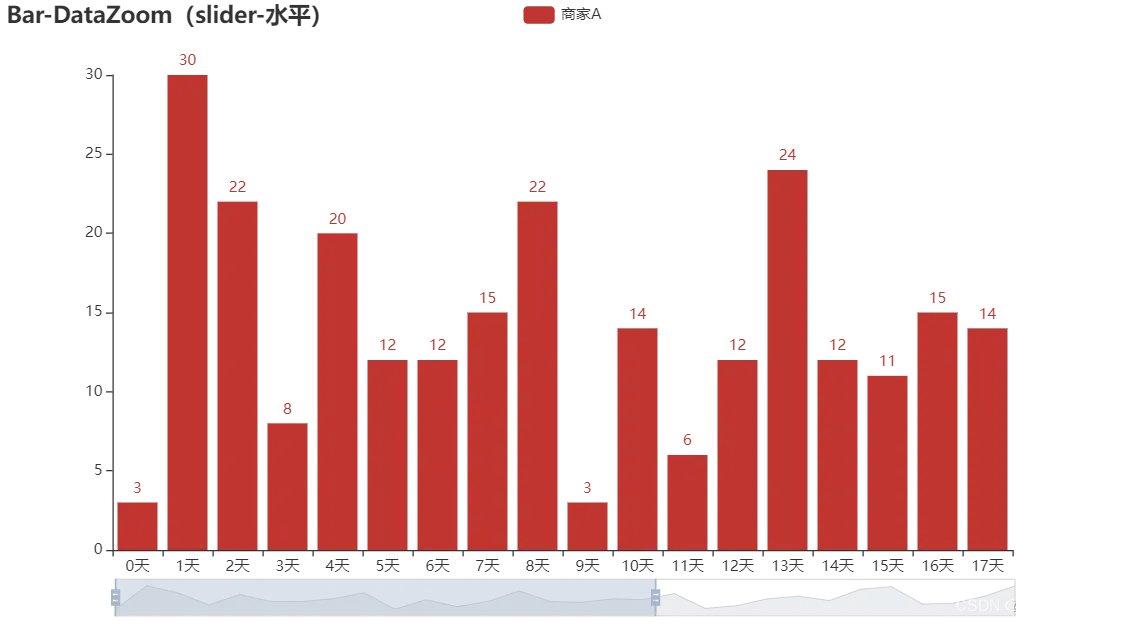
好全的工具箱!
from pyecharts import options as opts
from pyecharts.charts import Bar
from pyecharts.faker import Faker

c = (
    Bar(init_opts=opts.InitOpts(bg_color='white'))  #初始化的背景色,长宽等在这里设置,也可以为16进制的代码,如果不设置为白色,下载下来的图片png就是透明的
    .add_xaxis(Faker.choose())
    .add_yaxis("商家A", Faker.values())
    .add_yaxis("商家B", Faker.values())
    .set_global_opts(
        title_opts=opts.TitleOpts(title="Bar-显示 ToolBox"),
        toolbox_opts=opts.ToolboxOpts(),  #工具箱配置项
        legend_opts=opts.LegendOpts(is_show=False),  #图例配置项
    )
#     .render("bar_toolbox.html")
)
c.render_notebook()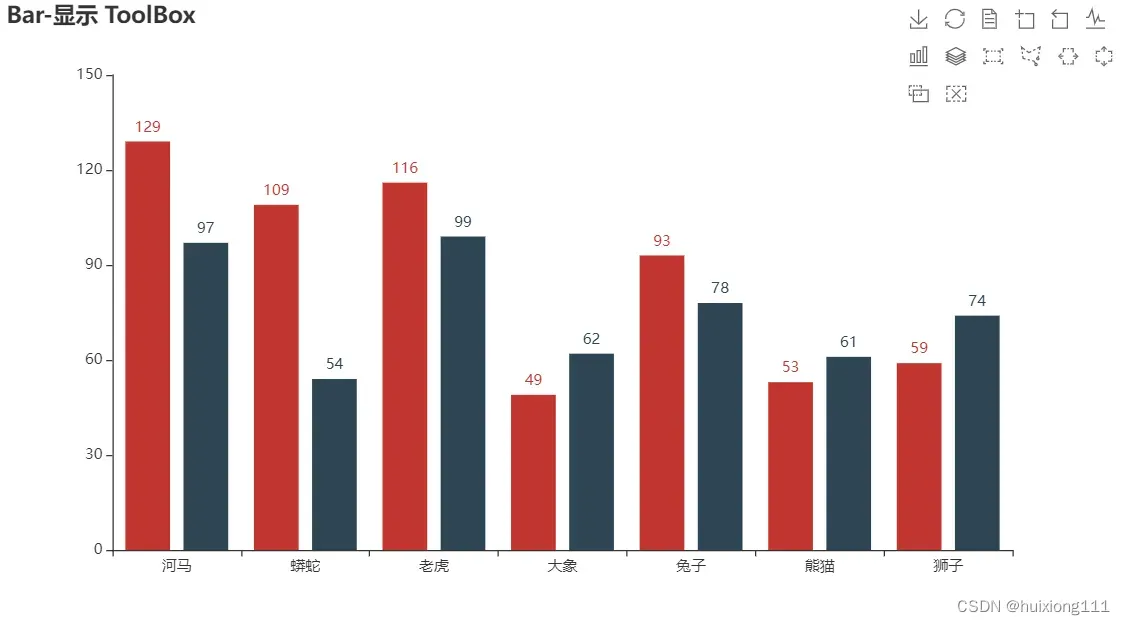
类似于瀑布图
from pyecharts.charts import Bar
from pyecharts import options as opts

x_data = [f"11月{str(i)}日" for i in range(1, 12)]
y_total = [0, 900, 1245, 1530, 1376, 1376, 1511, 1689, 1856, 1495, 1292]
y_in = [900, 345, 393, "-", "-", 135, 178, 286, "-", "-", "-"]
y_out = ["-", "-", "-", 108, 154, "-", "-", "-", 119, 361, 203]


bar = (
    Bar()
    .add_xaxis(xaxis_data=x_data)
    .add_yaxis(
        series_name="",
        y_axis=y_total,
        stack="总量",   # stack数据堆叠,同个类目轴上系列配置相同的stack值可以堆叠放置
        itemstyle_opts=opts.ItemStyleOpts(color="rgba(0,0,0,0)"),
        #图元样式配置项,图形颜色,可以使用 RGBA,比如 'rgba(128, 128, 128, 0.5)',也可以使用十六进制格式,比如 '#ccc'
        # rgba(0,0,0,0)完全不透明的白色,也即是无色
    )
    .add_yaxis(series_name="收入", y_axis=y_in, stack="总量")
    .add_yaxis(series_name="支出", y_axis=y_out, stack="总量")
    .set_global_opts(yaxis_opts=opts.AxisOpts(type_="value"))   #坐标轴配置项
    # type_坐标轴类型。可选:
    # 'value': 数值轴,适用于连续数据。
    # 'category': 类目轴,适用于离散的类目数据,为该类型时必须通过 data 设置类目数据。
    # 'time': 时间轴,适用于连续的时序数据,与数值轴相比时间轴带有时间的格式化,在刻度计算上也有所不同,
    # 例如会根据跨度的范围来决定使用月,星期,日还是小时范围的刻度。
    # 'log' 对数轴。适用于对数数据。
#     .render("bar_waterfall_plot.html")
)
bar.render_notebook()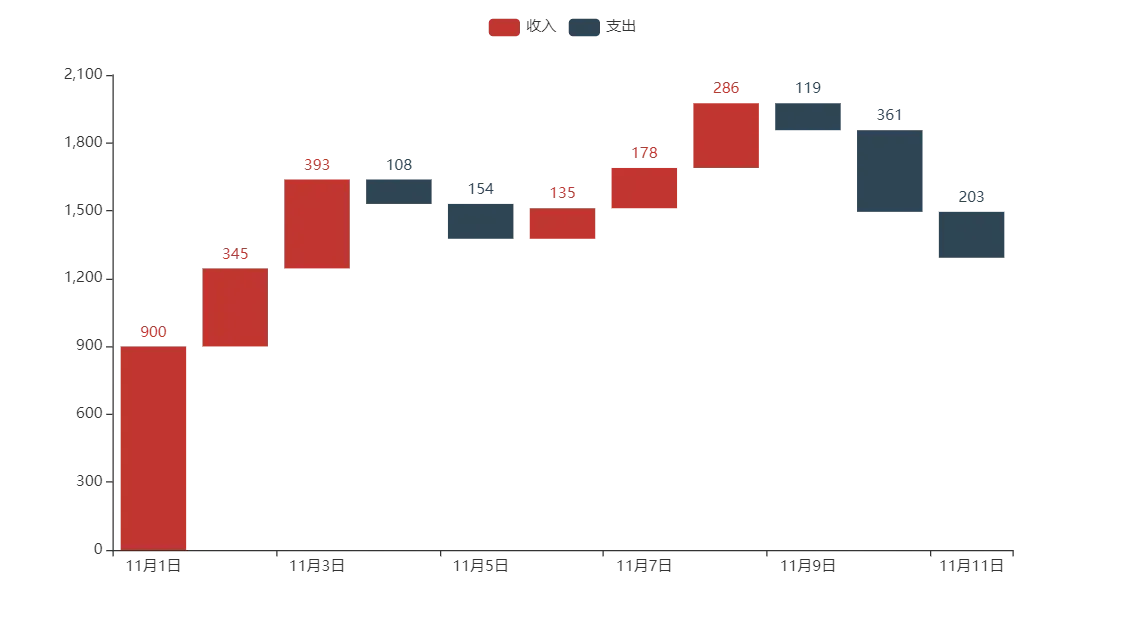
柱形图与折线组合图
import pyecharts.options as opts
from pyecharts.charts import Bar, Line

"""
Gallery 使用 pyecharts 1.1.0
参考地址: https://www.echartsjs.com/examples/editor.html?c=mix-line-bar

目前无法实现的功能:

1、暂无
"""

x_data = ["1月", "2月", "3月", "4月", "5月", "6月", "7月", "8月", "9月", "10月", "11月", "12月"]

bar = (
    Bar(init_opts=opts.InitOpts(width="1600px", height="800px"))
    .add_xaxis(xaxis_data=x_data)
    .add_yaxis(
        series_name="蒸发量",
        y_axis=[
            2.0,
            4.9,
            7.0,
            23.2,
            25.6,
            76.7,
            135.6,
            162.2,
            32.6,
            20.0,
            6.4,
            3.3,
        ],
        label_opts=opts.LabelOpts(is_show=False),
    )
    .add_yaxis(
        series_name="降水量",
        y_axis=[
            2.6,
            5.9,
            9.0,
            26.4,
            28.7,
            70.7,
            175.6,
            182.2,
            48.7,
            18.8,
            6.0,
            2.3,
        ],
        label_opts=opts.LabelOpts(is_show=False),
    )
    .extend_axis(  #扩展 X/Y 轴
        yaxis=opts.AxisOpts(   #yaxis新增 Y 坐标轴配置项,AxisOpts坐标轴配置项
            name="温度",
            type_="value",  #'value': 数值轴,适用于连续数据
            min_=0,
            max_=25,
            interval=5, # 强制设置坐标轴分割间隔
            axislabel_opts=opts.LabelOpts(formatter="{value} °C"),# 坐标轴标签配置项      formatter回调函数,value传入的数据值
        )
    )
    .set_global_opts(
        tooltip_opts=opts.TooltipOpts(#TooltipOpts:提示框配置项
            is_show=True, trigger="axis", axis_pointer_type="cross"
            #is_show是否显示提示框组件,trigger触发类型,'axis': 坐标轴触发,主要在柱状图,折线图等会使用类目轴的图表中使用
            #axis_pointer_type指示器类型'cross':十字准星指示器。其实是种简写,表示启用两个正交的轴的 axisPointer。
        ),
        xaxis_opts=opts.AxisOpts(   #坐标轴配置项
            type_="category", #'category': 类目轴,适用于离散的类目数据,为该类型时必须通过 data 设置类目数据。
            axispointer_opts=opts.AxisPointerOpts(is_show=True, type_="shadow"), # 坐标轴指示器配置项
        ),  #is_show是否显示坐标轴指示器,type_指示器类型# 'line' 直线指示器'shadow' 阴影指示器'none' 无指示器
        yaxis_opts=opts.AxisOpts(
            name="水量",
            type_="value",
            min_=0,
            max_=250,
            interval=50,  # 强制设置坐标轴分割间隔
            axislabel_opts=opts.LabelOpts(formatter="{value} ml"), # 坐标轴标签配置项      formatter回调函数,value传入的数据值
            axistick_opts=opts.AxisTickOpts(is_show=True), # 坐标轴刻度配置项
            splitline_opts=opts.SplitLineOpts(is_show=True), # 分割线配置项
        ),
    )
)

line = (
    Line()
    .add_xaxis(xaxis_data=x_data)
    .add_yaxis(
        series_name="平均温度",
        yaxis_index=1,  # 使用的 y 轴的 index,在单个图表实例中存在多个 y 轴的时候有用
        y_axis=[2.0, 2.2, 3.3, 4.5, 6.3, 10.2, 20.3, 23.4, 23.0, 16.5, 12.0, 6.2],
        label_opts=opts.LabelOpts(is_show=False),
    )
)

# bar.overlap(line).render("mixed_bar_and_line.html")
bar.overlap(line).render_notebook()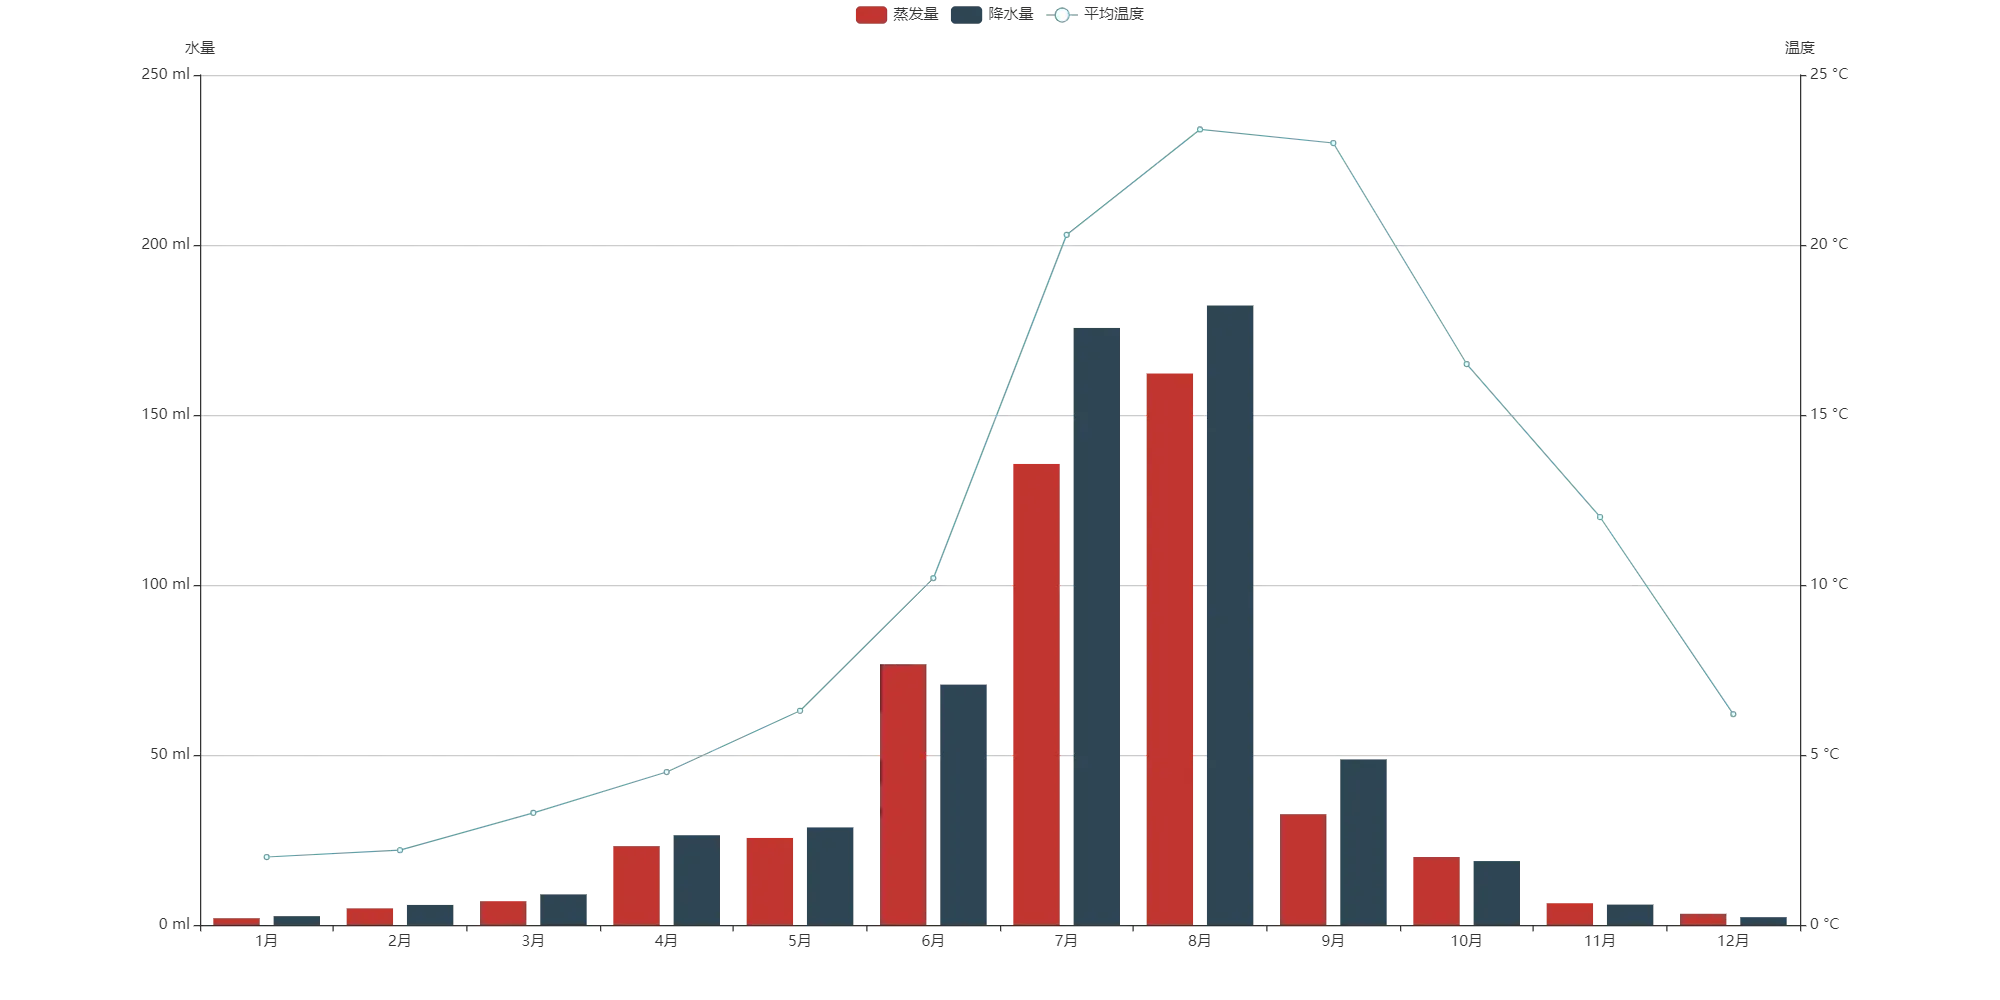
图形组件的使用-可加水印
from pyecharts import options as opts
from pyecharts.charts import Bar
from pyecharts.commons.utils import JsCode
from pyecharts.faker import Faker


c = (
    Bar()
    .add_xaxis(Faker.choose())
    .add_yaxis("商家A", Faker.values())
    .add_yaxis("商家B", Faker.values())
    .set_global_opts(
        title_opts=opts.TitleOpts(title="Bar-Graphic 组件示例"),
        graphic_opts=[
            opts.GraphicGroup(#GraphicGroup:原生图形元素组件
                graphic_item=opts.GraphicItem(  # graphic_item图形的配置项
                    rotation=JsCode("Math.PI / 4"),# 旋转(rotation):默认值是 0。表示旋转的弧度值。正值表示逆时针旋转。
                    bounding="raw",# bounding决定此图形元素在定位时,对自身的包围盒计算方式。可选:
                    # 'all':(默认) 表示用自身以及子节点整体的经过 transform 后的包围盒进行定位。这种方式易于使整体都限制在父元素范围中。
                    # 'raw':表示仅仅用自身(不包括子节点)的没经过 tranform 的包围盒进行定位。这种方式易于内容超出父元素范围的定位方式。
                    right=110, # 描述怎么根据父元素进行定位。
                    # 父元素是指:如果是顶层元素,父元素是 echarts 图表容器。如果是 group 的子元素,父元素就是 group 元素。
                    bottom=110,
                    z=100,# z 方向的高度,决定层叠关系。
                ),
                children=[  # 子节点列表,其中项都是一个图形元素定义。
                    # 目前可以选择 GraphicText,GraphicImage,GraphicRect
                    opts.GraphicRect(  #GraphicRect:原生图形矩形配置项
                        graphic_item=opts.GraphicItem(
                            left="center", top="center", z=100
                        ),
                        graphic_shape_opts=opts.GraphicShapeOpts(width=400, height=50),  #GraphicShapeOpts图形的形状配置项
                        graphic_basicstyle_opts=opts.GraphicBasicStyleOpts(# GraphicBasicStyleOpts图形基本配置项
                            fill="rgba(0,0,0,0.3)"  #填充色
                        ),
                    ),
                    opts.GraphicText(#GraphicText:原生图形文本配置项
                        graphic_item=opts.GraphicItem(
                            left="center", top="center", z=100
                        ),
                        graphic_textstyle_opts=opts.GraphicTextStyleOpts(  # 图形文本样式的配置项
                            text="pyecharts bar chart",
                            font="bold 26px Microsoft YaHei",
                            graphic_basicstyle_opts=opts.GraphicBasicStyleOpts(
                                fill="#fff"
                            ),
                        ),
                    ),
                ],
            )
        ],
    )
#     .render("bar_graphic_component.html")
)
c.render_notebook()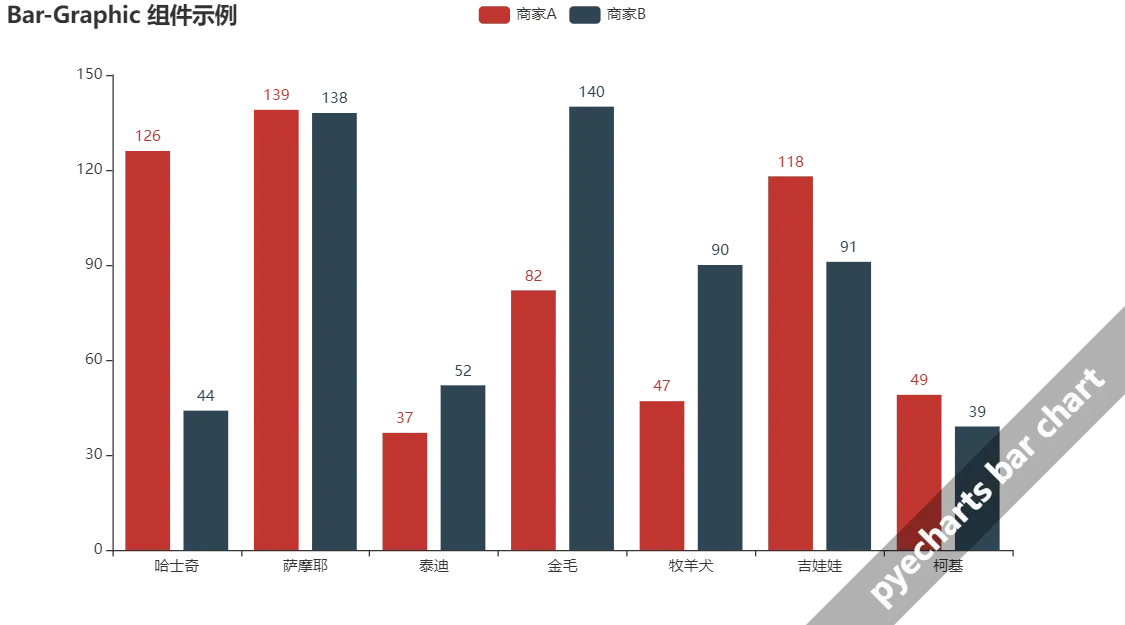
堆叠部分数据
from pyecharts import options as opts
from pyecharts.charts import Bar
from pyecharts.faker import Faker


c = (
    Bar()
    .add_xaxis(Faker.choose())
    .add_yaxis("商家A", Faker.values(), stack="stack1")
    .add_yaxis("商家B", Faker.values(), stack="stack1")
    .add_yaxis("商家C", Faker.values())
    .set_series_opts(label_opts=opts.LabelOpts(is_show=False))
    .set_global_opts(title_opts=opts.TitleOpts(title="Bar-堆叠数据(部分)"))
#     .render("bar_stack1.html")
)
c.render_notebook()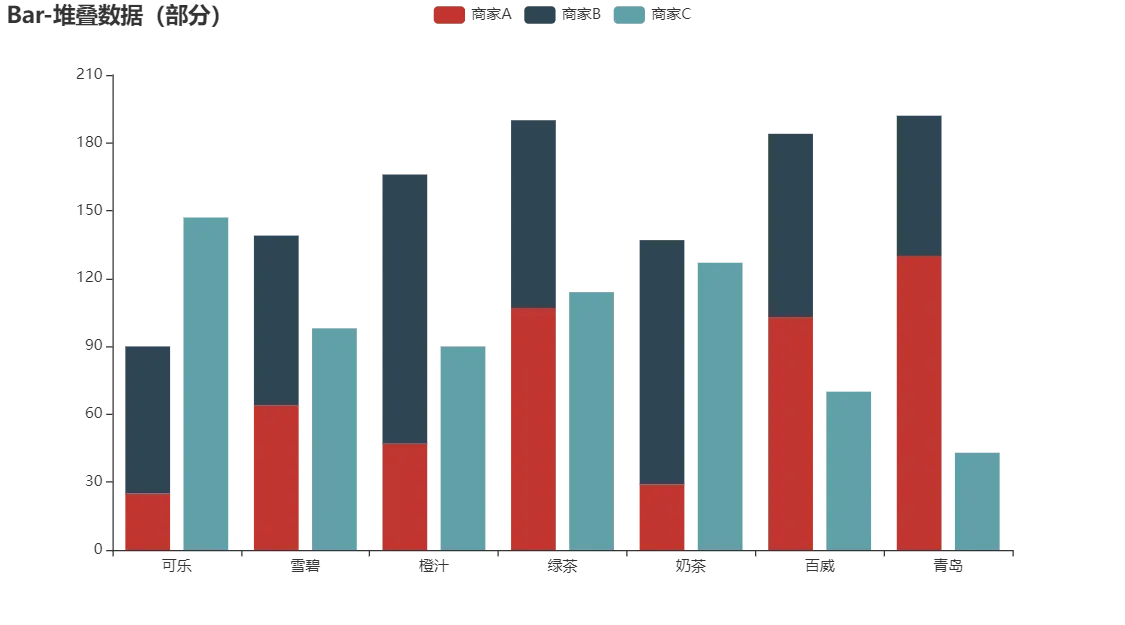
x轴y轴命名
from pyecharts import options as opts
from pyecharts.charts import Bar
from pyecharts.faker import Faker


c = (
    Bar()
    .add_xaxis(Faker.choose())
    .add_yaxis("商家A", Faker.values())
    .add_yaxis("商家B", Faker.values())
    .set_global_opts(
        title_opts=opts.TitleOpts(title="Bar-XY 轴名称"),
        yaxis_opts=opts.AxisOpts(name="我是 Y 轴"),
        xaxis_opts=opts.AxisOpts(name="我是 X 轴"),
    )
#     .render("bar_xyaxis_name.html")
)
c.render_notebook()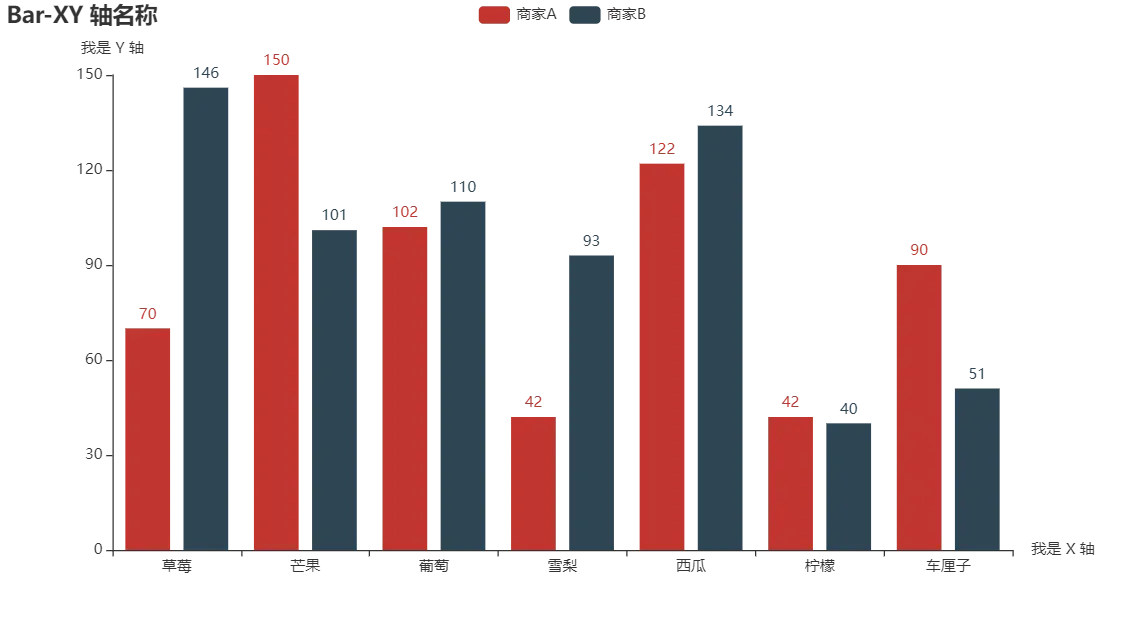
添加自定义背景图
from pyecharts import options as opts
from pyecharts.charts import Bar
from pyecharts.commons.utils import JsCode
from pyecharts.faker import Faker

c = (
    Bar(
        init_opts=opts.InitOpts(
            bg_color={"type": "pattern", "image": JsCode("img"), "repeat": "no-repeat"}
#         "type": "pattern" 表示我们用图片作背景,
#             "image": JsCode("img") 表示我们用 JavaScript 代码来设置这个背景图,
#             "repeat": "no-repeat" 表示图片不重复。

        )
    )
    .add_xaxis(Faker.choose())
    .add_yaxis("商家A", Faker.values())
    .add_yaxis("商家B", Faker.values())
    .set_global_opts(
        title_opts=opts.TitleOpts(
            title="Bar-背景图基本示例",
            subtitle="我是副标题",
            title_textstyle_opts=opts.TextStyleOpts(color="white"),  #TextStyleOpts:文字样式配置项,文字颜色
        )
    )
)
#             而 add_js_funcs 方法就是执行相关的 JavaScript 代码,
#             这里的 JavaScript 代码也很简单,就设置一个名为 img 的变量,
#             指定一下路径。也可以用文件路径
c.add_js_funcs(
    """
    var img = new Image(); img.src = 'https://kr.shanghai-jiuxin.com/file/bizhi/20220927/4gzitkl1lyv.jpg';
    """
)
c.render_notebook()

柱状图动画延迟&分割线
import pyecharts.options as opts
from pyecharts.charts import Bar

"""
Gallery 使用 pyecharts 1.1.0
参考地址: https://www.echartsjs.com/examples/editor.html?c=bar-animation-delay

目前无法实现的功能:

1、动画延迟效果暂时没有加入到代码中
"""

category = ["类目{}".format(i) for i in range(0, 100)]
red_bar = [
    0,
    -8.901463875624668,
    -17.025413764148556,
    -24.038196249566663,
    -29.66504684804471,
    -33.699527649688676,
    -36.00971978255796,
    -36.541005056170455,
    -35.31542466107655,
    -32.427752866005996,
    -28.038563739693934,
    -22.364693082297347,
    -15.667600860943732,
    -8.240217424060843,
    -0.3929067389459173,
    7.560799717904647,
    15.318054209871054,
    22.599523033552096,
    29.16065418543528,
    34.800927952557615,
    39.37074152590451,
    42.77569739999406,
    44.97819140223978,
    45.99632376477021,
    45.900279829731865,
    44.806440199911805,
    42.86957840395034,
    40.2735832137877,
    37.22119936652441,
    33.92331243435557,
    30.588309963978517,
    27.412031986865767,
    24.56878097935778,
    22.203796820272576,
    20.427519715115604,
    19.311867685884827,
    18.888649906111855,
    19.150128087782186,
    20.051630602288828,
    21.516023200879346,
    23.439750867099516,
    25.700091656548704,
    28.163208735293757,
    30.692553648214542,
    33.1571635093161,
    35.439407573791215,
    37.44177367693234,
    39.09234039030659,
    40.34865356244595,
    41.19981246258526,
    41.66666666666667,
    41.80012531240646,
    41.67768039516203,
    41.39834040182826,
    41.07625507973403,
    40.833382300579814,
    40.79160029175877,
    41.06470032034727,
    41.75070457358366,
    42.924940903672564,
    44.63427081999565,
    46.89281122872821,
    49.679416561286956,
    52.93709961387478,
    56.574470884754874,
    60.46917221906629,
    64.47317623531558,
    68.41972346252496,
    72.1315793340836,
    75.43021771943799,
    78.14548044723074,
    80.12522637371026,
    81.24447108408411,
    81.41353029256493,
    80.58471628367427,
    78.75719600392792,
    75.97969924353211,
    72.35086229880064,
    68.01710226438443,
    63.16803467673056,
    58.029567166714706,
    52.854918421647554,
    47.91391949819902,
    43.48104807503482,
    39.82272085822884,
    37.18442111754884,
    35.778264289169215,
    35.77160292258658,
    37.27724241244461,
    40.345781666728996,
    44.96051012913295,
    51.035187614675685,
    58.41491053964701,
    66.8801325453253,
    76.15376513468516,
    85.91114110149952,
    95.79248672571518,
    105.41742429574506,
    114.40092042993717,
    122.37001313784816,
]
blue_bar = [
    -50,
    -47.18992898088751,
    -42.54426104547181,
    -36.290773900754886,
    -28.71517529663627,
    -20.146937097399626,
    -10.94374119697364,
    -1.4752538113770308,
    7.893046603320797,
    16.81528588241657,
    24.979206795219028,
    32.11821023962515,
    38.02096119056733,
    42.53821720798438,
    45.58667093073836,
    47.14973738101559,
    47.275355710354944,
    46.07100702178889,
    43.6962693226927,
    40.35333240268025,
    36.275975292575026,
    31.71756381888028,
    26.938653692729076,
    22.194784893913152,
    17.725026430574392,
    13.741778696752679,
    10.422266555457615,
    7.902063853319403,
    6.270884006107842,
    5.570756810898967,
    5.796594266992678,
    6.899033489892203,
    8.7893381290192,
    11.346045936704996,
    14.42297348773613,
    17.858132851517098,
    21.483081596548438,
    25.132218074866262,
    28.651548555679597,
    31.906490373810854,
    34.788333671419466,
    37.21906041552118,
    39.154309232933485,
    40.58437366457342,
    41.5332247510366,
    42.05565130942339,
    42.23270781895,
    42.165745792772285,
    41.969375711588256,
    41.76375960543808,
    41.66666666666667,
    41.7857343479728,
    42.21136481847887,
    43.01065209435119,
    44.22268037417866,
    45.855461823273586,
    47.88469584957917,
    50.25443606443524,
    52.879650371477126,
    55.650558977584225,
    58.43853958732492,
    61.10330341815434,
    63.500974294013034,
    65.49264961151306,
    66.95298925309743,
    67.77836838841961,
    67.89414332224722,
    67.26061575374229,
    65.87733853082335,
    63.785482681031894,
    61.068077697490004,
    57.84804048526095,
    54.284018163297375,
    50.564180830851214,
    46.89820707575337,
    43.50780217852947,
    40.616171775045245,
    38.4369379107128,
    37.16302649485318,
    36.95607267600796,
    37.93688225696513,
    40.17745279877072,
    43.694998595987045,
    48.44834150353593,
    54.33692802801367,
    61.20261650152743,
    68.83425165632042,
    76.97491319735354,
    85.33159602026458,
    93.58695857541488,
    101.4126683297632,
    108.48378461530217,
    114.49355390682695,
    119.16795429637915,
    122.27931702317058,
    123.65837448506679,
    123.20413594805603,
    120.89107255501017,
    116.7731992576505,
    110.98476877890735,
]

c = (
    Bar(init_opts=opts.InitOpts(width="1600px", height="800px"))
    .add_xaxis(xaxis_data=category)
    .add_yaxis(
        series_name="bar", y_axis=red_bar, label_opts=opts.LabelOpts(is_show=False)
    )
    .add_yaxis(
        series_name="bar2",
        y_axis=blue_bar,
        label_opts=opts.LabelOpts(is_show=False),
    )
    .set_global_opts(
        title_opts=opts.TitleOpts(title="柱状图动画延迟"),
        xaxis_opts=opts.AxisOpts(splitline_opts=opts.SplitLineOpts(is_show=False)),  # 分割线配置项,x轴不显示
        yaxis_opts=opts.AxisOpts(
            axistick_opts=opts.AxisTickOpts(is_show=True),# 坐标轴刻度配置项,y轴显示,就是凸起来那个小点
            splitline_opts=opts.SplitLineOpts(is_show=True),  #y轴有分割线
        ),
    )
#     .render("bar_chart_display_delay.html")
)
c.render_notebook()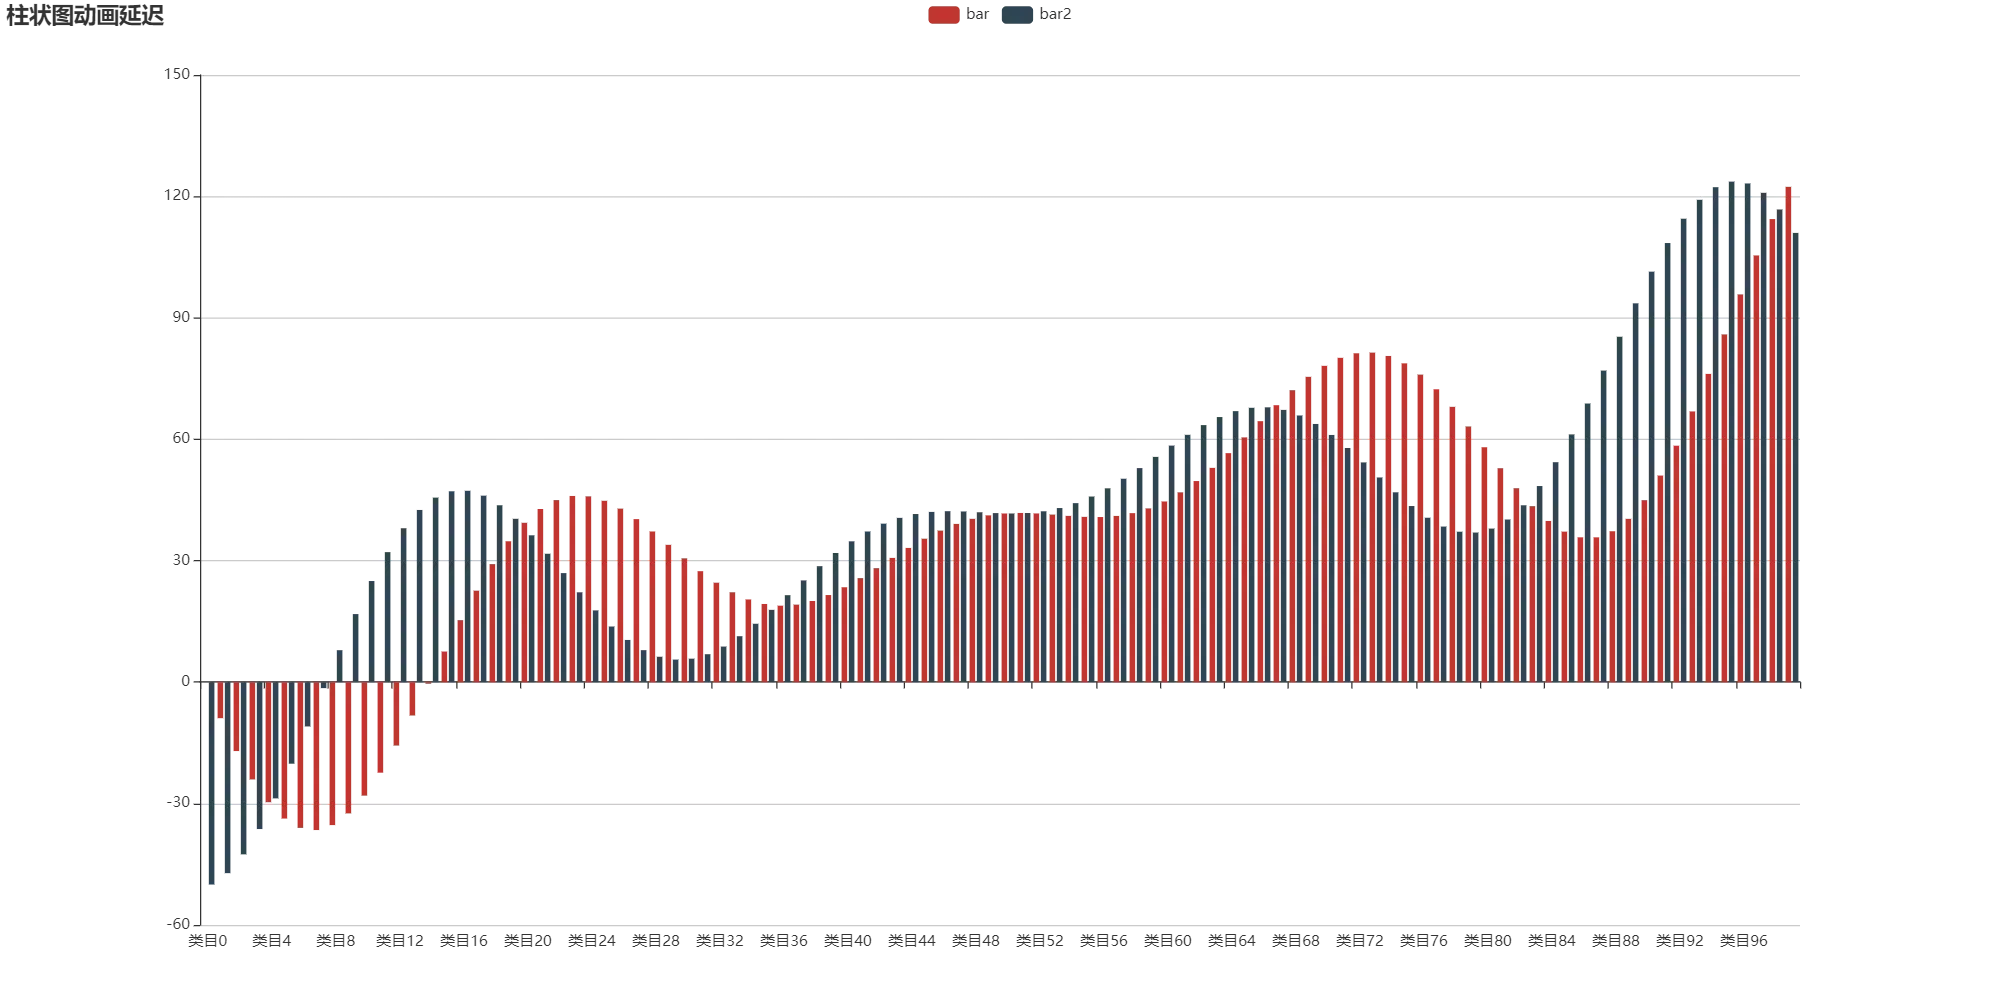
可以垂直滑动的数据区域
from pyecharts import options as opts
from pyecharts.charts import Bar
from pyecharts.faker import Faker

c = (
    Bar()
    .add_xaxis(Faker.days_attrs)
    .add_yaxis("商家A", Faker.days_values, color=Faker.rand_color())
    .set_global_opts(
        title_opts=opts.TitleOpts(title="Bar-DataZoom(slider-垂直)"),
        datazoom_opts=opts.DataZoomOpts(orient="vertical"), #DataZoomOpts:区域缩放配置项, 布局方式是横还是竖
    )
#     .render("bar_datazoom_slider_vertical.html")
)
c.render_notebook()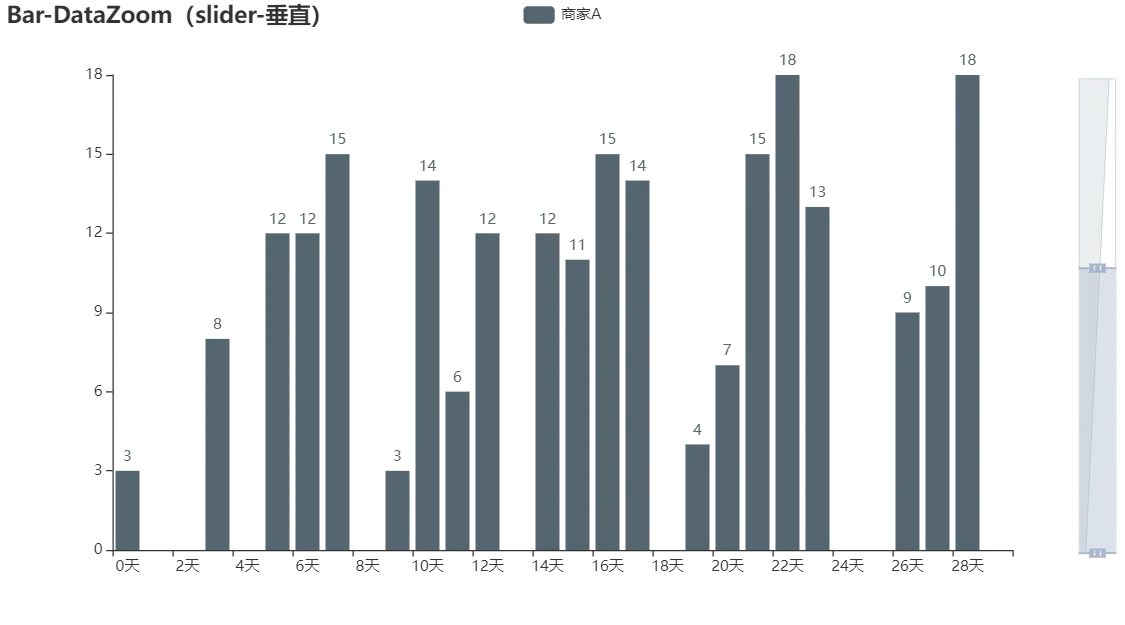
直方图(颜色区分)
from pyecharts import options as opts
from pyecharts.charts import Bar
from pyecharts.faker import Faker


x = Faker.dogs + Faker.animal
xlen = len(x)
y = []
for idx, item in enumerate(x):
    if idx <= xlen / 2:  #一半一个颜色
        y.append(
            opts.BarItem(  #BarItem:柱状图数据项
                name=item,  # 数据项名称
                value=(idx + 1) * 10, # 单个数据项的数值
                itemstyle_opts=opts.ItemStyleOpts(color="#749f83"),  # 图元样式配置项
            )
        )
    else:
        y.append(
            opts.BarItem(
                name=item,
                value=(xlen + 1 - idx) * 10,
                itemstyle_opts=opts.ItemStyleOpts(color="#d48265"),
            )
        )

c = (
    Bar()
    .add_xaxis(x)
    .add_yaxis("series0", y, category_gap=0, color=Faker.rand_color())  # category_gap同一系列的柱间距离,默认为类目间距的 20%,可设固定值
    .set_global_opts(title_opts=opts.TitleOpts(title="Bar-直方图(颜色区分)"))
#     .render("bar_histogram_color.html")
)
c.render_notebook()
y轴格式化单位
from pyecharts import options as opts
from pyecharts.charts import Bar
from pyecharts.faker import Faker


c = (
    Bar()
    .add_xaxis(Faker.choose())
    .add_yaxis("商家A", Faker.values())
    .add_yaxis("商家B", Faker.values())
    .set_global_opts(
        title_opts=opts.TitleOpts(title="Bar-Y 轴 formatter"),
        yaxis_opts=opts.AxisOpts(axislabel_opts=opts.LabelOpts(formatter="{value} /月")),
    )
#     .render("bar_yaxis_formatter.html")
)
c.render_notebook()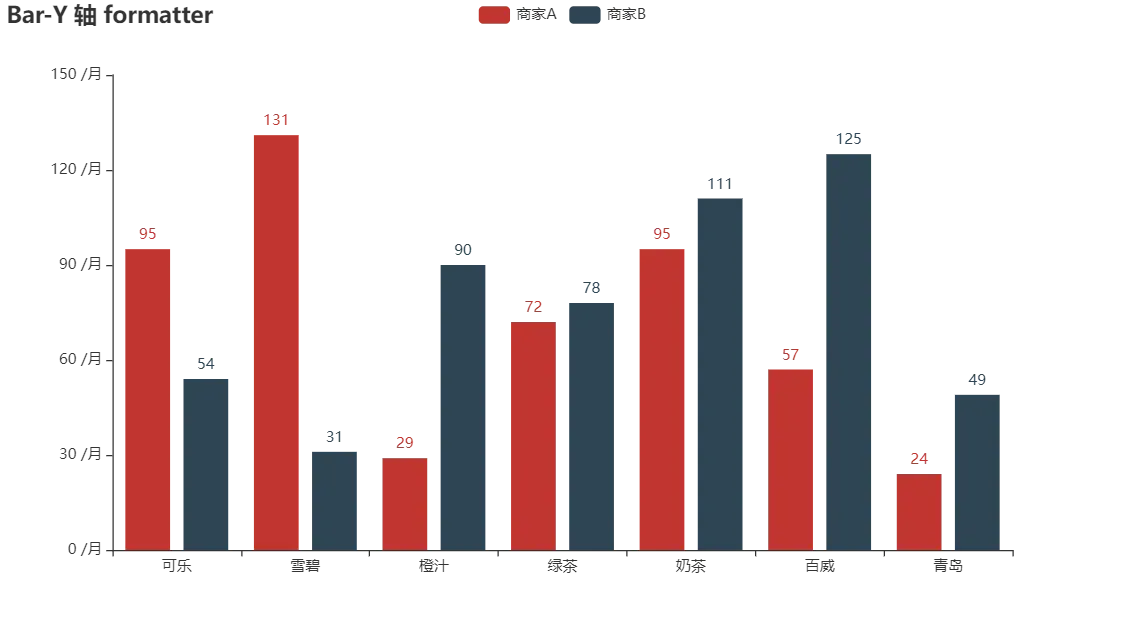
标记点最大-最小-平均值
from pyecharts import options as opts
from pyecharts.charts import Bar
from pyecharts.faker import Faker

c = (
    Bar()
    .add_xaxis(Faker.choose())
    .add_yaxis("商家A", Faker.values())
    .add_yaxis("商家B", Faker.values())
    .set_global_opts(title_opts=opts.TitleOpts(title="Bar-MarkPoint(指定类型)"))
    .set_series_opts(
        label_opts=opts.LabelOpts(is_show=False),
        markpoint_opts=opts.MarkPointOpts(# 标记点配置项
            data=[ # 标记点数据
                opts.MarkPointItem(type_="max", name="最大值"),#MarkPointItem:标记点数据项
                opts.MarkPointItem(type_="min", name="最小值"),
                opts.MarkPointItem(type_="average", name="平均值"),
            ]
        ),
    )
#     .render("bar_markpoint_type.html")
)
c.render_notebook()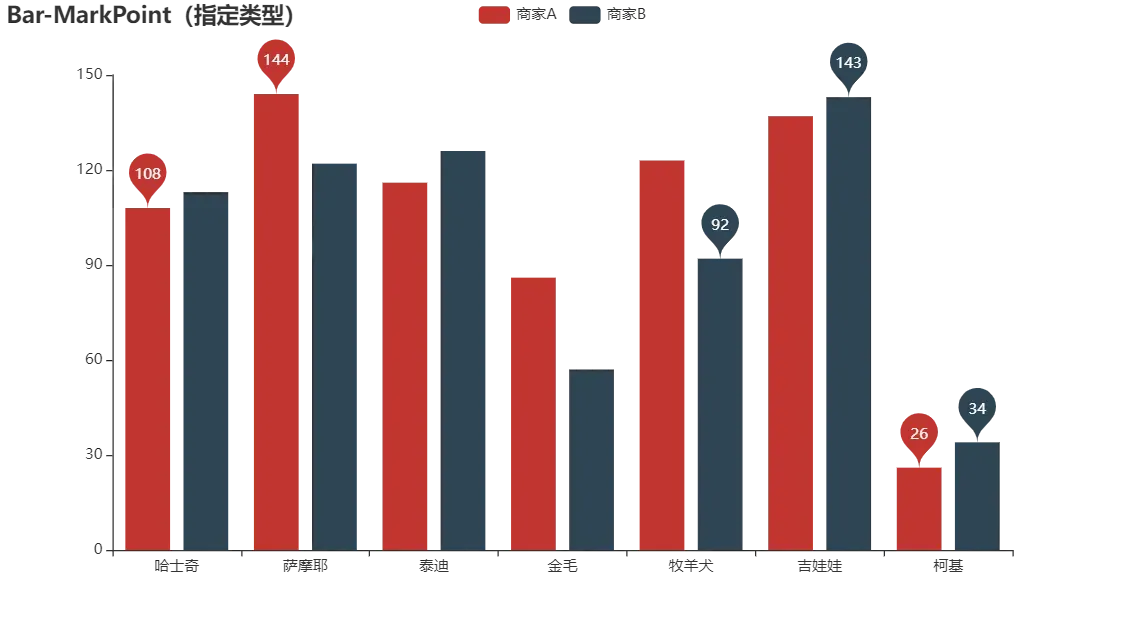
3个y轴
import pyecharts.options as opts
from pyecharts.charts import Bar, Line

"""
Gallery 使用 pyecharts 1.0.0
参考地址: https://www.echartsjs.com/examples/editor.html?c=multiple-y-axis

目前无法实现的功能:

1、暂无
"""

colors = ["#5793f3", "#d14a61", "#675bba"]
x_data = ["1月", "2月", "3月", "4月", "5月", "6月", "7月", "8月", "9月", "10月", "11月", "12月"]
legend_list = ["蒸发量", "降水量", "平均温度"]
evaporation_capacity = [
    2.0,
    4.9,
    7.0,
    23.2,
    25.6,
    76.7,
    135.6,
    162.2,
    32.6,
    20.0,
    6.4,
    3.3,
]
rainfall_capacity = [
    2.6,
    5.9,
    9.0,
    26.4,
    28.7,
    70.7,
    175.6,
    182.2,
    48.7,
    18.8,
    6.0,
    2.3,
]
average_temperature = [2.0, 2.2, 3.3, 4.5, 6.3, 10.2, 20.3, 23.4, 23.0, 16.5, 12.0, 6.2]

bar = (
    Bar(init_opts=opts.InitOpts(width="1680px", height="800px"))
    .add_xaxis(xaxis_data=x_data)
    .add_yaxis(
        series_name="蒸发量",
        y_axis=evaporation_capacity,
        yaxis_index=0,   #多轴时才会有索引,默认轴索引都为0
        color=colors[1],
    )
    .add_yaxis(
        series_name="降水量", y_axis=rainfall_capacity, yaxis_index=1, color=colors[0]
    )
    .extend_axis(
        yaxis=opts.AxisOpts(
            name="蒸发量",
            type_="value",
            min_=0,
            max_=250,
            position="right",  #在右
            axisline_opts=opts.AxisLineOpts(
                linestyle_opts=opts.LineStyleOpts(color=colors[1])
            ),
            axislabel_opts=opts.LabelOpts(formatter="{value} ml"),
        )
    )
    .extend_axis(
        yaxis=opts.AxisOpts(
            type_="value",
            name="温度",
            min_=0,
            max_=25,
            position="left", #在左
            axisline_opts=opts.AxisLineOpts(
                linestyle_opts=opts.LineStyleOpts(color=colors[2])
            ),
            axislabel_opts=opts.LabelOpts(formatter="{value} °C"),
            splitline_opts=opts.SplitLineOpts(
                is_show=True, linestyle_opts=opts.LineStyleOpts(opacity=1)  # opacity图形透明度,支持从 0 到 1 的数字,为 0 时不绘制该图形。
            ),
        )
    )
    .set_global_opts(
        yaxis_opts=opts.AxisOpts(
            type_="value",
            name="降水量",
            min_=0,
            max_=250,
            position="right",
            offset=80,# Y 轴相对于默认位置的偏移,在相同的 position 上有多个 Y 轴的时候有用。
            axisline_opts=opts.AxisLineOpts(
                linestyle_opts=opts.LineStyleOpts(color=colors[0])
            ),
            axislabel_opts=opts.LabelOpts(formatter="{value} ml"),
        ),
        tooltip_opts=opts.TooltipOpts(trigger="axis", axis_pointer_type="cross"),
        #TooltipOpts:提示框配置项
        # 'axis': 坐标轴触发,主要在柱状图,折线图等会使用类目轴的图表中使用。
        # 'cross':十字准星指示器。其实是种简写,表示启用两个正交的轴的 axisPointer。
    )
)

line = (
    Line()
    .add_xaxis(xaxis_data=x_data)
    .add_yaxis(
        series_name="平均温度", y_axis=average_temperature, yaxis_index=2, color=colors[2]
    )
)

# bar.overlap(line).render("multiple_y_axes.html")
bar.overlap(line).render_notebook()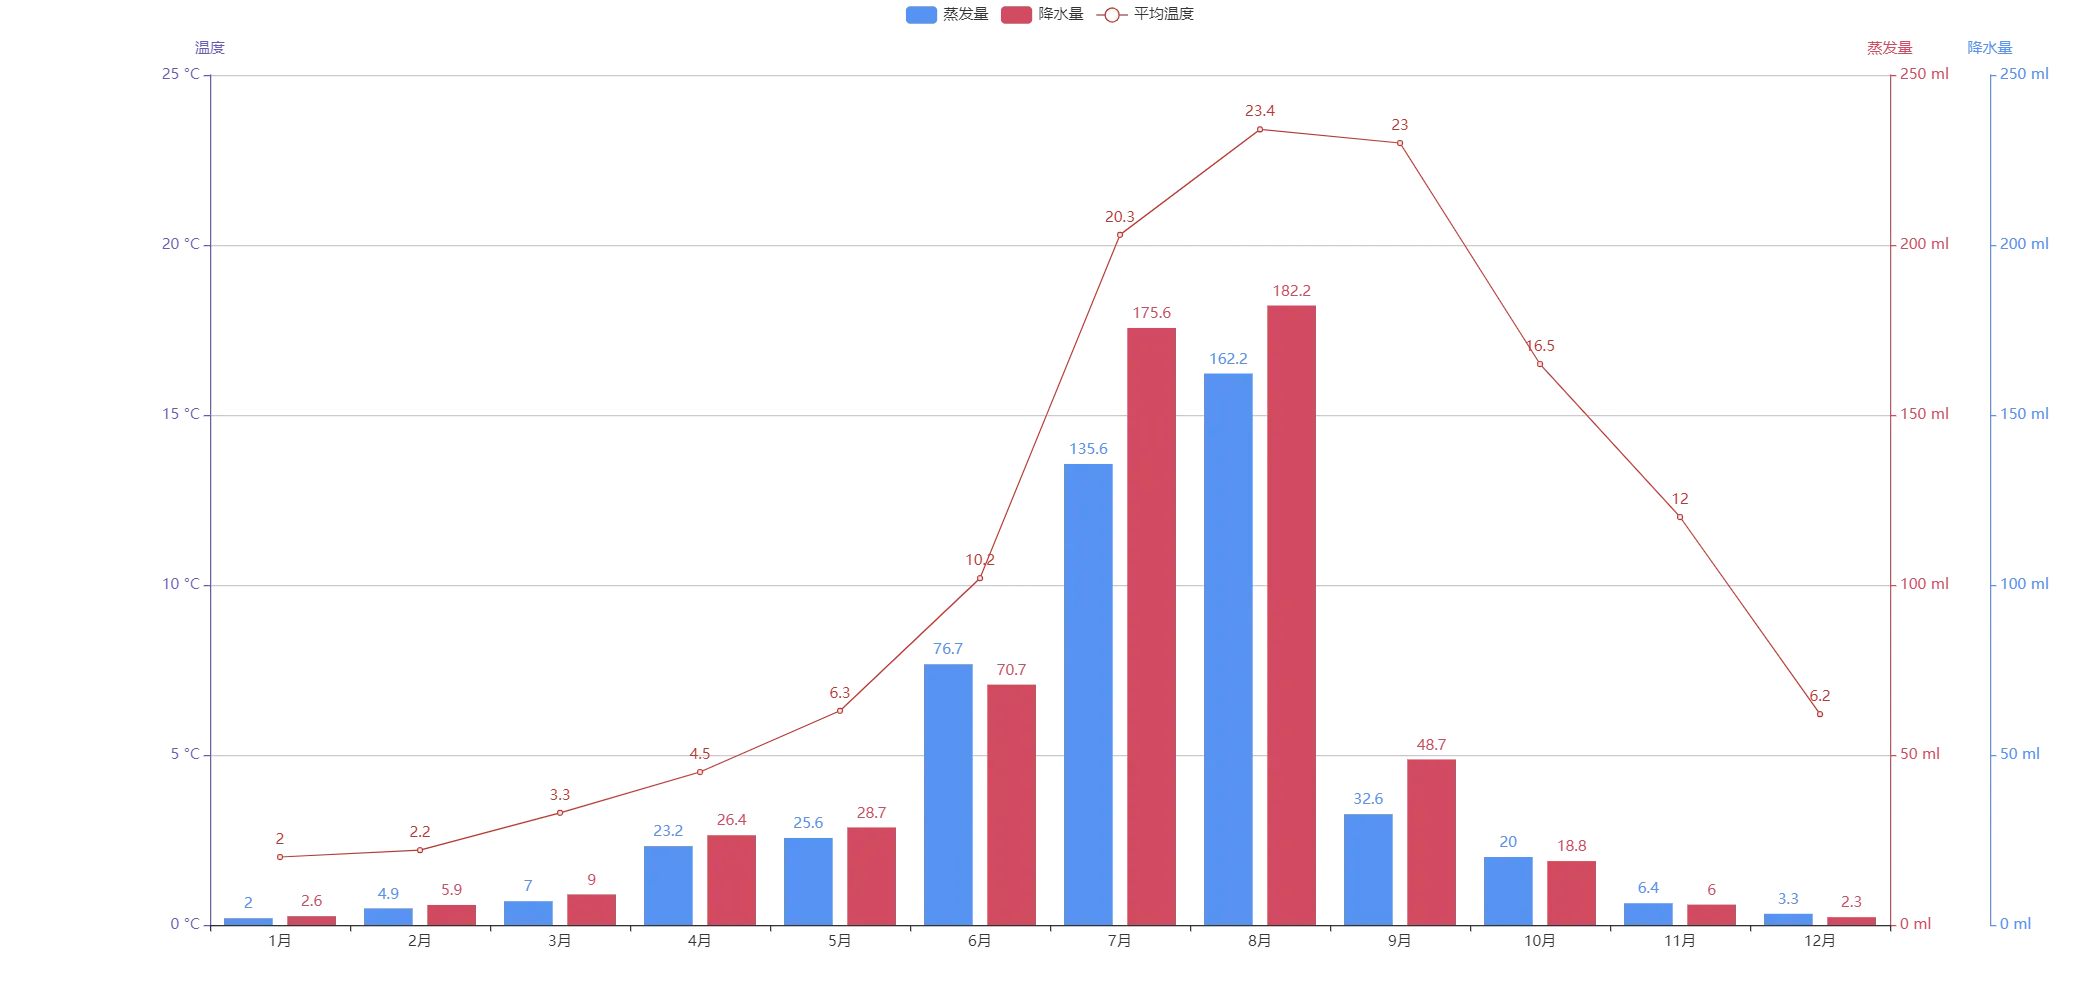
自定义柱状图颜色
from pyecharts import options as opts
from pyecharts.charts import Bar
from pyecharts.commons.utils import JsCode
from pyecharts.faker import Faker


color_function = """
        function (params) {
            if (params.value > 0 && params.value < 50) {
                return 'red';
            } else if (params.value > 50 && params.value < 100) {
                return 'blue';
            }
            return 'green';
        }
        """
c = (
    Bar()
    .add_xaxis(Faker.choose())
    .add_yaxis(
        "商家A",
        Faker.values(),
        itemstyle_opts=opts.ItemStyleOpts(color=JsCode(color_function)), #ItemStyleOpts:图元样式配置项
    )
    .add_yaxis(
        "商家B",
        Faker.values(),
        itemstyle_opts=opts.ItemStyleOpts(color=JsCode(color_function)),
    )
    .add_yaxis(
        "商家C",
        Faker.values(),
        itemstyle_opts=opts.ItemStyleOpts(color=JsCode(color_function)),
    )
    .set_global_opts(title_opts=opts.TitleOpts(title="Bar-自定义柱状颜色"))
#     .render("bar_custom_bar_color.html")
)
c.render_notebook()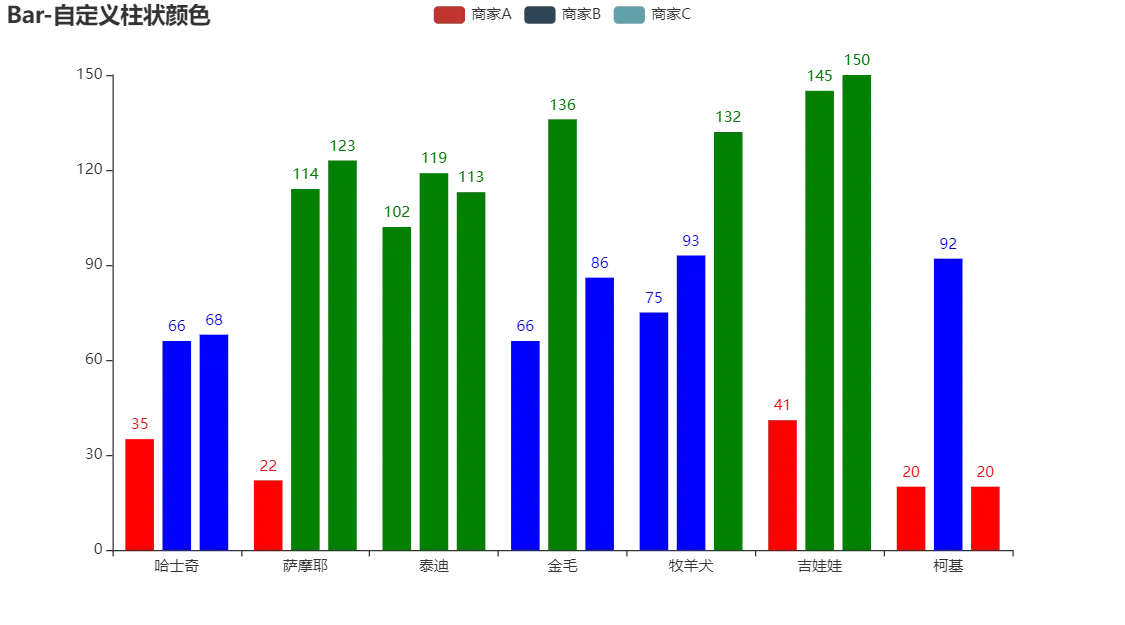
不同系列柱间距离
from pyecharts import options as opts
from pyecharts.charts import Bar
from pyecharts.faker import Faker


c = (
    Bar()
    .add_xaxis(Faker.choose())
    .add_yaxis("商家A", Faker.values(), gap="0%")
    # 不同系列的柱间距离,为百分比(如 '30%',表示柱子宽度的 30%)。
    # 如果想要两个系列的柱子重叠,可以设置 gap 为 '-100%'。这在用柱子做背景的时候有用。
    .add_yaxis("商家B", Faker.values(), gap="0%")
    .set_global_opts(title_opts=opts.TitleOpts(title="Bar-不同系列柱间距离"))
#     .render("bar_different_series_gap.html")
)
c.render_notebook()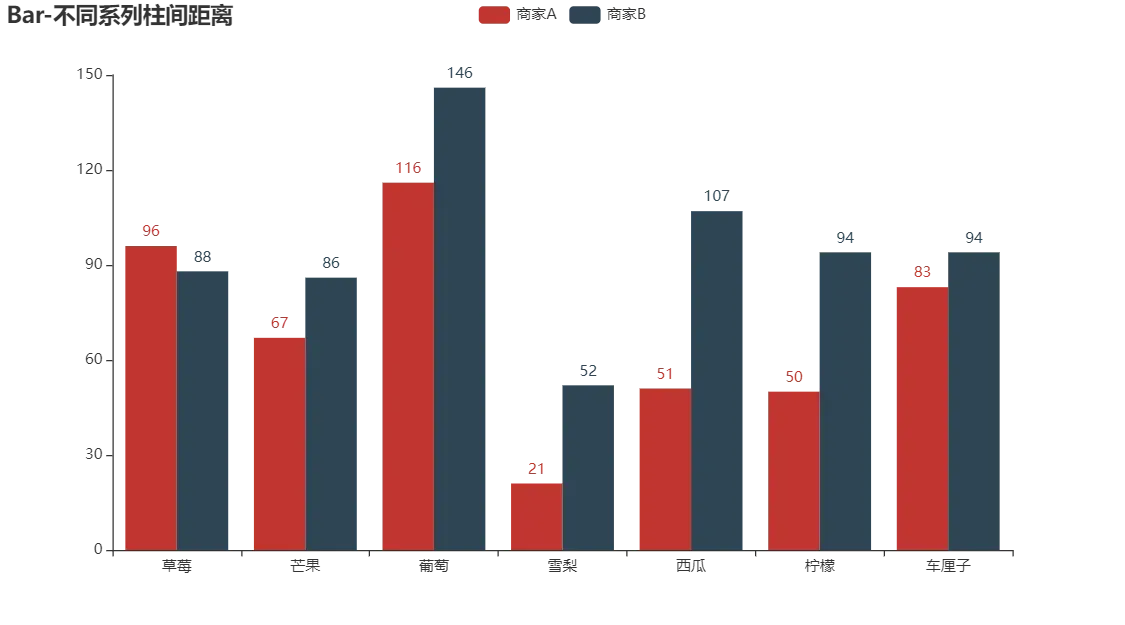
标记线最大-最小-平均值
from pyecharts import options as opts
from pyecharts.charts import Bar
from pyecharts.faker import Faker

c = (
    Bar()
    .add_xaxis(Faker.choose())
    .add_yaxis("商家A", Faker.values())
    .add_yaxis("商家B", Faker.values())
    .set_global_opts(title_opts=opts.TitleOpts(title="Bar-MarkLine(指定类型)"))
    .set_series_opts(
        label_opts=opts.LabelOpts(is_show=False),
        markline_opts=opts.MarkLineOpts( #MarkLineItem:标记线数据项
            data=[
                opts.MarkLineItem(type_="min", name="最小值"),
                opts.MarkLineItem(type_="max", name="最大值"),
                opts.MarkLineItem(type_="average", name="平均值"),
            ]
        ),
    )
)
c.render_notebook()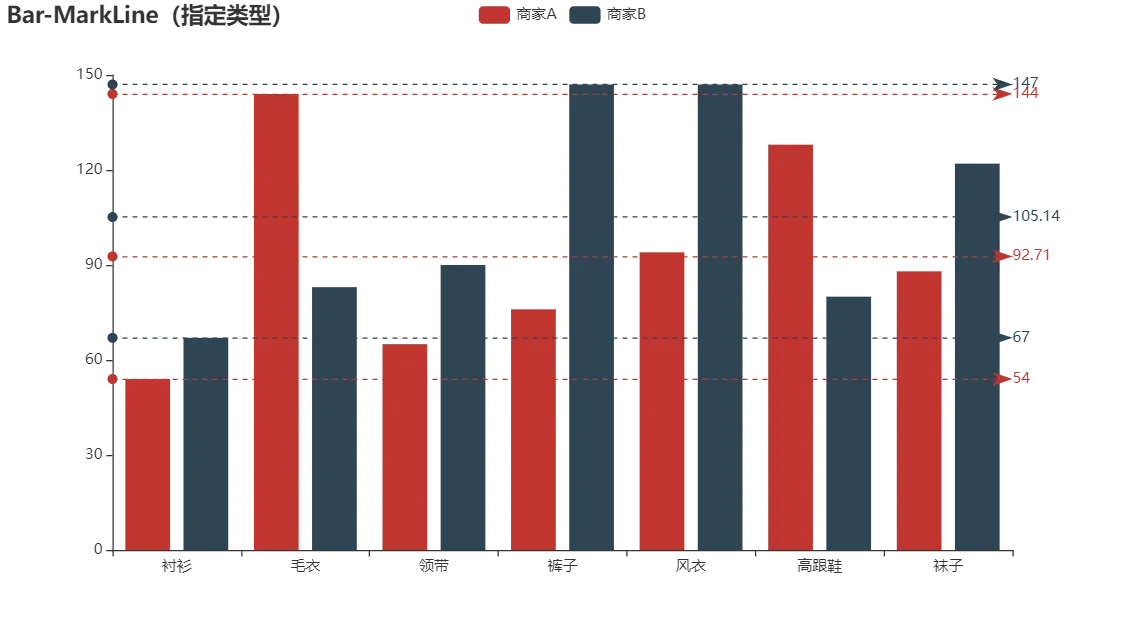
渐变圆柱
from pyecharts import options as opts
from pyecharts.charts import Bar
from pyecharts.commons.utils import JsCode
from pyecharts.faker import Faker

c = (
    Bar()
    .add_xaxis(Faker.choose())
    .add_yaxis("商家A", Faker.values(), category_gap="60%")# category_gap同一系列的柱间距离,默认为类目间距的 20%,可设固定值
    .set_series_opts(
        itemstyle_opts={  # 图元样式配置项
            "normal": {
                "color": JsCode(
                    """new echarts.graphic.LinearGradient(0, 0, 0, 1, [{
                offset: 0,
                color: 'rgba(0, 244, 255, 1)'
            }, {
                offset: 1,
                color: 'rgba(0, 77, 167, 1)'
            }], false)"""
                ),
                "barBorderRadius": [30, 30, 30, 30],
                "shadowColor": "rgb(0, 160, 221)",
            }
        }
    )
    .set_global_opts(title_opts=opts.TitleOpts(title="Bar-渐变圆柱"))
#     .render("bar_border_radius.html")
)
c.render_notebook()
单系列柱间距离
from pyecharts import options as opts
from pyecharts.charts import Bar
from pyecharts.faker import Faker


c = (
    Bar()
    .add_xaxis(Faker.choose())
    .add_yaxis("商家A", Faker.values(), category_gap="80%")
    .set_global_opts(title_opts=opts.TitleOpts(title="Bar-单系列柱间距离"))
#     .render("bar_same_series_gap.html")
)
c.render_notebook()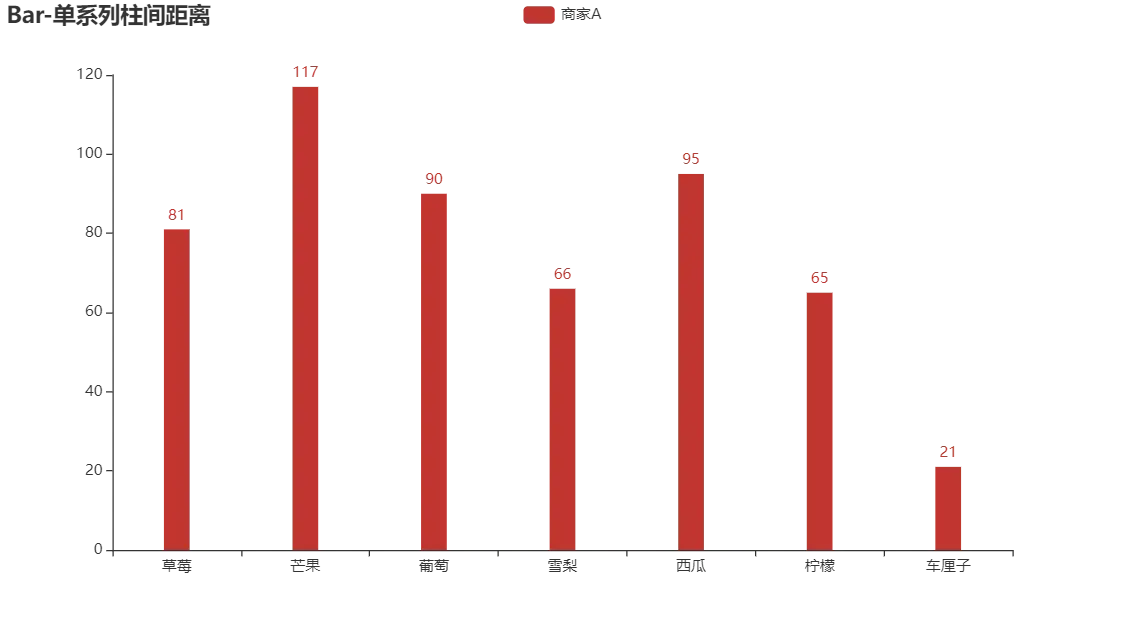
鼠标滚轮选择缩放区域
from pyecharts import options as opts
from pyecharts.charts import Bar
from pyecharts.faker import Faker

c = (
    Bar()
    .add_xaxis(Faker.days_attrs)
    .add_yaxis("商家A", Faker.days_values, color=Faker.rand_color())
    .set_global_opts(
        title_opts=opts.TitleOpts(title="Bar-DataZoom(inside)"),
        datazoom_opts=opts.DataZoomOpts(type_="inside"),#DataZoomOpts:区域缩放配置项
        # type_组件类型,可选 "slider", "inside"  ,slider是鼠标左右或者上下选择区域,inside是鼠标滚轮放大缩小
    )
#     .render("bar_datazoom_inside.html")
)
c.render_notebook()
默认取消显示某 Series
from pyecharts import options as opts
from pyecharts.charts import Bar
from pyecharts.faker import Faker


c = (
    Bar()
    .add_xaxis(Faker.choose())
    .add_yaxis("商家A", Faker.values())
    .add_yaxis("商家B", Faker.values(), is_selected=False)
    .set_global_opts(title_opts=opts.TitleOpts(title="Bar-默认取消显示某 Series"))
#     .render("bar_is_selected.html")
)
c.render_notebook()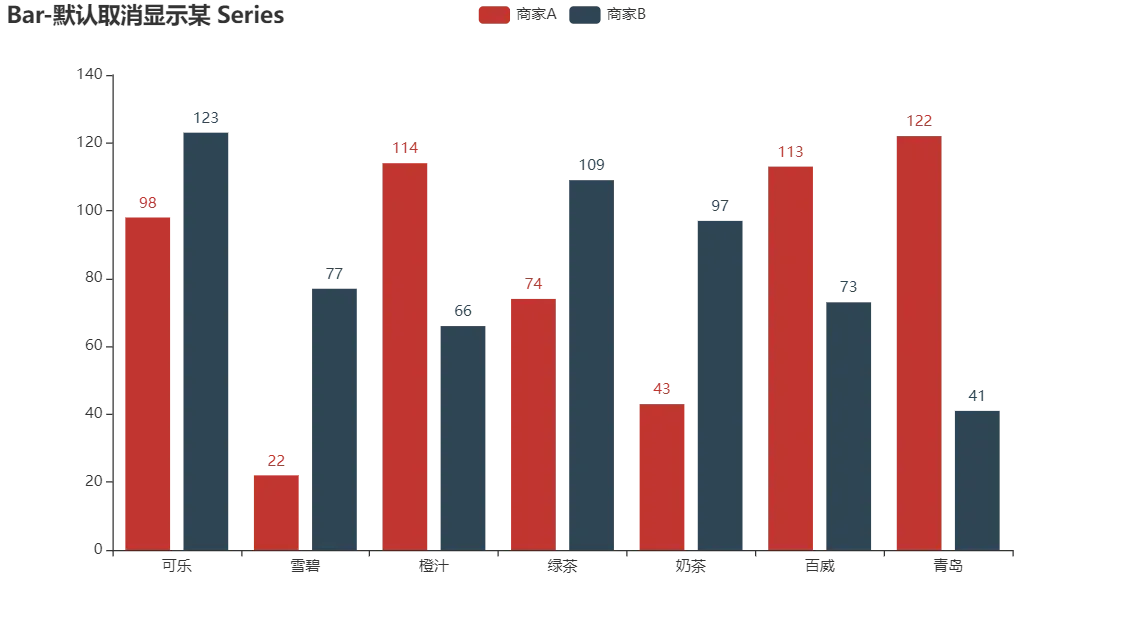
翻转 XY 轴
from pyecharts import options as opts
from pyecharts.charts import Bar
from pyecharts.faker import Faker

c = (
    Bar()
    .add_xaxis(Faker.choose())
    .add_yaxis("商家A", Faker.values())
    .add_yaxis("商家B", Faker.values())
    .reversal_axis() #翻转 XY 轴数据
    .set_series_opts(label_opts=opts.LabelOpts(position="right"))
    .set_global_opts(title_opts=opts.TitleOpts(title="Bar-翻转 XY 轴"))
#     .render("bar_reversal_axis.html")
)
c.render_notebook()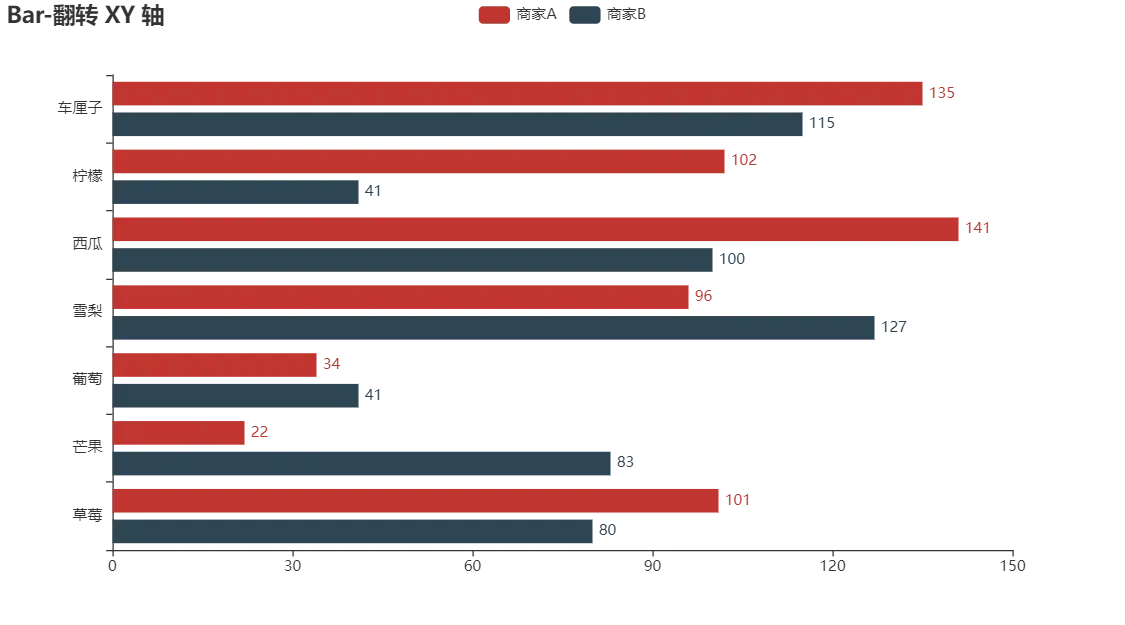
自定义标记多个点
from pyecharts import options as opts
from pyecharts.charts import Bar
from pyecharts.faker import Faker

x, y = Faker.choose(), Faker.values()
c = (
    Bar()
    .add_xaxis(x)
    .add_yaxis(
        "商家A",
        y,
        markpoint_opts=opts.MarkPointOpts(
            data=[opts.MarkPointItem(name="自定义标记点", coord=[x[2], y[2]], value=y[2]),
            opts.MarkPointItem(name="自定义标记点2", coord=[x[5], y[5]], value=y[5])]
        ),  #MarkPointItem:标记点数据项
            # coord标注的坐标。坐标格式视系列的坐标系而定,可以是直角坐标系上的 x, y,
            # 也可以是极坐标系上的 radius, angle。例如 [121, 2323]、['aa', 998]。
            # value标注值,可以不设。
    )
    .add_yaxis("商家B", Faker.values())
    .set_global_opts(title_opts=opts.TitleOpts(title="Bar-MarkPoint(自定义)"))
    .set_series_opts(label_opts=opts.LabelOpts(is_show=False))
#     .render("bar_markpoint_custom.html")
)
c.render_notebook()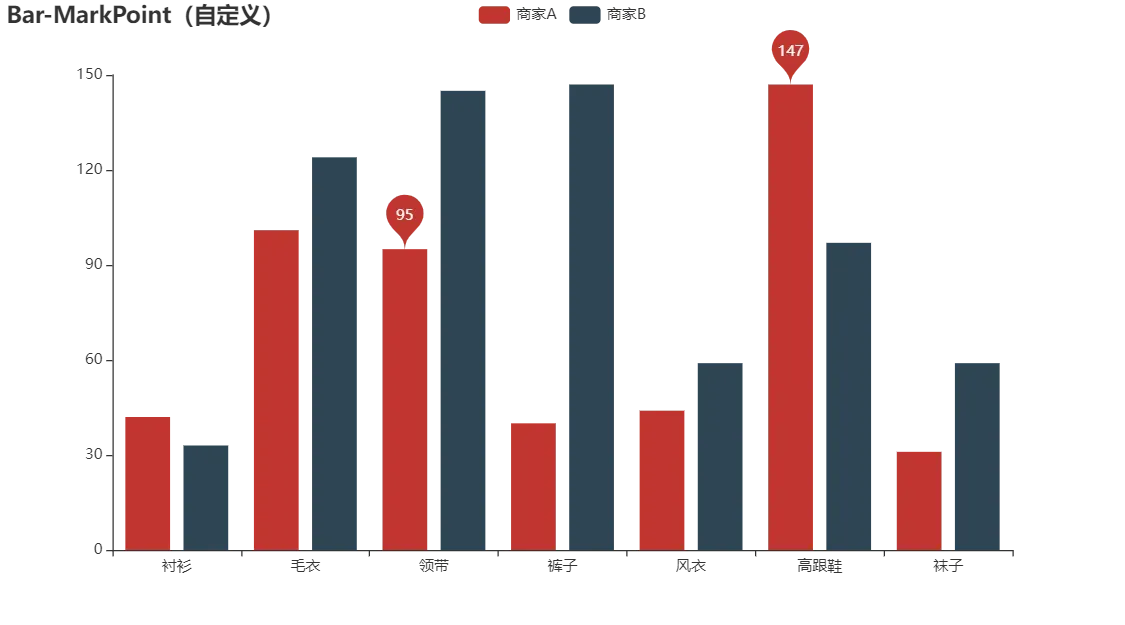
动画配置基本示例
from pyecharts import options as opts
from pyecharts.charts import Bar
from pyecharts.faker import Faker


c = (
    Bar(
        init_opts=opts.InitOpts(
            animation_opts=opts.AnimationOpts(   # animation_opts画图动画初始化配置
                animation_delay=1000, animation_easing="elasticOut"
                 # animation_delay初始动画的延迟,默认值为 0
                # animation_easing# 初始动画的缓动效果
            )
        )
    )
    .add_xaxis(Faker.choose())
    .add_yaxis("商家A", Faker.values())
    .add_yaxis("商家B", Faker.values())
    .set_global_opts(title_opts=opts.TitleOpts(title="Bar-动画配置基本示例", subtitle="我是副标题"))
#     .render("bar_base_with_animation.html")
)
c.render_notebook()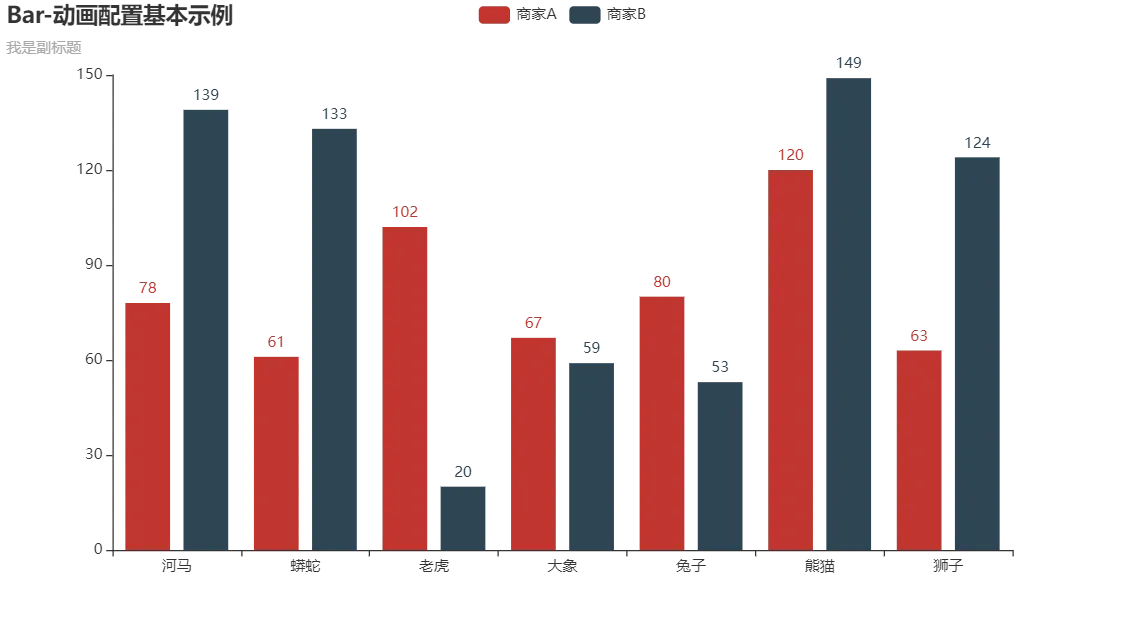
直方图
from pyecharts import options as opts
from pyecharts.charts import Bar
from pyecharts.faker import Faker

c = (
    Bar()
    .add_xaxis(Faker.choose())
    .add_yaxis("商家A", Faker.values(), category_gap=0, color=Faker.rand_color())# category_gap同一系列的柱间距离,默认为类目间距的 20%,可设固定值
    .set_global_opts(title_opts=opts.TitleOpts(title="Bar-直方图"))
#     .render("bar_histogram.html")
)
c.render_notebook()
自定义多条标记线
from pyecharts import options as opts
from pyecharts.charts import Bar
from pyecharts.faker import Faker

c = (
    Bar()
    .add_xaxis(Faker.choose())
    .add_yaxis("商家A", Faker.values())
    .add_yaxis("商家B", Faker.values())
    .set_global_opts(title_opts=opts.TitleOpts(title="Bar-MarkLine(自定义)"))
    .set_series_opts(
        label_opts=opts.LabelOpts(is_show=False),
        markline_opts=opts.MarkLineOpts(
            data=[opts.MarkLineItem(y=50, name="yAxis=50"),opts.MarkLineItem(y=30, name="yAxis=30"),]
        ),
    )
#     .render("bar_markline_custom.html")
)
c.render_notebook()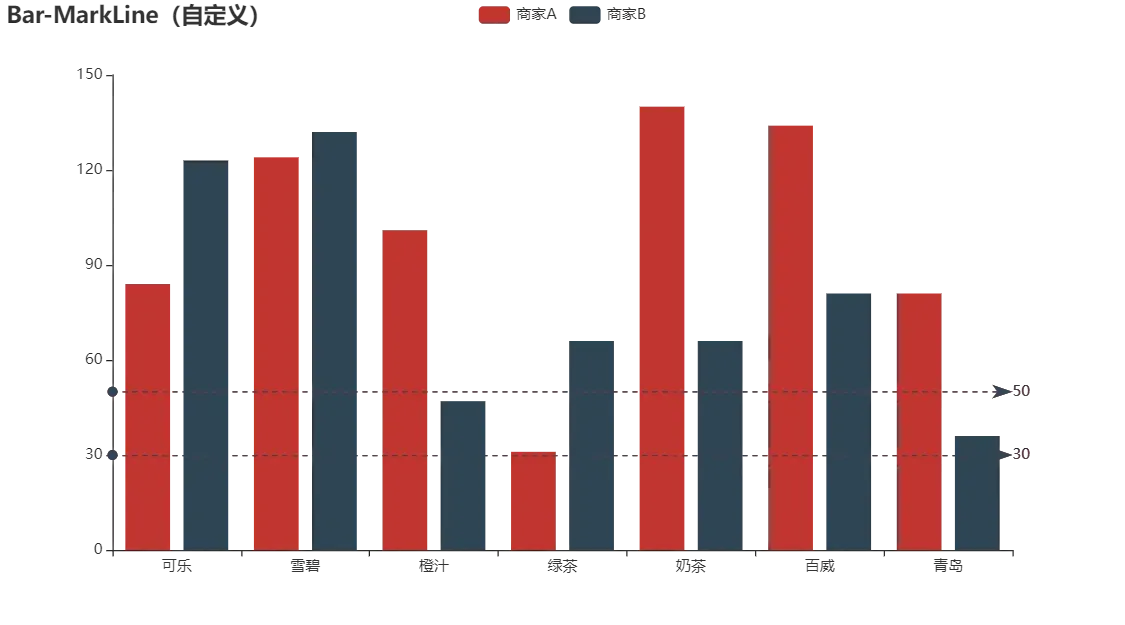
基本图表示例
from pyecharts import options as opts
from pyecharts.charts import Bar
from pyecharts.faker import Faker


c = (
    Bar()
    .add_xaxis(Faker.choose())
    .add_yaxis("商家A", Faker.values())
    .add_yaxis("商家B", Faker.values())
    .set_global_opts(title_opts=opts.TitleOpts(title="Bar-基本示例", subtitle="我是副标题"))
#     .render("bar_base.html")
)
c.render_notebook()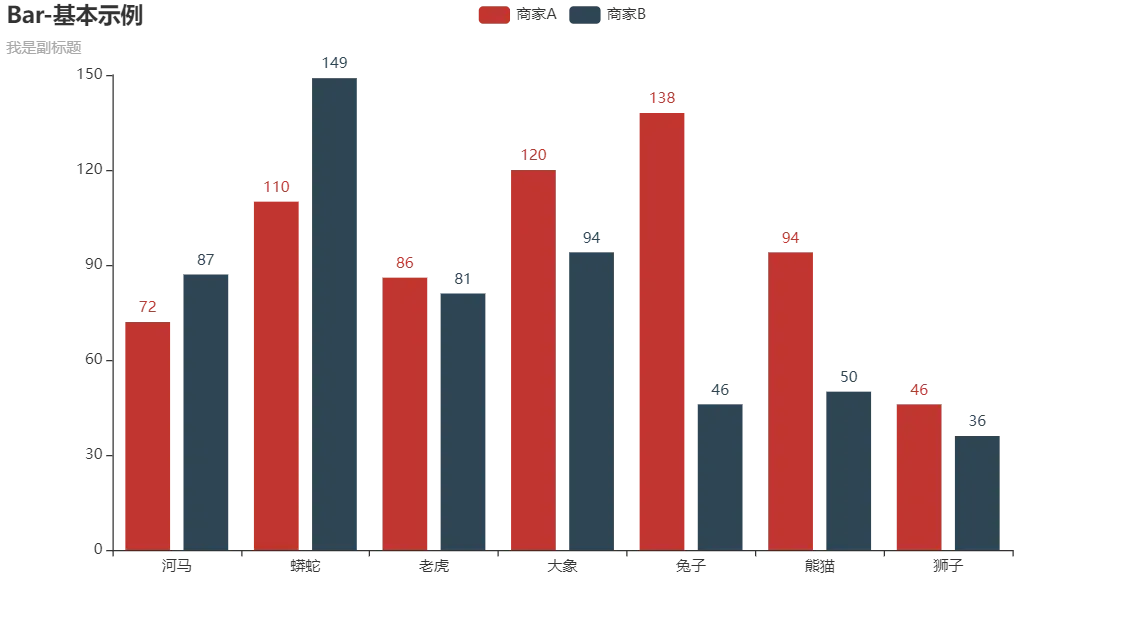
水平滑动&鼠标滚轮缩放
from pyecharts import options as opts
from pyecharts.charts import Bar
from pyecharts.faker import Faker

c = (
    Bar()
    .add_xaxis(Faker.days_attrs)
    .add_yaxis("商家A", Faker.days_values, color=Faker.rand_color())
    .set_global_opts(
        title_opts=opts.TitleOpts(title="Bar-DataZoom(slider+inside)"),
        datazoom_opts=[opts.DataZoomOpts(), opts.DataZoomOpts(type_="inside")],
    )   #DataZoomOpts默认slider
#     .render("bar_datazoom_both.html")
)
c.render_notebook()
文章出处登录后可见!
已经登录?立即刷新