个性签名:整个建筑最重要的是地基,地基不稳,地动山摇。而学技术更要扎稳基础,关注我,带你稳扎每一板块邻域的基础。
博客主页:七归的博客
收录专栏:Python三剑客之江湖云
南来的北往的,走过路过千万别错过,错过本篇,“精彩”可能与您失之交臂yo
Triple attack(三连击):Comment,Like and Collect—>Attention
自定义您的对象
- 有两种类型 Artists: primitives和container
primitives(基本元素)
- primitives 表示我们想要在画布上绘制的标准图形对象:
- 曲线Line2D
- 矩形Rectangle
- 文字Text
- 图像AxesImage
container(容器)
-
container(容器)是放置它们的地方
- 坐标轴Axis,
- 坐标系Axes
- 和图形 Figure
-
这标准用途是创建一个 Figure,例如,使用 这 Figure创建一个或多个 Axes或者 Subplot实例,并使用 Axes实例 辅助方法来创建primitives。
对象容器
Figure容器(图容器)
- 顶级容器 Artist是个 matplotlib.figure.Figure, 它包含了 数字。 该图的背景是 Rectangle,它存储在 Figure.patch.
- 当你添加子图( add_subplot()) 和 轴( add_axes()) 到图时,这些将附加到 Figure.axes.
- 创建它们的方法如下:
fig = plt.figure()
ax1 = fig.add_subplot(211)	# 作一幅2*1的图,选择第1个子图
ax2 = fig.add_axes([0.1, 0.1, 0.7, 0.3])	# 位置参数,四个数分别代表了(left,bottom,width,height)
ax1
print(fig.axes)		# fig.axes 中包含了subplot和axes两个实例
- 输出结果以及图像:
AxesSubplot:
[AxesSubplot:, <matplotlib.axes._axes.Axes object at 0x7f0768702be0>]
- 因为该图保持了“current axes(当前轴)”的概念来支持 pylab/pyplot 状态
- 所以不应该直接从轴列表中插入或移除 Axes ,而是使用 add_subplot()和 add_axes()插入方法和 Axes.remove或 Figure.delaxes() 删除方法。
- 但是,可以遍历 Axes 列表或对其进行索引以访问 Axes自定义的实例。
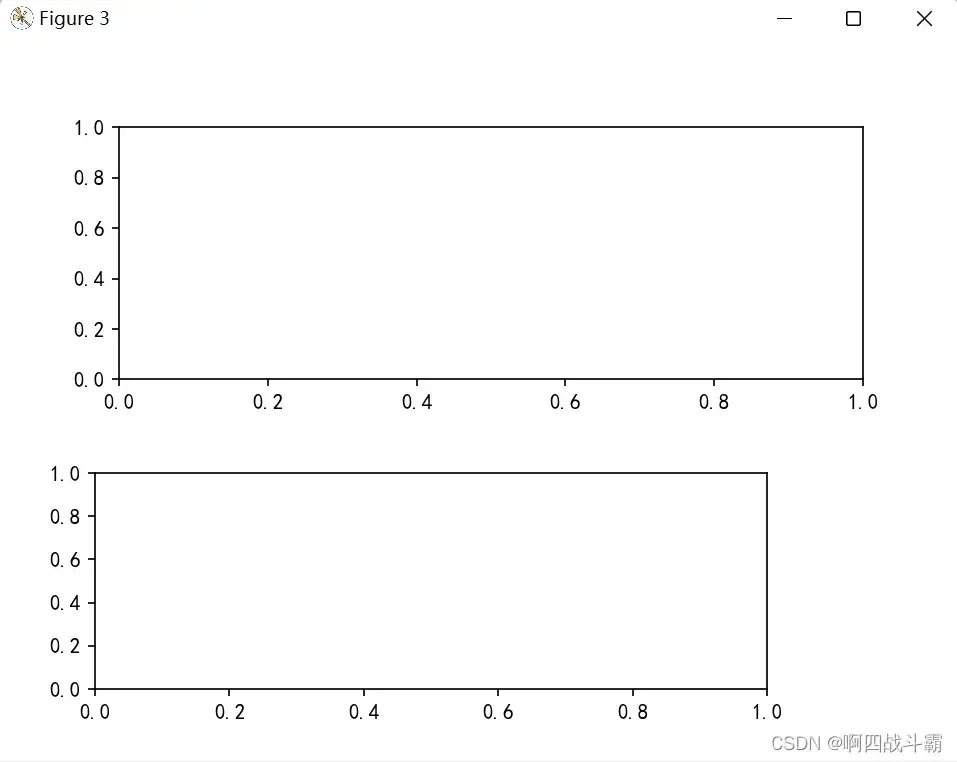
- 这是一个添加轴网格的示例:
for ax in fig.axes:
    ax.grid(True)
- 输出图像:
- 图也有自己的 images, lines, patches和 text属性,你可以使用这些属性直接添加基本元素。
- 但这样做时, 默认坐标系 Figure将只是以像素为单位(其中 通常不是你想要的)。
- 如果你改为使用图形级方法添加 Artists(例如,使用 Figure.text添加文本),然后默认坐标系将是“figure坐标系”,其中 (0, 0) 是图的左下角和 (1, 1) 是图的右上角。
- 和所有的Artists一样,你可以通过设置来控制这个坐标系 变换属性。
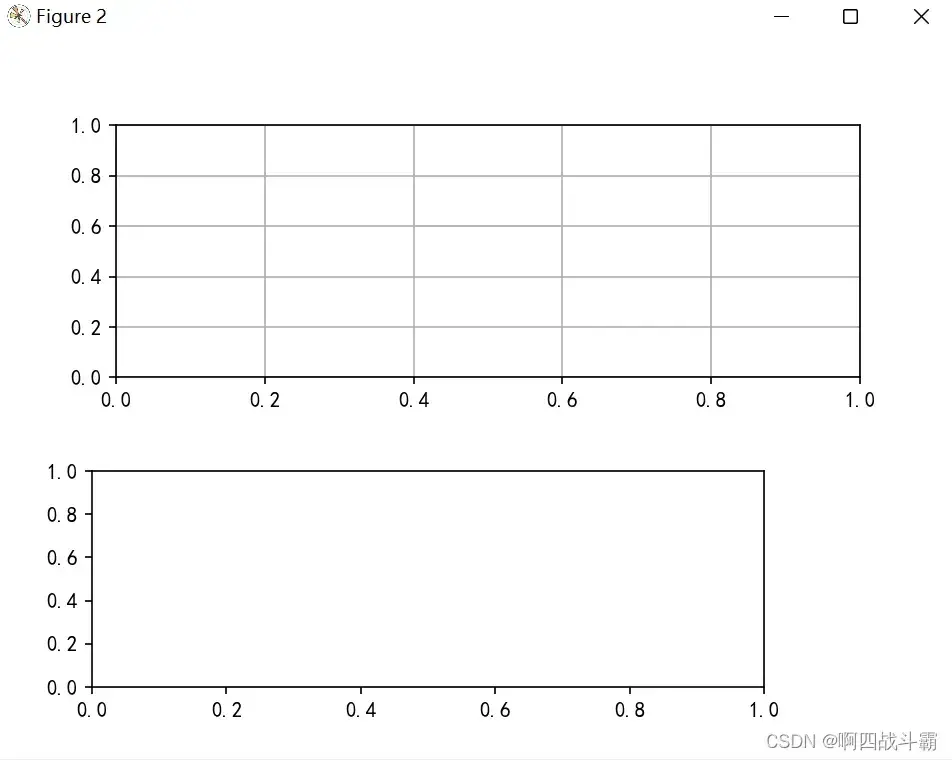
- 你可以通过以下方式明确使用“figure坐标” 设置 Artist转换为 fig.transFigure:
import matplotlib.lines as lines

fig = plt.figure()
l1 = lines.Line2D([0, 1], [0, 1], transform=fig.transFigure, figure=fig)
l2 = lines.Line2D([0, 1], [1, 0], transform=fig.transFigure, figure=fig)
fig.lines.extend([l1, l2])
plt.show()
-
输出图像:
-
Figure属性:
- axes——轴实例列表(包括 Subplot)
- patch——矩形背景
- images——FigureImages patch列表–用于原始像素显示
- legends——图例实例列表(不同于 Axes.legends)
- texts——文本实例列表
Axes容器(轴容器)
- 这 matplotlib.axes.Axes是 Matplotlib 的中心 宇宙
- 它包含了绝大多数 用于绘图的Artists
- 并具有许多辅助方法在图中创建和添加这些 Artists到它自己
- 以及访问和修改的辅助方法 自定义 Artists。
- 像 Figure,它包含一个 Patch。对于笛卡尔坐标系,patch是一个 Rectangle;对于极坐标,patch是一个Circle
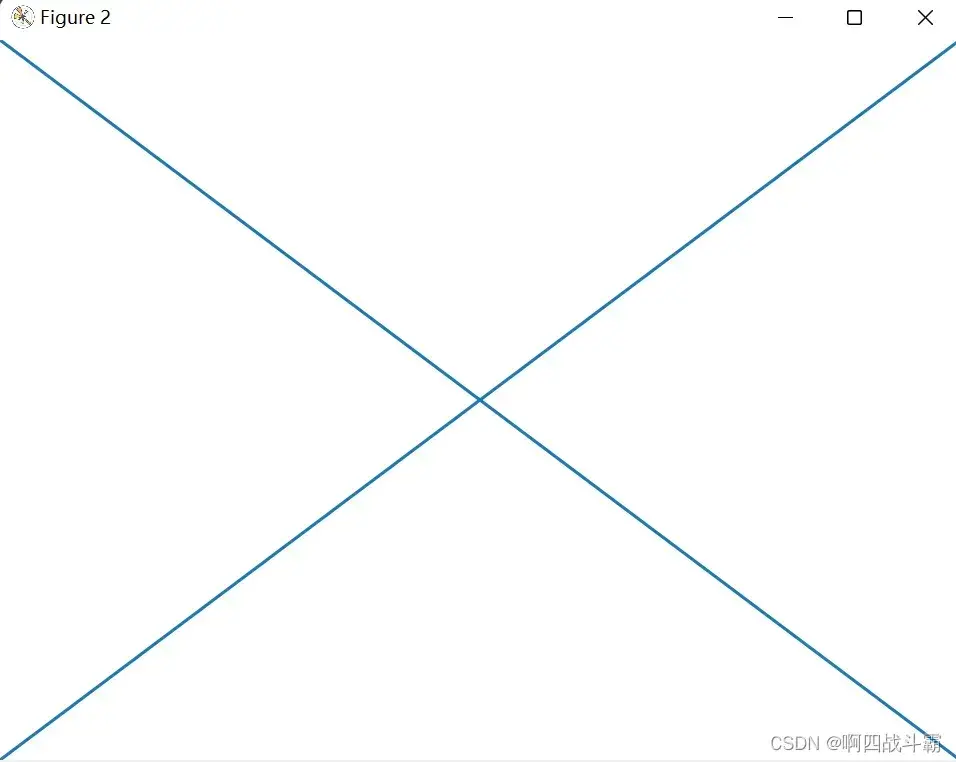
- 这个 patch 属性确定绘图区域的形状、背景和边框:
ax = fig.add_subplot()
rect = ax.patch  # 矩形实例
rect.set_facecolor('green')
-
输出图像:
-
Axes容器是用来创建具体的图形的。比如画曲线,柱状图,都是画在上面。所以使用plt.xx绘制各种图形(比如条形图,直方图,散点图等)都是对Axes的封装。
-
不应将对象直接添加到 Axes.lines或者 Axes.patches 列表,因为 Axes创建和添加时需要做一些事情 或一个东西:
它设置 Artist中 figure和 axes的属性
它设置默认 Axes转换(除非已经设置);
它检查包含在 Artist更新数据结构控制自动缩放,以便视图限制可以调整以包含绘制的数据。 -
但是,可以自己创建对象并使用辅助方法将它们直接添加到 Axes,例如 add_line和 add_patch.
-
还有很多很多 Axes用于创建 primitives 的辅助方法, Artists并将它们添加到各自的容器中。
-
Axes属性:
- 设置x和y轴的最大值与最小值
- 设置完刻度后,我们还可以设置x轴和y轴的最大值和最小值。可以通过set_xlim/set_ylim来实现
- 添加文本
- 之前添加文本我们用的是annotate,但是如果不是需要做注释
- 其实还有另外一种更加简单的方式,那就是使用text方法
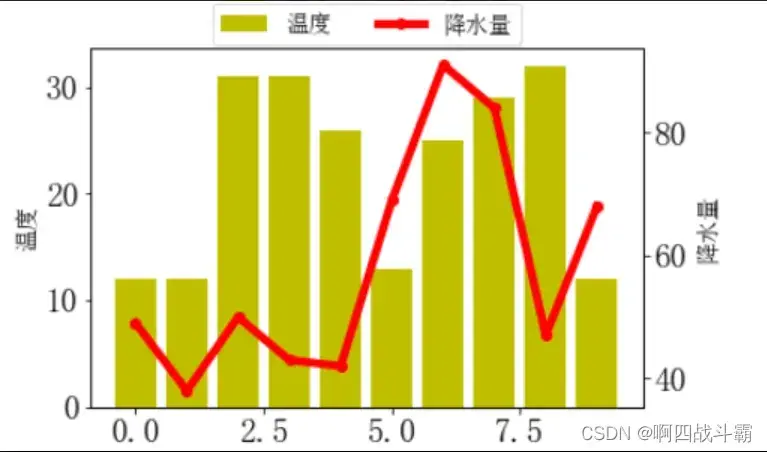
- 绘制双y轴
- 绘制图1为: ax1
- 通过 ax2 = ax1.twinx() 克隆 ax1,以此添加次坐标轴
- 绘制图2为: ax2
- 另外需要注意的是,twinx或者twiny方法会返回一个共享x轴或者y轴的新的axes,如果通过plt.sublots生成ax后,再绘制图2时,需要 在这个新生成的ax上绘图
- 设置x和y轴的最大值与最小值
-
另外Axes还包含两个最重要的Artist container:
- ax.xaxis:XAxis对象的实例,用于处理x轴tick以及label的绘制
- ax.yaxis:YAxis对象的实例,用于处理y轴tick以及label的绘制
Axis容器(轴容器)
-
这 matplotlib.axis.Axis实例处理 刻度线、网格线、刻度标签和轴标签。
- 你可以为y轴分别配置左右刻度,以及 x 轴的上下刻度。
- 这 Axis还存储用于自动缩放、平移以及缩放的data_interval和view_interval
- 以及 Locator和 Formatter控制位置的实例和刻度线的放置
-
Axis代表的是x轴或者y轴的对象。包含Tick(刻度)对象,TickLabel刻度文本对象,以及AxisLabel坐标轴文本对象。
-
axis对象有一些方法可以操作刻度和文本等。
-
Axis属性:
- 设置x轴和y轴label的位置
- ax1.yaxis.set_label_coords(x,y)
- 设置刻度上的刻度格式
- 显示子刻度
- ax1.minorticks_on()
- 设置x轴和y轴label的位置
# 设置刻度上的刻度格式
from matplotlib import ticker

formatter = ticker.FormatStrFormatter("自定义格式")
ax1.yaxis.set_major_formatter(formatter)
Tick容器(刻度容器)
- 这 matplotlib.axis.Tick是我们的最终容器对象 从 Figure到 Axes到 Axis 到 Tick中最末端的对象容器。
- 这 Tick包含刻度 和网格线实例,以及对应的标签实例。 这些中的每一个都可以作为属性直接访问 Tick的
- Tick属性:
- Tick.tick1line:Line2D实例
- Tick.tick2line:Line2D实例
- Tick.gridline:Line2D实例
- Tick.label1:Text实例
- Tick.label2:Text实例
- y轴分为左右两个,因此tick1对应左侧的轴;tick2对应右侧的轴。
- x轴分为上下两个,因此tick1对应下侧的轴;tick2对应上侧的轴。
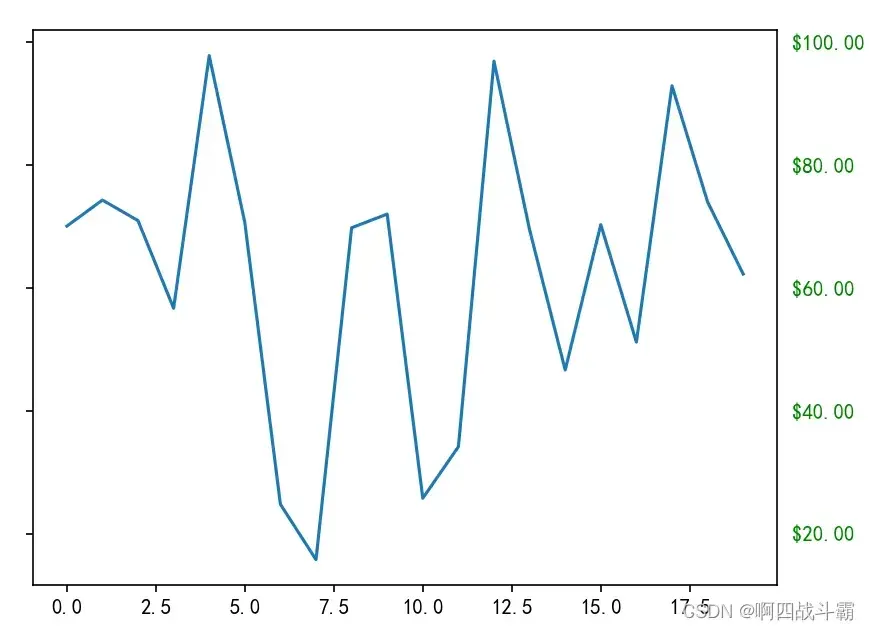
- 这是一个为右侧刻度设置格式化程序的示例
- 美元符号在 y 轴的右侧并将它们涂成绿色。
import numpy as np
import matplotlib.pyplot as plt

# 固定随机状态以实现再现性
np.random.seed(19680801)

fig, ax = plt.subplots()
ax.plot(100*np.random.rand(20))
# 设置ticker的显示格式
ax.yaxis.set_major_formatter('${x:1.2f}')
# 设置ticker的参数,右侧为主轴,颜色为绿色
ax.yaxis.set_tick_params(which='major', labelcolor='green',
                         labelleft=False, labelright=True)

plt.show()
- 输出图像:
文章出处登录后可见!