如何保持 pyplot 轴仅根据一个图缩放而不扩展到其他图?
python 190
原文标题 :How to keep the pyplot axis scaled according to one plot only and not extending for other plots?
我想在一个图中绘制多个函数,但是如果绘制的一个函数的值比其他函数高/小得多,我想防止轴被扩展。在下面的代码中,参数alpha实际上是随机的(这里我固定它到alpha = 2),并且可能会得到非常高的值,这会弄乱我的情节。基本上我想做的是,我想绘制一个函数,然后根据它的xlim和ylim冻结轴,然后添加剩余的如果alpha碰巧很大,则绘图不再延长轴。我该怎么做?不幸的是,解决方案对我不起作用,即使用plt.autoscale(False)我需要手动修复限制,这不是我想要的。
这是一个最小的工作示例:
x = np.linspace(0,4*np.pi)
data1 = np.sin(0.5*x)
alpha = 2
data2 = alpha*np.sin(x)
data3 = np.sin(x)
data4 = np.sin(x)
data5 = np.cos(x)

fig = plt.figure(constrained_layout=True, figsize=(10, 4))
subfigs = fig.subfigures(1, 2, wspace=0.07)


axsLeft = subfigs[0].subplots(1, 1)
axsLeft.plot(x,data1)
# plt.autoscale(False)
axsLeft.plot(x,data2) #final prediction
axsLeft.plot(x,data3,'--k',linewidth=2.5)
# axsLeft.set_ylim([-1.05,+1.05])
axsLeft.set_xlabel("x")


axsRight = subfigs[1].subplots(2, 1, sharex=True)
axsRight[0].plot(data4)
axsRight[1].plot(data5)
axsRight[1].set_xlabel('x')

fig.show()
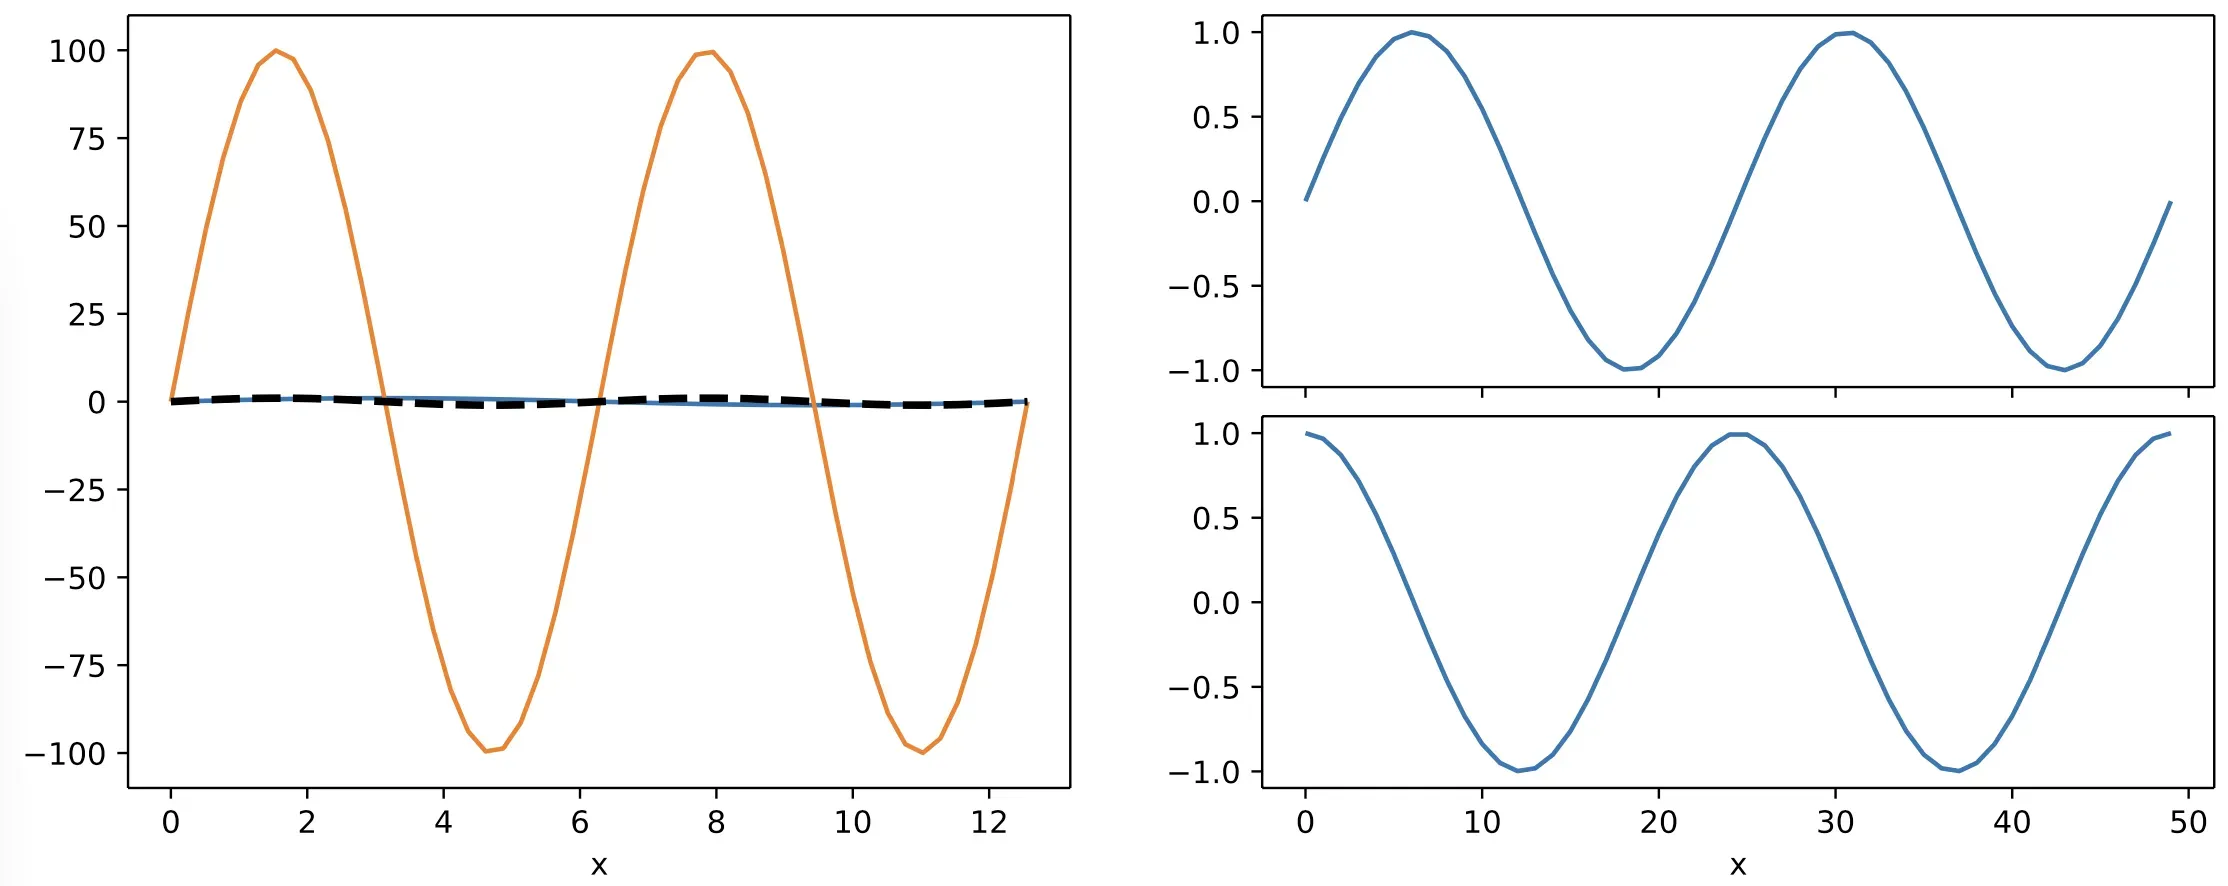 这个橙色图扩展了轴,使得其他图不再可解释。我希望橙色图在 y 方向上过冲,如下所示:
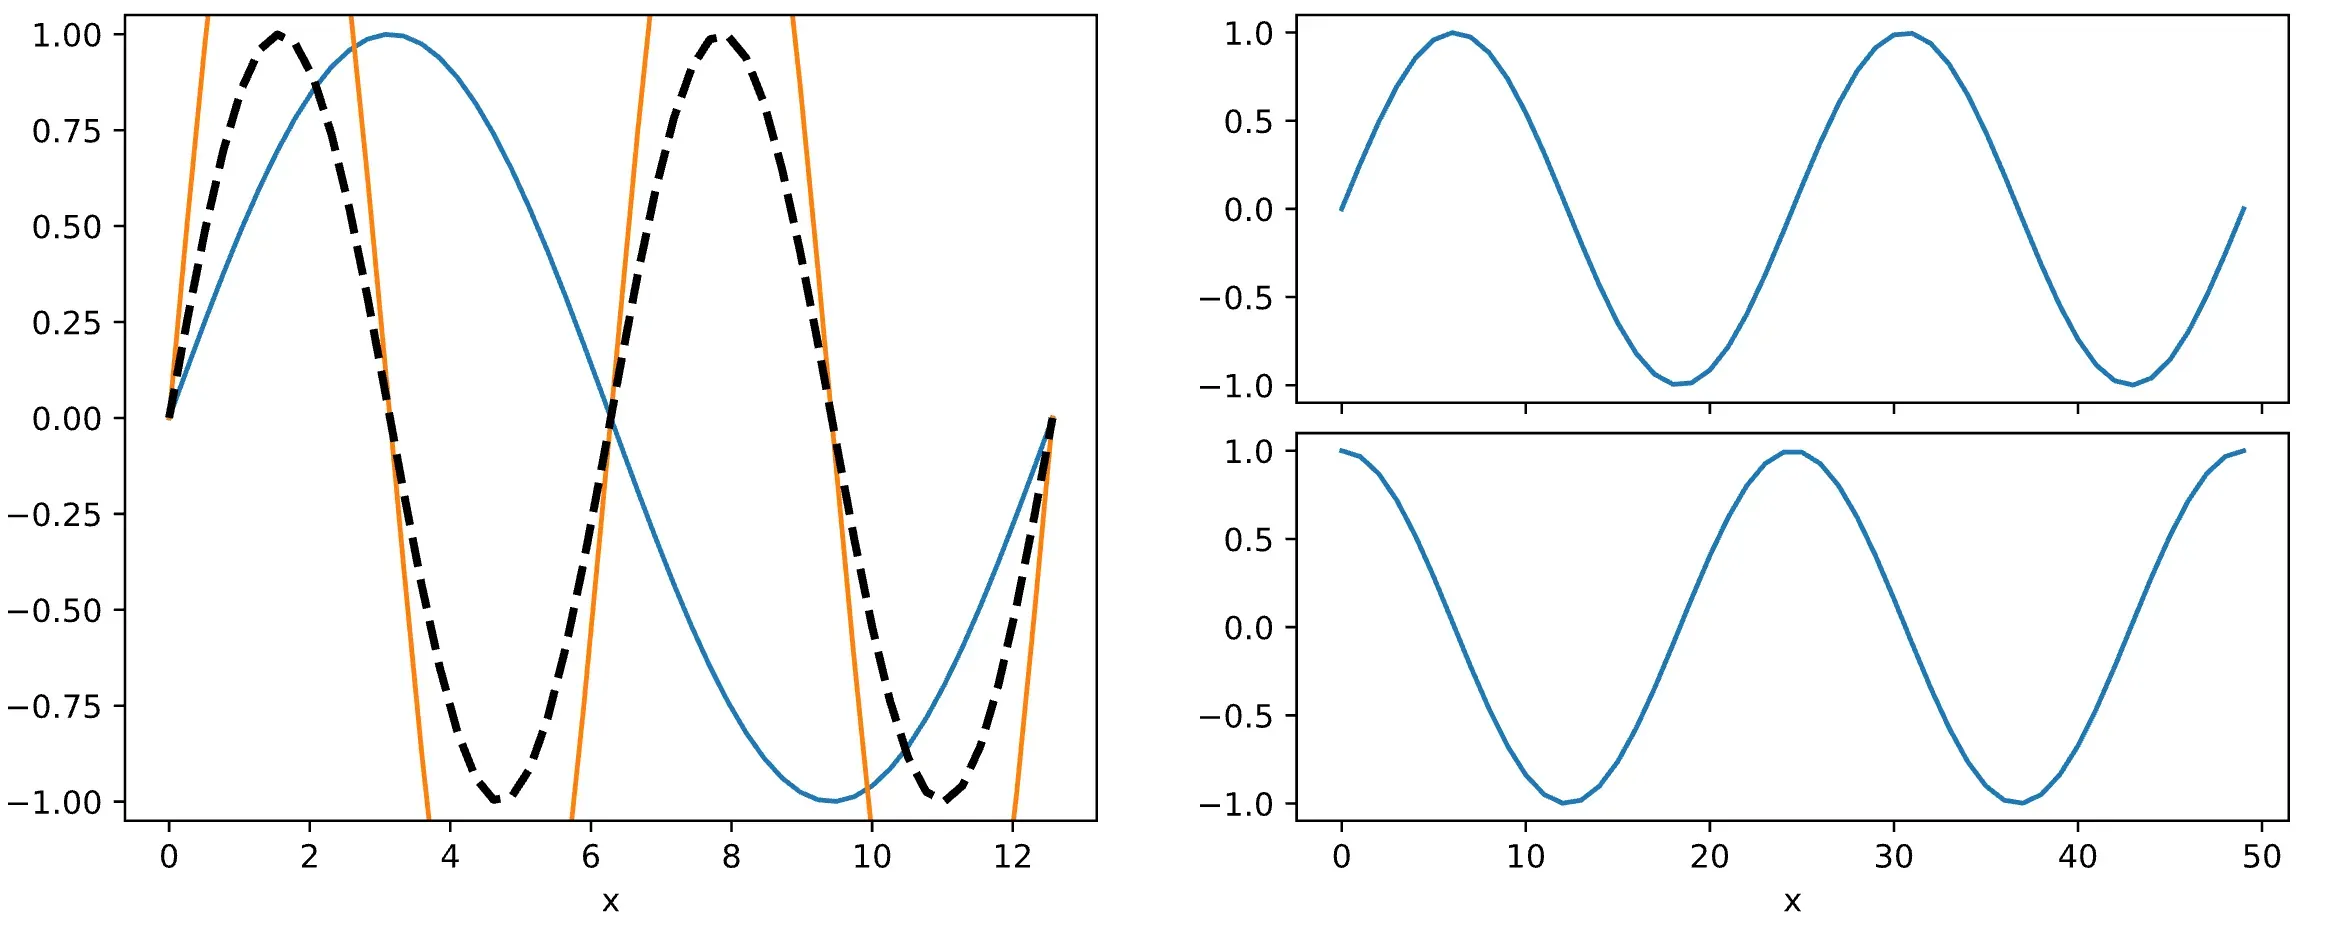 但无需手动设置
ylim。
回复
我来回复-
 Desty 评论
如果要调整y轴为data1的最大值和最小值,使用下面的代码。(0.05为padding。)
axsLeft.set_ylim(np.min(data1) - 0.05, np.max(data1) + 0.05)如果你想让alpha值也根据data1变化,你可以通过np.max()和np.min()减去alpha值得到值。下面是你上传的代码的修改版本。
import numpy as np import matplotlib.pyplot as plt x = np.linspace(0,4*np.pi) data1 = np.sin(0.5*x) alpha = np.max(data1) - np.min(data1) # change 1 data2 = alpha*np.sin(x) data3 = np.sin(x) data4 = np.sin(x) data5 = np.cos(x) fig = plt.figure(constrained_layout=True, figsize=(10, 4)) subfigs = fig.subfigures(1, 2, wspace=0.07) axsLeft = subfigs[0].subplots(1, 1) axsLeft.plot(x,data1) axsLeft.plot(x,data2) #final prediction axsLeft.plot(x,data3,'--k',linewidth=2.5) axsLeft.set_xlabel("x") axsRight = subfigs[1].subplots(2, 1, sharex=True) axsRight[0].plot(data4) axsRight[1].plot(data5) axsLeft.set_ylim(-alpha / 2 - 0.05, alpha / 2 + 0.05) # change 2 axsRight[1].set_xlabel('x') plt.show()2年前