一、问题提出
我有这样一串代码:
import matplotlib.pyplot as plt
plt.figure(figsize = (10, 6))
"
此处省略代码
"
legend.append("J")
plt.legend(legend)
plt.xlabel('recall')
plt.ylabel('precision')
plt.grid()
plt.show()
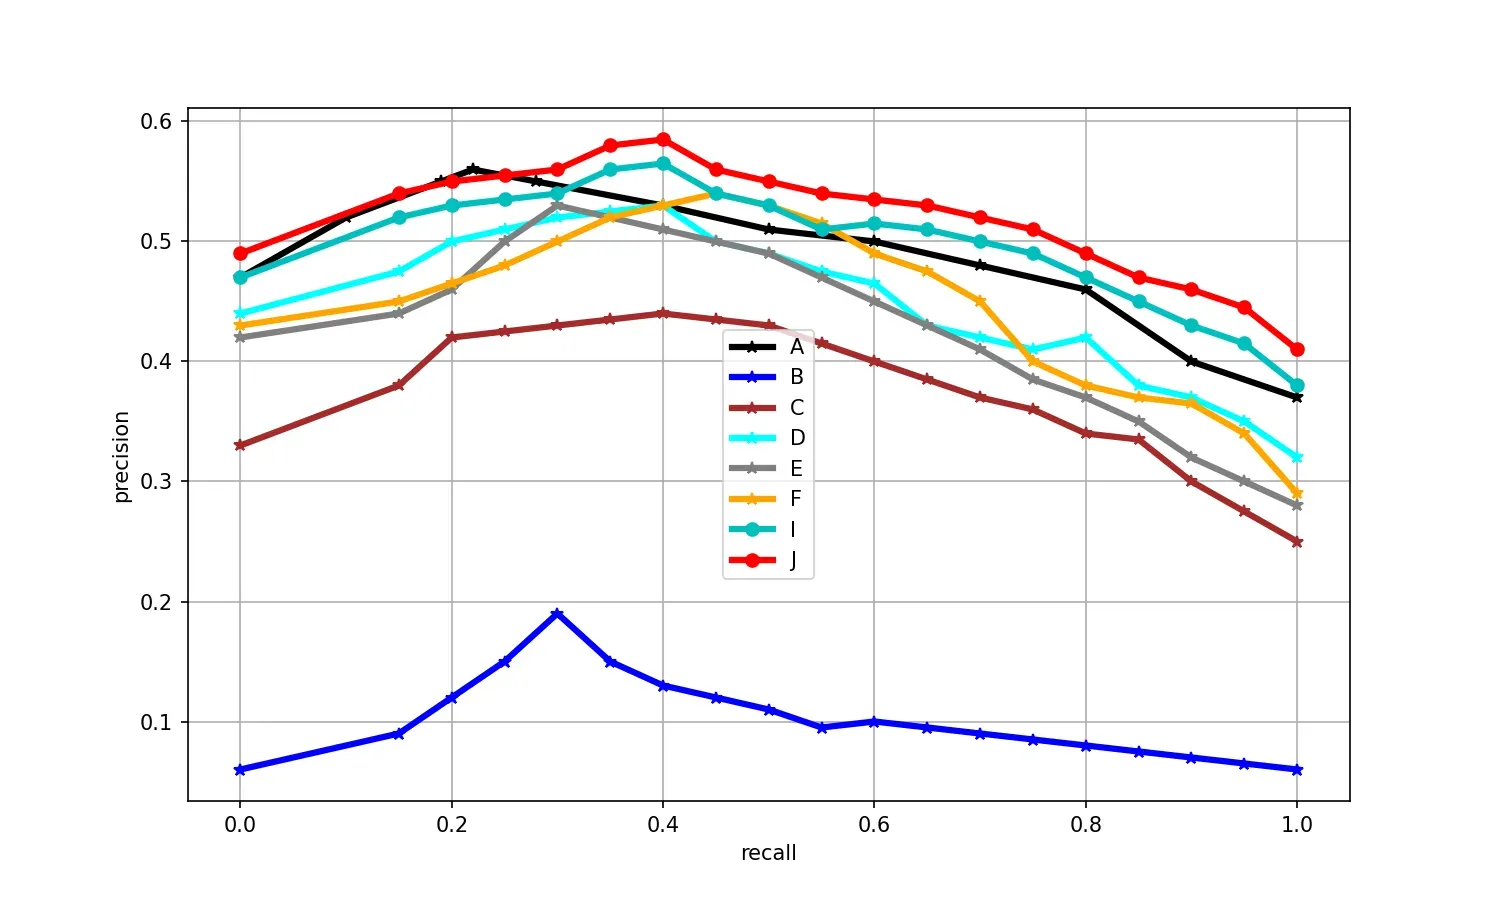
我们得到的图像为:
二、尝试美化
2.1 改变legend的位置
plt.legend(loc='lower right', fontsize=12, frameon=True, fancybox=True, framealpha=0.2, borderpad=0.3,
           ncol=1, markerfirst=True, markerscale=1, numpoints=1, handlelength=3.5)
loc:图例位置,可取(‘best’, ‘upper right’, ‘upper left’, ‘lower left’, ‘lower right’, ‘right’, ‘center left’, ‘center , right’, ‘lower center’, ‘upper center’, ‘center’) ;若是使用了bbox_to_anchor,则这项就无效了;
fontsize:int或float或{‘xx-small’, ‘x-small’, ‘small’, ‘medium’, ‘large’, ‘x-large’, ‘xx-large’},字体大小;
frameon:是否显示图例边框;
ncol: 图例的列的数量,默认为1;
title: 为图例添加标题;
shadow: 是否为图例边框添加阴影;
markerfirst: True表示图例标签在句柄右侧,false反之;
markerscale: 图例标记为原图标记中的多少倍大小;
numpoints: 表示图例中的句柄上的标记点的个数,一般设为1;
fancybox: 是否将图例框的边角设为圆形;
framealpha: 控制图例框的透明度;
borderpad: 图例框内边距;
labelspacing: 图例中条目之间的距离;
handlelength: 图例句柄的长度;
bbox_to_anchor: (横向看右,纵向看下),如果要自定义图例位置或者将图例画在坐标外边,用它,比如bbox_to_anchor=(1.4, 0.8),这个一般配合着ax.get_position(),set_position([box.x0, box.y0, box.width*0.8 , box.height])使用;
用不到的参数可以直接去掉,有的参数没写进去,用得到的话加进去 , bbox_to_anchor=(1.11, 0)
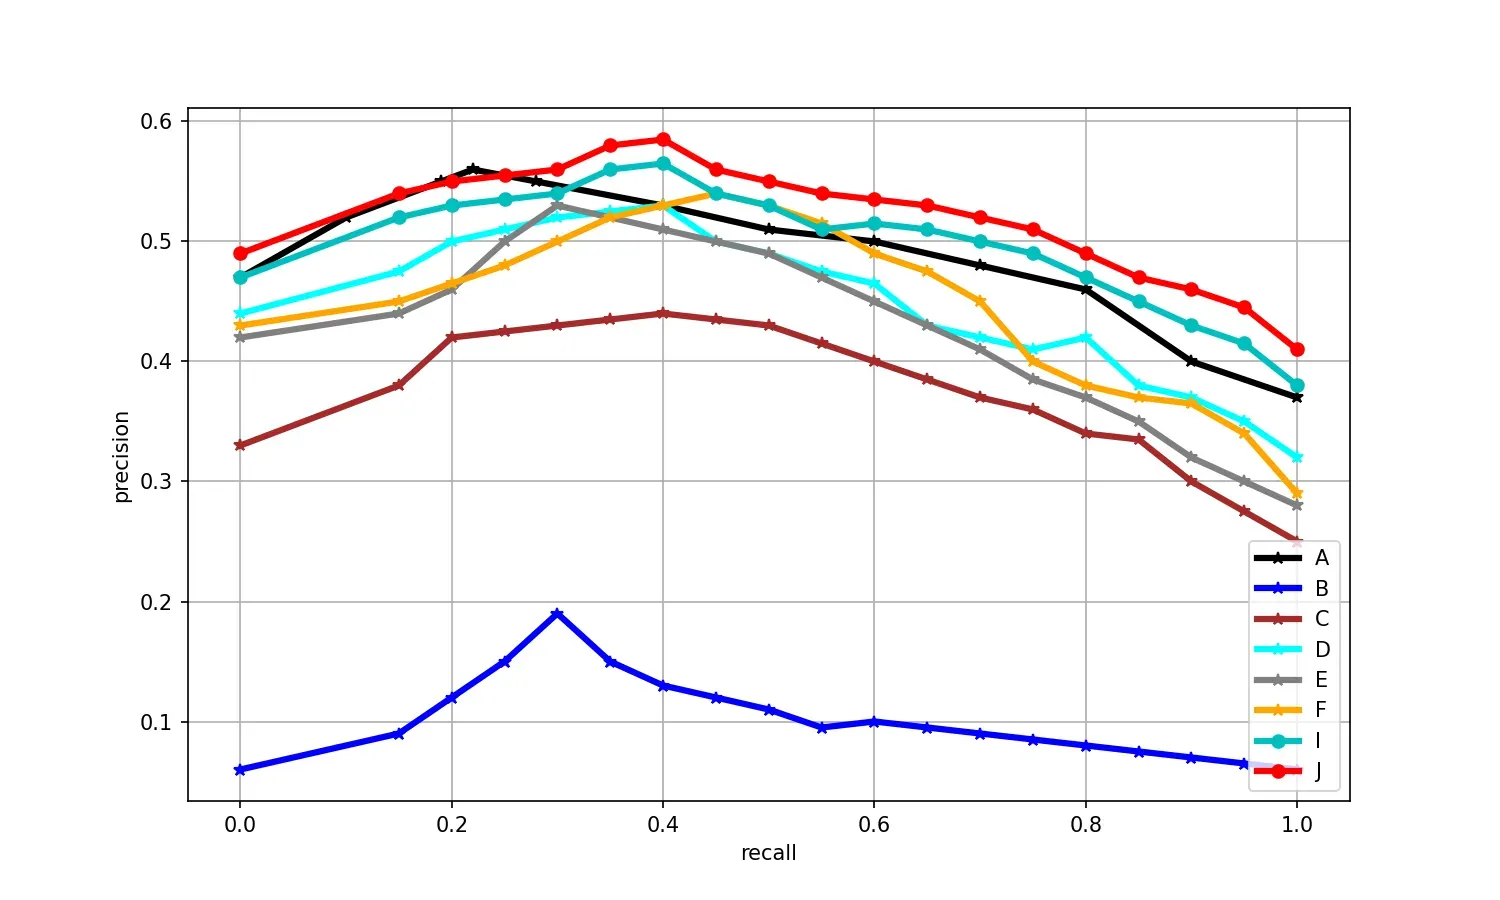
例如,我这里只改loc参数:
plt.legend(legend, loc = 'lower right')
2.2 matplotlib设置图片边缘距离
import matplotlib.pyplot as plt
plt.figure(figsize = (10, 6))
plt.subplots_adjust(left = 0.1, right = 0.7, top = 0.9, bottom = 0.1)
legend = []
我们得到的结果如下图所示:
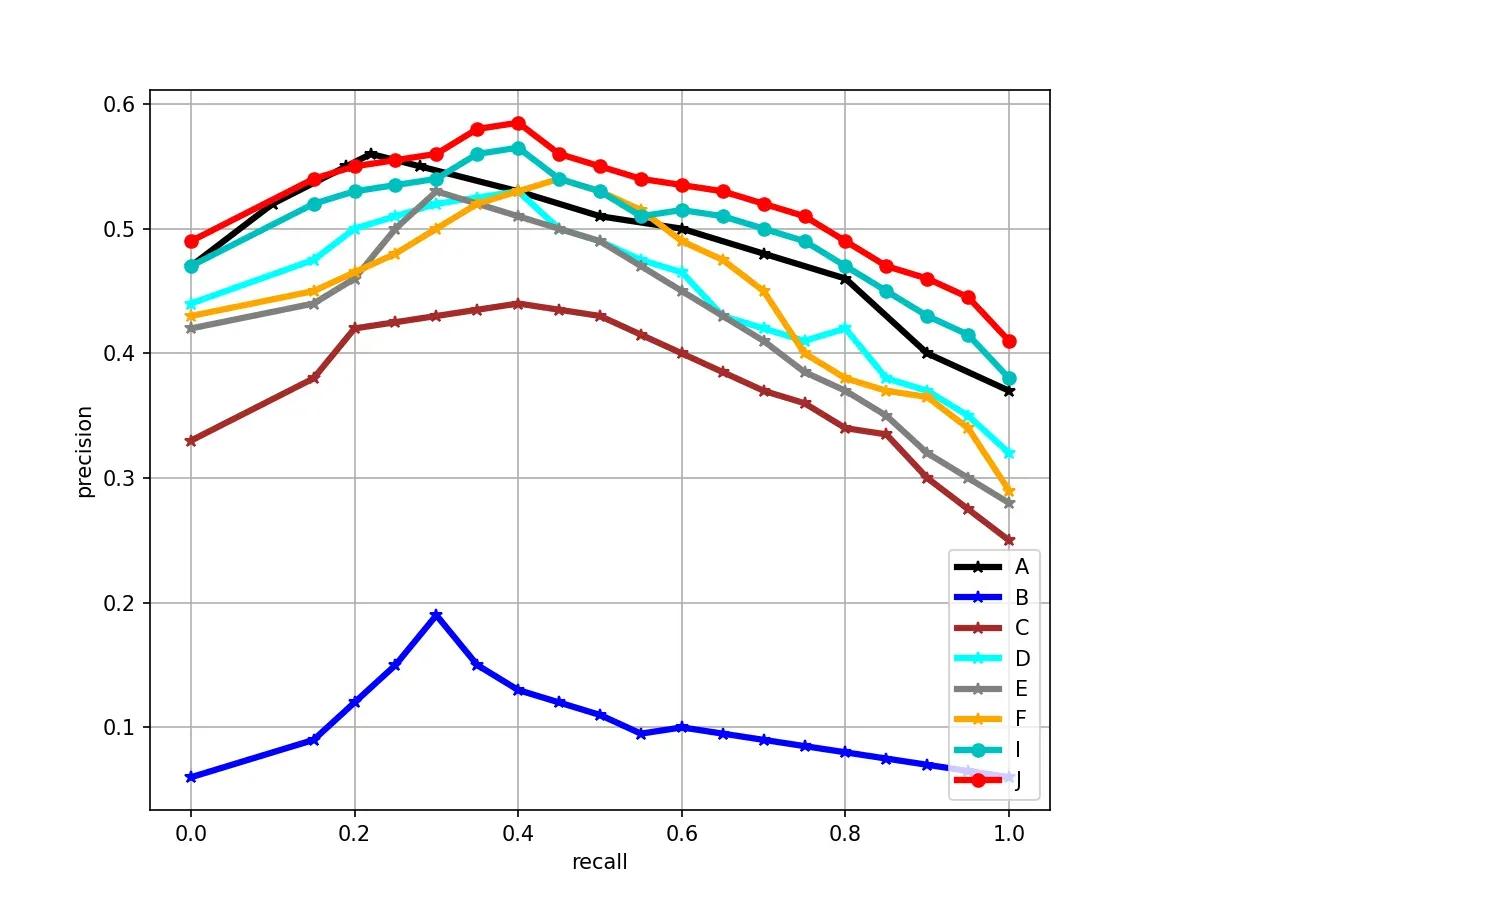
可以很明显的看到,右边有很大的空白出来!
2.3 plt.lengend图例放在图像的外侧
num1 = 1.121
num2 = 1.0
num3 = 0
num4 = 0.1
plt.legend(legend, bbox_to_anchor = (num1, num2), loc = num3, borderaxespad = num4)
plt.xlabel('recall')
plt.ylabel('precision')
plt.grid()
plt.show()
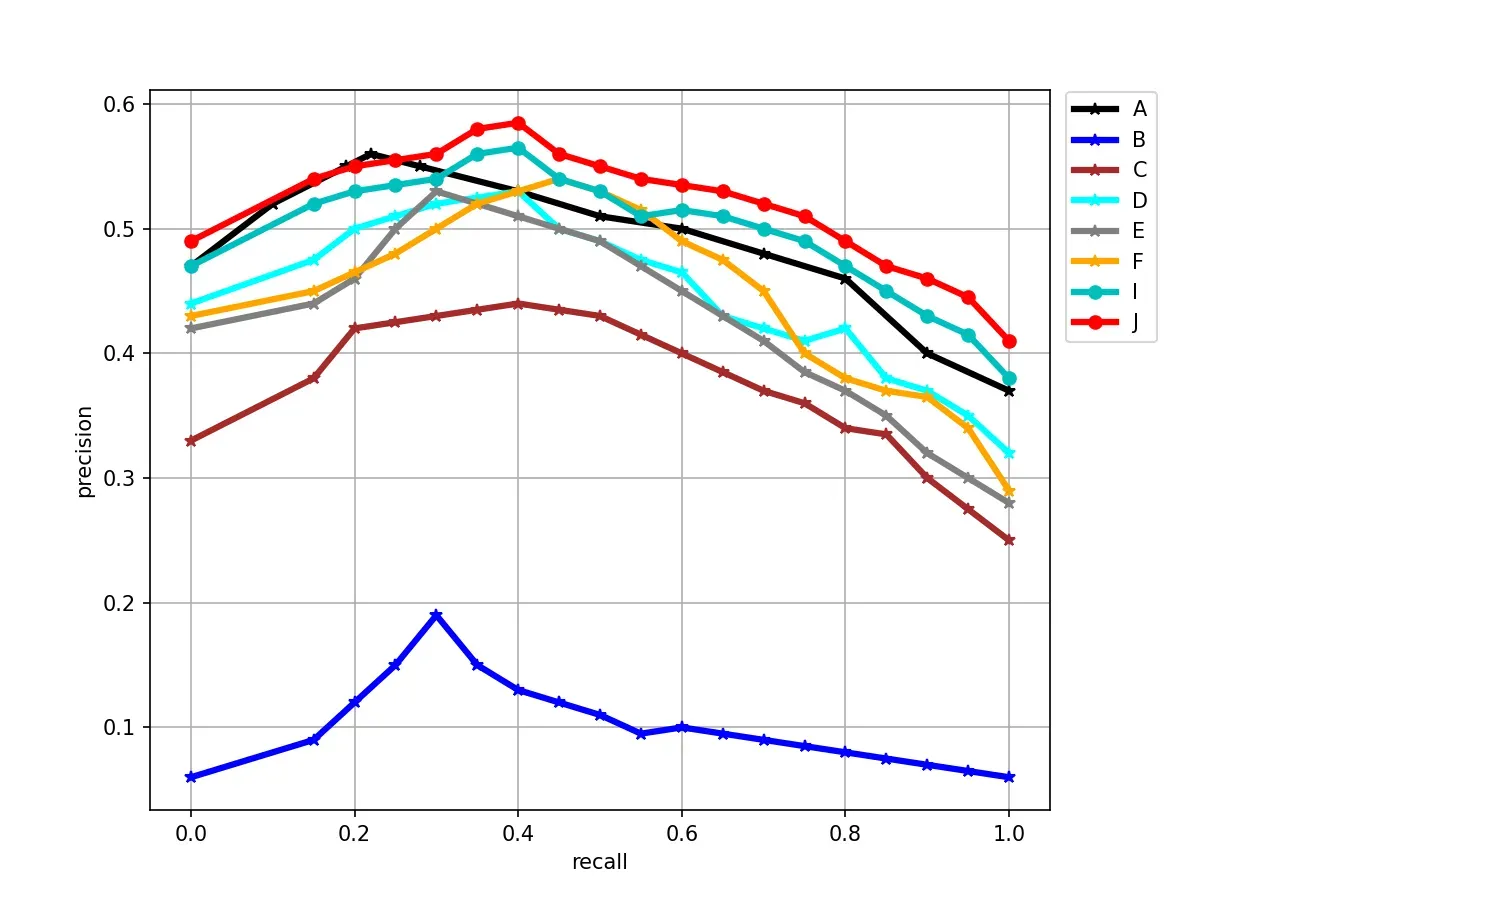
最后大家再继续微调即可!
说明:bbox_to_anchor被赋予的二元组中,num1用于控制legend的左右移动,值越大越向右边移动,num2用于控制legend的上下移动,值越大,越向上移动。用于微调图例的位置。
num1表示水平位置,num2表示垂直位置。
文章出处登录后可见!