目录
- 1.1 plt.figure()函数语法介绍
- 1.2 figure实例
- 2.1 subplot函数及其语法说明
- 2.2 用subplot画多个子图
- 3.1 subplots函数介绍
- 4.1 使用add_axes函数绘制图中图
1.1 plt.figure()函数语法介绍
figure(num=None, figsize=None, dpi=None, facecolor=None, edgecolor=None, frameon=True)
1、num:图像编号或名称,数字为编号 ,字符串为名称
2、figsize:指定figure的宽和高,单位为英寸;
3、dpi参数指定绘图对象的分辨率,即每英寸多少个像素;
4、facecolor:背景颜色;
5、edgecolor:边框颜色;
6、frameon:是否显示边框。
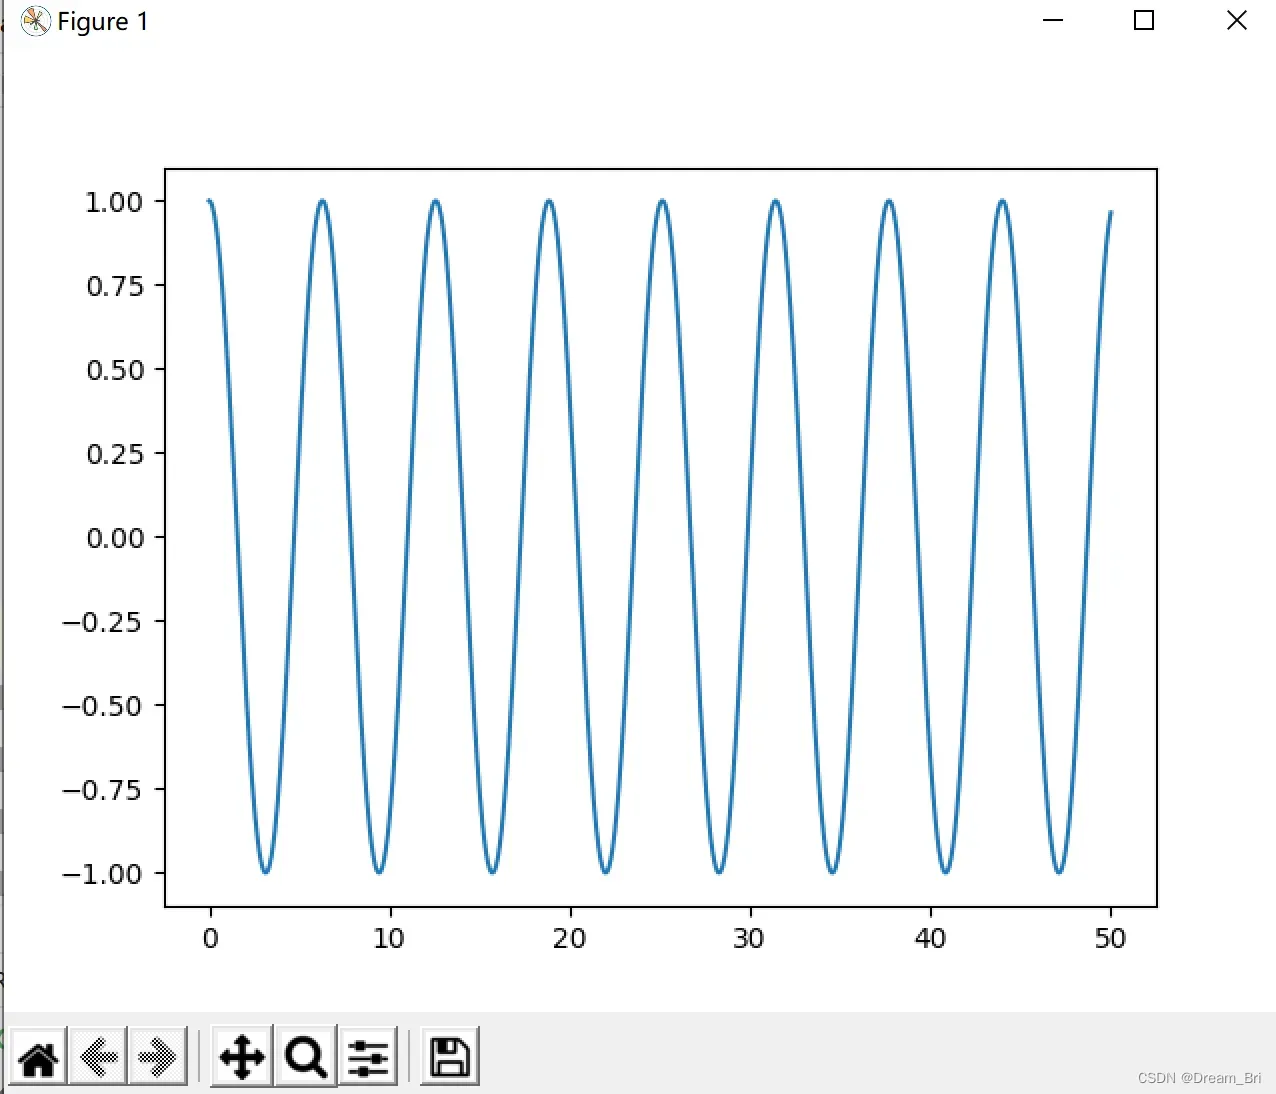
figure函数就相当于画画所用的画布,在此简单描绘一个曲线来说明
1.2 figure实例
import matplotlib.pyplot as plt
import numpy as np
#np.linspace(start, stop, num)num是起点终点间隔总点数
x = np.linspace(0, 50, 1000)
y = np.cos(x)
fig = plt.figure()
plt.plot(x, y)
# plt.show()的作用就是将画布及其所画内容显示出来
plt.show()
结果显示:
关于linespace的语法说明:
np.linspace(start, stop, num, endpoint, retstep, dtype)
1、star和stop为起始和终止位置,均为标量
2、num为包括start和stop的间隔点总数,默认为50
3、endpoint为bool值,为False时将会去掉最后一个点计算间隔
4、restep为bool值,为True时会同时返回数据列表和间隔值
5、dtype默认为输入变量的类型,给定类型后将会把生成的数组类型转为目标类型
***通常是用前三个参数就可以了
2.1 subplot函数及其语法说明
subplot(a,b,c)
1、a是subplot的行数;
2、b是subplot的列数;
3、c是subplot中子图的序列号;
2.2 用subplot画多个子图
import numpy as np
# 依次输出函数f(x)=x、f(x)=x**2、f(x)=sin(x)、f(x)=tan(x)的图像
x = np.linspace(0, 10, 100)
x1 = x
x2 = x ** 2
x3 = np.sin(x)
x4 = np.tan(x)

fig = plt.figure()
# 此处的221指输出模式是两行两列,且输出对应的第一个子图
plt.subplot(221)
plt.plot(x, x1)
plt.subplot(222)
plt.plot(x, x2)
plt.subplot(223)
plt.plot(x, x3)
plt.subplot(224)
plt.plot(x, x4)
plt.show()
运行程序后输出的结果为:
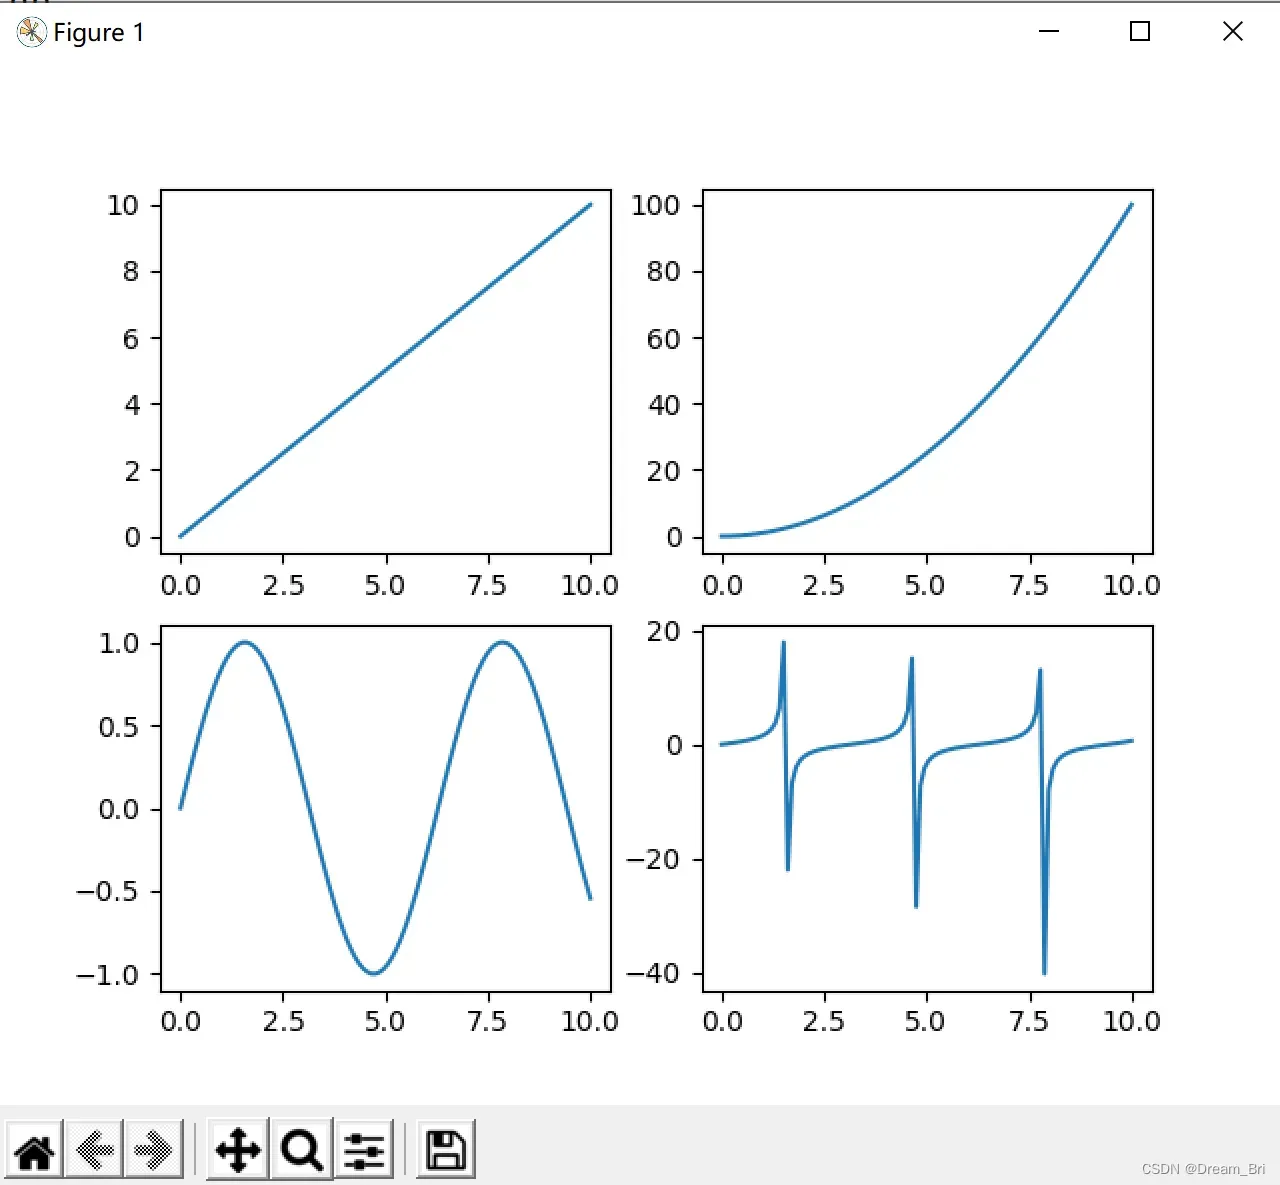
根据上面程序可以看出,每一个subplot()只可以输出一个子图,要想输出多个子图,就需要使用对应的多个subplot()函数。
如果想用一个函数就直接输出多个子图,可以使用subplots()函数实现。
3.1 subplots函数介绍
在此用subplots()函数来实现同样的2*2类型的子图描绘,实现代码如下:
import numpy as np
import matplotlib.pyplot as plt

x = np.linspace(0, 10, 100)
# 划分2*2子图
fig, axes = plt.subplots(2, 2)
ax1 = axes[0, 0]
ax2 = axes[0, 1]
ax3 = axes[1, 0]
ax4 = axes[1, 1]

# 作图f(x)=x
ax1.plot(x, x)
# 作图f(x)=x**2
ax2.plot(x, x ** 2)
ax2.grid(color='r', linestyle='--', linewidth=1, alpha=0.3)
# 作图f(x)=sin(x)
ax3.plot(x, np.sin(x))
# 作图f(x)=tan(x)
ax4.plot(x, np.tan(x))
plt.show()
显示结果如下:

由此,我们可以看到subplots()函数同样实现了四个子图的描绘,在功能上和2.2节所用的subplot()函数达到了一样的效果。
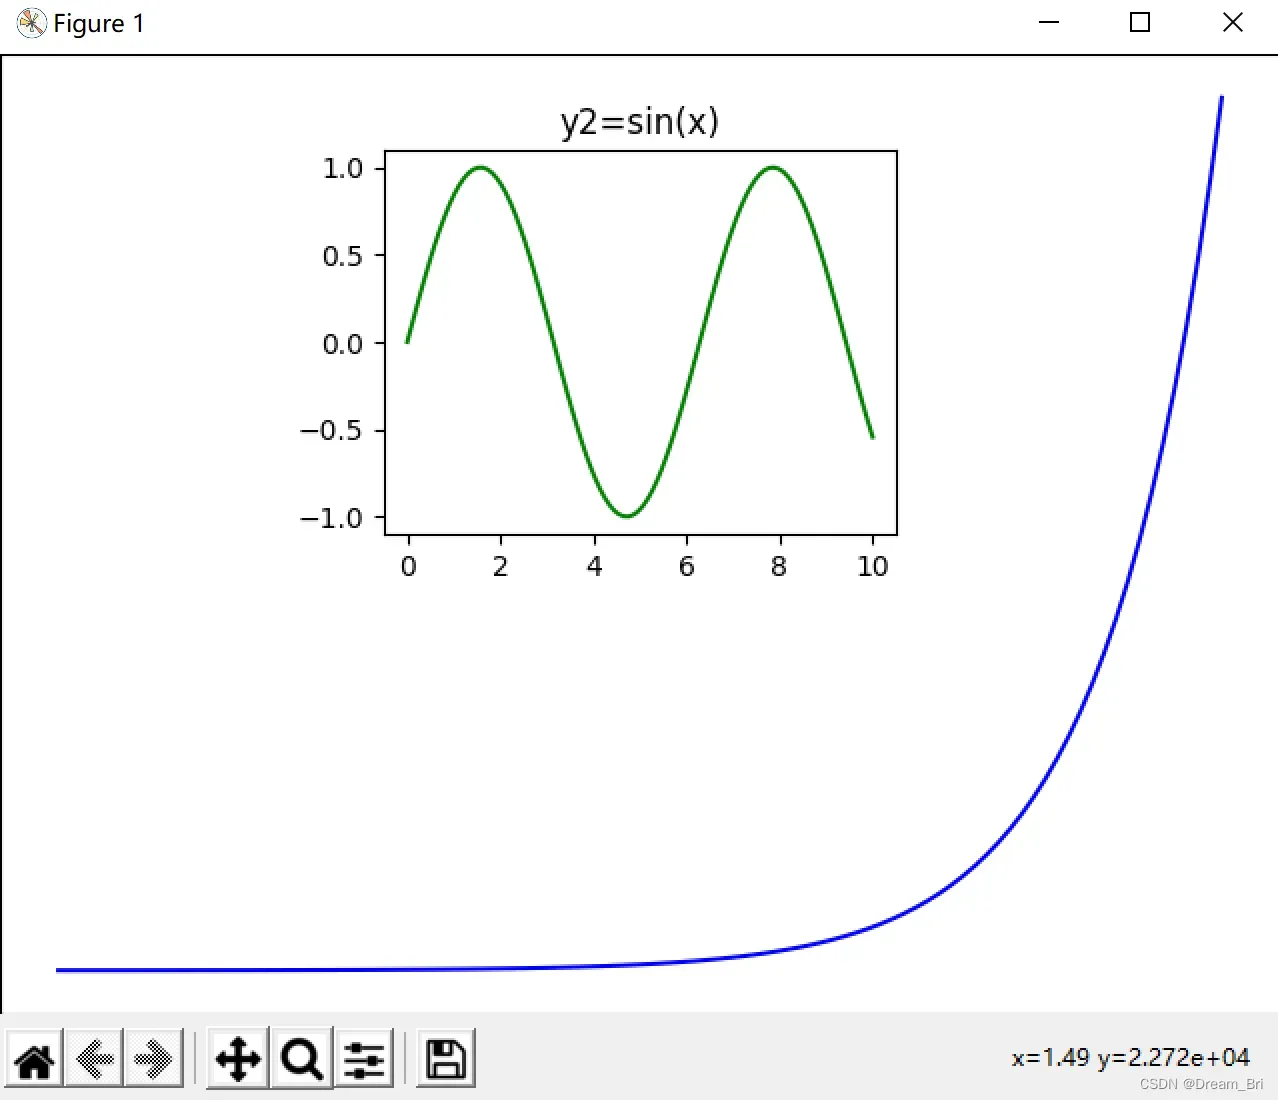
4.1 使用add_axes函数绘制图中图
import numpy as np
import matplotlib.pyplot as plt

# 新建figure
fig = plt.figure()
# 定义数据
x = np.linspace(0, 10, 100)
y1=np.exp(x)
y2 = np.sin(x)
# 新建区域a
left, bottom, width, height = 0, 0, 1, 1
# 绘制图像y1
ax1 = fig.add_axes([left, bottom, width, height])
ax1.plot(x, y1, 'b')
ax1.set_title('y1=exp(x)')

# 设置新增区域b,嵌套在a图内
left, bottom, width, height = 0.3, 0.5, 0.4, 0.4
# 绘制图像y2
ax2 = fig.add_axes([left, bottom, width, height])
ax2.plot(x, y2, 'g')
ax2.set_title('y2=sin(x)')
plt.show()
得到的输出结果为:
文章出处登录后可见!
已经登录?立即刷新