Subplot多合一显示
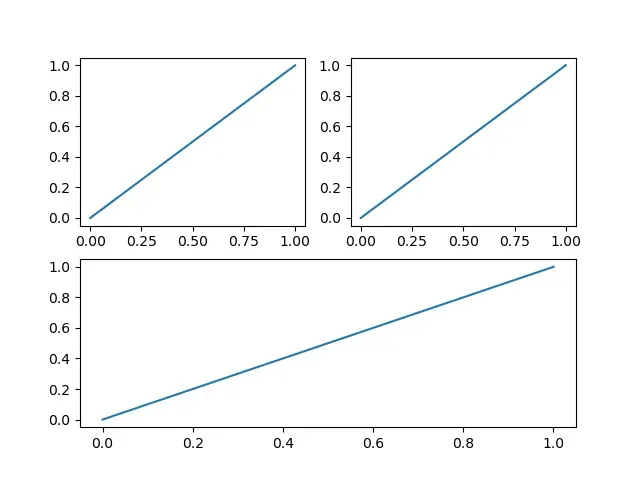
1 plt.subplot
使用plt.subplot(rownum, columnnum, index)说明新图纸是几行几列的
import matplotlib.pyplot as plt

plt.figure()
plt.subplot(2, 2, 1)
plt.plot([0, 1], [0, 1])

plt.subplot(2, 2, 2)
plt.plot([0, 1], [0, 1])

plt.subplot(2, 1, 2)
plt.plot([0, 1], [0, 1])

plt.show()
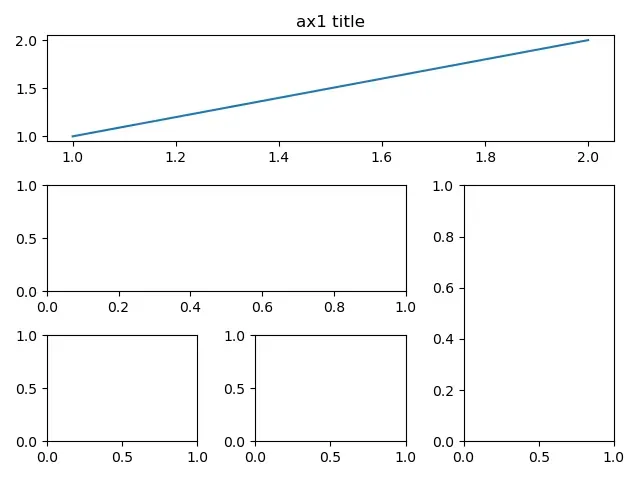
2 plt.subplot2grid
使用plt.subplot2grid(总格数, 起始格数, rowspan, colspan)来绘制
import matplotlib.pyplot as plt

plt.figure()
ax1 = plt.subplot2grid((3, 3), (0, 0), colspan=3, rowspan=1)
ax1.plot([1, 2], [1, 2])
# 设置某属性的时候需要在前面加set_
ax1.set_title("ax1 title")

ax2 = plt.subplot2grid((3, 3), (1, 0), colspan=2)
ax3 = plt.subplot2grid((3, 3), (1, 2), rowspan=2)
ax4 = plt.subplot2grid((3, 3), (2, 0))
ax5 = plt.subplot2grid((3, 3), (2, 1))

plt.tight_layout()
plt.show()
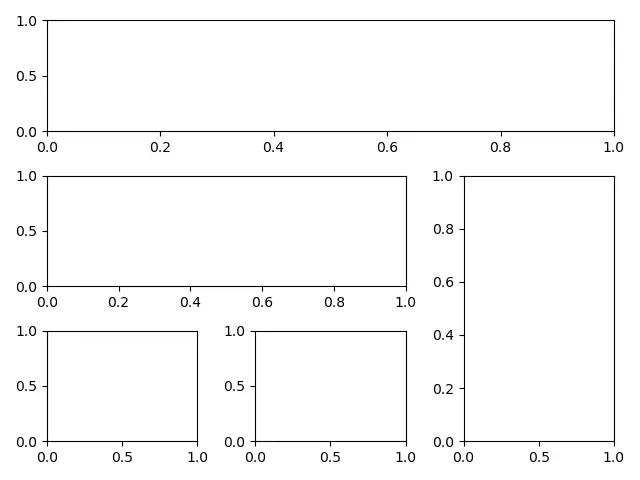
3 gridspec.GridSpec
首先使用gridspec.GridSpec(rownum, colnum)声明将figure分割成几块,然后在绘图时使用切片声明使用哪几块即可
import matplotlib.pyplot as plt
import matplotlib.gridspec as gridspec

plt.figure()
gs = gridspec.GridSpec(3, 3)
ax1 = plt.subplot(gs[0, :])
ax2 = plt.subplot(gs[1, :2])
ax3 = plt.subplot(gs[1:, 2])
ax4 = plt.subplot(gs[2, 0])
ax5 = plt.subplot(gs[2, 1])

plt.tight_layout()
plt.show()
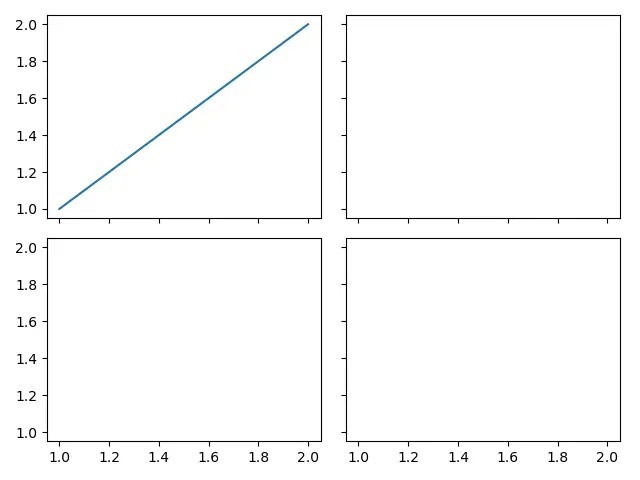
4 plt.subplots
import matplotlib.pyplot as plt
import matplotlib.gridspec as gridspec

f, ((ax11, ax12), (ax21, ax22)) = plt.subplots(2, 2, sharex=True, sharey=True)
ax11.plot([1, 2], [1, 2])

plt.tight_layout()
plt.show()
文章出处登录后可见!
已经登录?立即刷新