Pytorch 张量的 Matplot 直方图
pytorch 704
原文标题 :Matplot histogram of Pytorch Tensor
我有一个大小为10的张量,只有1值:0和1。
我想绘制上面张量的直方图,只需使用matplotlib.pyplot.hist。这是我的代码:
import torch
import matplotlib.pyplot as plt
t = torch.tensor([0., 1., 1., 1., 0., 1., 1., 0., 0., 0.])
print(t)
plt.hist(t, bins=2)
plt.show()
和输出:
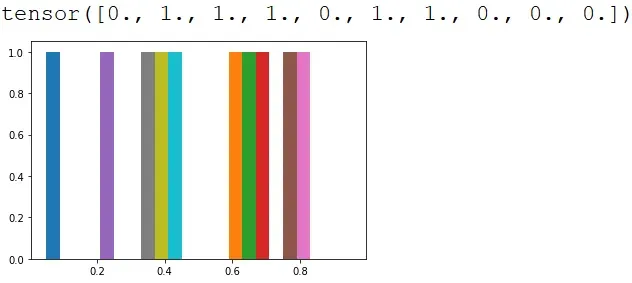
为什么直方图中有这么多值?其余的价值从何而来?如何为我的张量绘制正确的直方图?
回复
我来回复-
 Tomer Geva 评论
该回答已被采纳!
plt.hist(t, bins=2)函数不适用于张量。为了使其正常工作,您可以尝试改用t.numpy()或t.tolist()。据我所知,使用 pytorch 计算直方图的方法是通过torch.histc()函数并绘制您使用的直方图plt.bar()函数,如下所示:import torch import matplotlib.pyplot as plt t = torch.tensor([0., 0., 1., 1., 0., 1., 1., 0., 0., 0.]) hist = torch.histc(t, bins = 2, min = 0, max = 1) bins = 2 x = range(bins) plt.bar(x, hist, align='center') plt.xlabel('Bins')可以在此处和此处查看用于绘制直方图的一些来源。我找不到根本原因,如果有人可以教育我,那就太好了,但据我所知,这是绘制张量的方法
我将张量更改为具有 4 个“1.0”和 6 个“0.0”,以便能够看到差异
2年前