I. 前言
在上一篇文章深入理解PyTorch中LSTM的输入和输出(从input输入到Linear输出)中,我详细地解释了如何利用PyTorch来搭建一个LSTM模型,本篇文章的主要目的是搭建一个LSTM模型用于时间序列预测。
II. 数据处理
数据集为某个地区某段时间内的电力负荷数据,除了负荷以外,还包括温度、湿度等信息。
对于负荷的预测,除了考虑历史负荷数据外,还应该充分考虑其余气象因素的影响。因此,我们根据前24个时刻的负荷+下一时刻的气象数据来预测下一时刻的负荷。
def load_data(file_name):
    global MAX, MIN
    df = pd.read_csv('data/new_data/' + file_name, encoding='gbk')
    columns = df.columns
    df.fillna(df.mean(), inplace=True)
    MAX = np.max(df[columns[1]])
    MIN = np.min(df[columns[1]])
    df[columns[1]] = (df[columns[1]] - MIN) / (MAX - MIN)

    return df


class MyDataset(Dataset):
    def __init__(self, data):
        self.data = data

    def __getitem__(self, item):
        return self.data[item]

    def __len__(self):
        return len(self.data)


def nn_seq(file_name, B):
    print('处理数据:')
    data = load_data(file_name)
    load = data[data.columns[1]]
    load = load.tolist()
    load = torch.FloatTensor(load).view(-1)
    data = data.values.tolist()
    seq = []
    for i in range(len(data) - 30):
        train_seq = []
        train_label = []
        for j in range(i, i + 24):
            train_seq.append(load[j])
        # 添加温度、湿度、气压等信息
        for c in range(2, 8):
            train_seq.append(data[i + 24][c])
        train_label.append(load[i + 24])
        train_seq = torch.FloatTensor(train_seq).view(-1)
        train_label = torch.FloatTensor(train_label).view(-1)
        seq.append((train_seq, train_label))
    # print(seq[:5])

    Dtr = seq[0:int(len(seq) * 0.7)]
    Dte = seq[int(len(seq) * 0.7):len(seq)]

    train_len = int(len(Dtr) / B) * B
    test_len = int(len(Dte) / B) * B
    Dtr, Dte = Dtr[:train_len], Dte[:test_len]

    train = MyDataset(Dtr)
    test = MyDataset(Dte)

    Dtr = DataLoader(dataset=train, batch_size=B, shuffle=True, num_workers=0)
    Dte = DataLoader(dataset=test, batch_size=B, shuffle=True, num_workers=0)

    return Dtr, Dte
上面代码用了DataLoader来对原始数据进行处理,最终得到了batch_size=B的数据集Dtr和Dte,Dtr为训练集,Dte为测试集。
任意输出Dtr中的一个batch的数据(B=5):
[tensor([[0.2692, 0.2394, 0.2026, 0.2009, 0.2757, 0.3198, 0.3951, 0.4583, 0.4791,
         0.4235, 0.4130, 0.4038, 0.3528, 0.3376, 0.3665, 0.3342, 0.3355, 0.3120,
         0.3185, 0.3660, 0.4046, 0.4080, 0.3931, 0.3995, 0.3333, 0.9091, 0.4348,
         1.0000, 0.2791, 0.2439],
        [0.6105, 0.6715, 0.6885, 0.6593, 0.6670, 0.6461, 0.6134, 0.5407, 0.5127,
         0.5299, 0.5064, 0.5002, 0.4649, 0.4511, 0.5292, 0.5973, 0.5346, 0.5394,
         0.5420, 0.5179, 0.5621, 0.4905, 0.4975, 0.5405, 0.6667, 0.5455, 0.6522,
         0.6667, 0.8605, 0.8293],
        [0.2551, 0.2618, 0.2756, 0.2573, 0.2421, 0.2122, 0.2643, 0.3292, 0.3737,
         0.4059, 0.3354, 0.2981, 0.2912, 0.2786, 0.2187, 0.2847, 0.2431, 0.2351,
         0.2356, 0.2146, 0.2666, 0.3055, 0.3291, 0.3383, 0.3333, 0.8182, 0.3913,
         0.6667, 0.6279, 0.5854],
        [0.5669, 0.5079, 0.4308, 0.4094, 0.3656, 0.3448, 0.3801, 0.3765, 0.3640,
         0.3378, 0.3391, 0.3489, 0.4305, 0.4674, 0.5344, 0.5529, 0.4502, 0.4582,
         0.4151, 0.4112, 0.4411, 0.4993, 0.5292, 0.5282, 0.6667, 0.0000, 0.7826,
         0.5000, 0.2791, 0.2195],
        [0.3729, 0.4034, 0.4217, 0.3972, 0.3924, 0.3544, 0.3708, 0.4004, 0.4152,
         0.4143, 0.4381, 0.4447, 0.3417, 0.3179, 0.3195, 0.2607, 0.2608, 0.3367,
         0.3423, 0.2965, 0.2666, 0.2788, 0.3215, 0.3764, 0.3333, 0.8182, 0.3043,
         0.0000, 0.6977, 0.7073]]), tensor([[0.3916], [0.6099], [0.3016], [0.5392],
        [0.3945]])]
一个batch内共5组数据,分别对应x和y。
III. LSTM模型
这里采用了深入理解PyTorch中LSTM的输入和输出(从input输入到Linear输出)中的模型:
class LSTM(nn.Module):
    def __init__(self, input_size, hidden_size, num_layers, output_size, batch_size):
        super().__init__()
        self.input_size = input_size
        self.hidden_size = hidden_size
        self.num_layers = num_layers
        self.output_size = output_size
        self.num_directions = 1 # 单向LSTM
        self.batch_size = batch_size
        self.lstm = nn.LSTM(self.input_size, self.hidden_size, self.num_layers, batch_first=True)
        self.linear = nn.Linear(self.hidden_size, self.output_size)

    def forward(self, input_seq):
        h_0 = torch.randn(self.num_directions * self.num_layers, self.batch_size, self.hidden_size).to(device)
        c_0 = torch.randn(self.num_directions * self.num_layers, self.batch_size, self.hidden_size).to(device)
        seq_len = input_seq.shape[1] # (5, 30)
        # input(batch_size, seq_len, input_size)
        input_seq = input_seq.view(self.batch_size, seq_len, 1)  # (5, 30, 1)
        # output(batch_size, seq_len, num_directions * hidden_size)
        output, _ = self.lstm(input_seq, (h_0, c_0)) # output(5, 30, 64)
        output = output.contiguous().view(self.batch_size * seq_len, self.hidden_size) # (5 * 30, 64)
        pred = self.linear(output) # pred(150, 1)
        pred = pred.view(self.batch_size, seq_len, -1) # (5, 30, 1)
        pred = pred[:, -1, :]  # (5, 1)
        return pred
IV. 训练
def LSTM_train(name, b):
    Dtr, Dte = nn_seq(file_name=name, B=b)
    input_size, hidden_size, num_layers, output_size = 1, 64, 5, 1
    model = LSTM(input_size, hidden_size, num_layers, output_size, batch_size=b).to(device)
    loss_function = nn.MSELoss().to(device)
    optimizer = torch.optim.Adam(model.parameters(), lr=0.001)
    # 训练
    epochs = 15
    cnt = 0
    for i in range(epochs):
        cnt = 0
        print('当前', i)
        for (seq, label) in Dtr:
            cnt += 1
            seq = seq.to(device)
            label = label.to(device)
            y_pred = model(seq)
            loss = loss_function(y_pred, label)
            optimizer.zero_grad()
            loss.backward()
            optimizer.step()
            if cnt % 100 == 0:
                print('epoch', i, ':', cnt - 100, '~', cnt, loss.item())
    state = {'model': model.state_dict(), 'optimizer': optimizer.state_dict()}
    torch.save(state, LSTM_PATH)
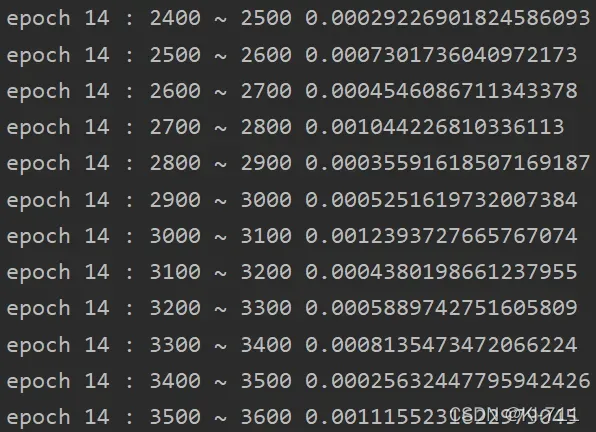
一共训练了15轮:

V. 测试
def test(name, b):
    global MAX, MIN
    Dtr, Dte = nn_seq(file_name=name, B=b)
    pred = []
    y = []
    print('loading model...')
    input_size, hidden_size, num_layers, output_size = 1, 64, 5, 1
    model = LSTM(input_size, hidden_size, num_layers, output_size, batch_size=b).to(device)
    model.load_state_dict(torch.load(LSTM_PATH)['model'])
    model.eval()
    print('predicting...')
    for (seq, target) in Dte:
        target = list(chain.from_iterable(target.data.tolist()))
        y.extend(target)
        seq = seq.to(device)
        seq_len = seq.shape[1]
        seq = seq.view(model.batch_size, seq_len, 1)  # (5, 30, 1)
        with torch.no_grad():
            y_pred = model(seq)
            y_pred = list(chain.from_iterable(y_pred.data.tolist()))
            pred.extend(y_pred)

    y, pred = np.array([y]), np.array([pred])
    y = (MAX - MIN) * y + MIN
    pred = (MAX - MIN) * pred + MIN
    print('accuracy:', get_mape(y, pred))
    # plot
    x = [i for i in range(1, 151)]
    x_smooth = np.linspace(np.min(x), np.max(x), 600)
    y_smooth = make_interp_spline(x, y.T[0:150])(x_smooth)
    plt.plot(x_smooth, y_smooth, c='green', marker='*', ms=1, alpha=0.75, label='true')

    y_smooth = make_interp_spline(x, pred.T[0:150])(x_smooth)
    plt.plot(x_smooth, y_smooth, c='red', marker='o', ms=1, alpha=0.75, label='pred')
    plt.grid(axis='y')
    plt.legend()
    plt.show()
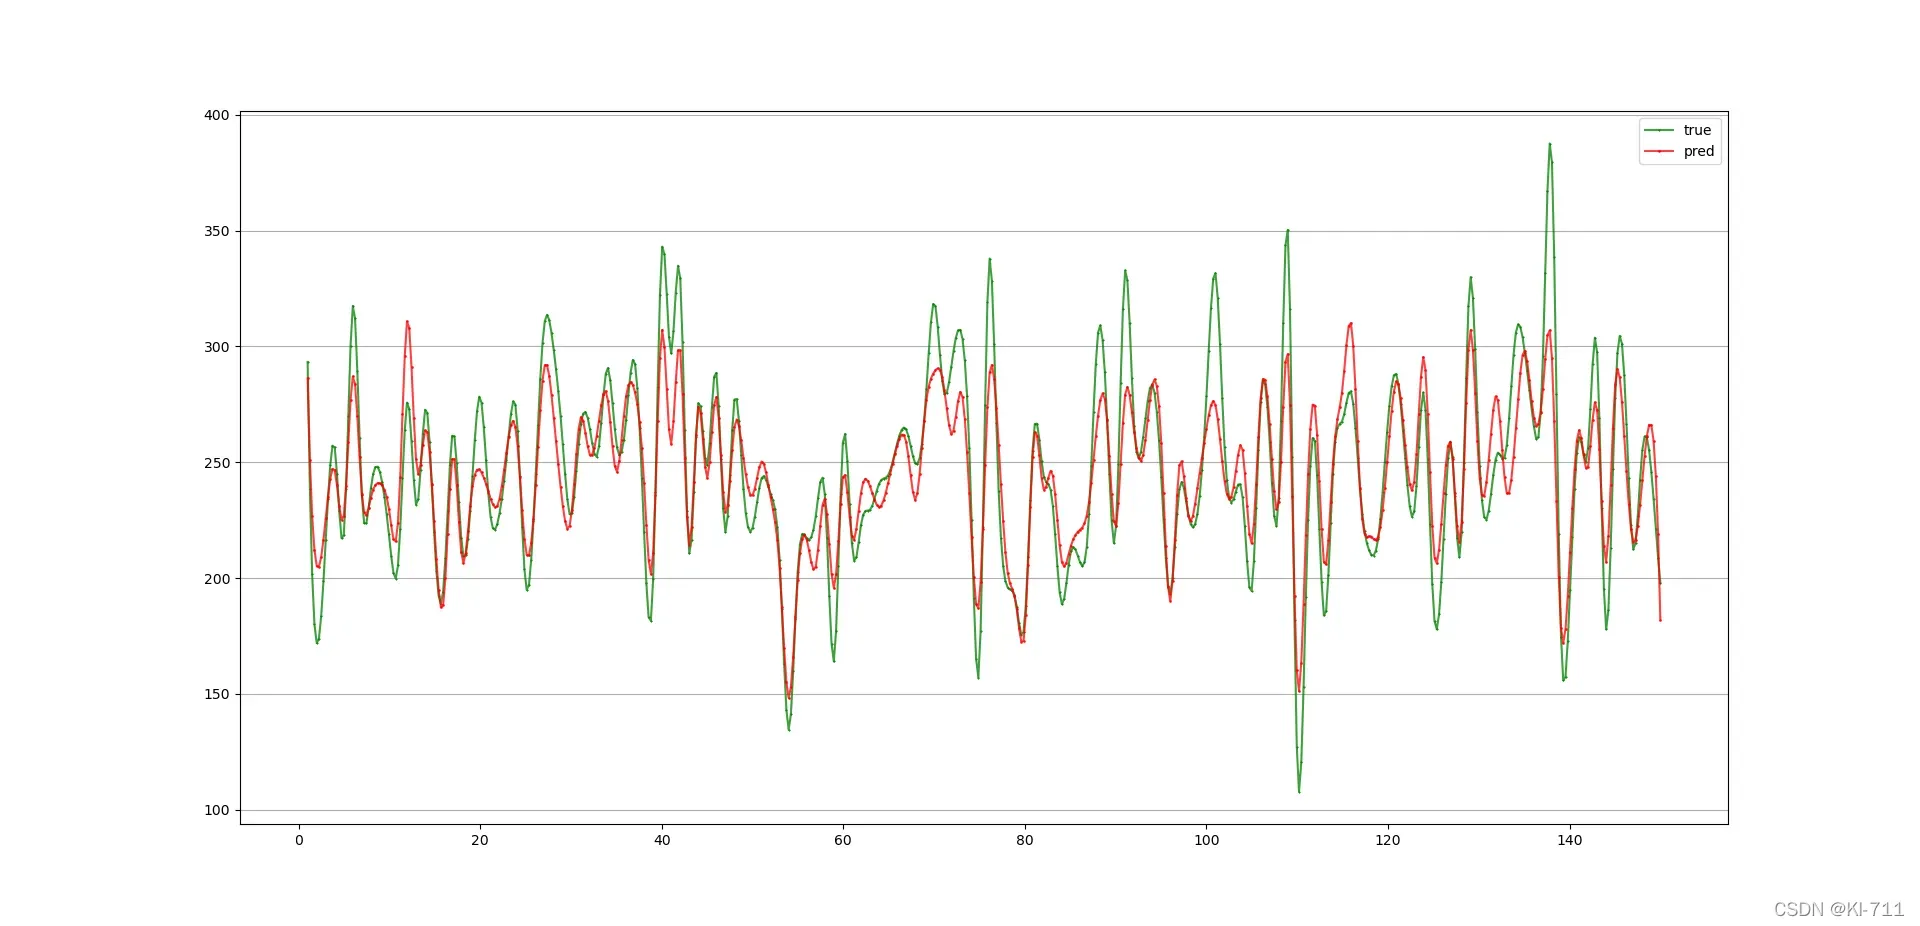
MAPE为6.07%:


版权声明:本文为博主Cyril_KI原创文章,版权归属原作者,如果侵权,请联系我们删除!
原文链接:https://blog.csdn.net/Cyril_KI/article/details/122569775
