文章目录
- 0 前期教程
- 1 前言
- 2 串口部分——QtSerialPort
- 3 绘图部分
- 3.1 QCustomPlot
- 3.2 QtChart
- 3.3 QWT
- 3.4 Qt Designer中如何使用
- 参考链接
0 前期教程
- 【Python】PyQt5入门
1 前言
最近在用PyQt做一个串口上位机,需要串口通信和实时显示曲线。这里简单记录一些关键点。
2 串口部分——QtSerialPort
这个是在安装PyQt5时自动安装的组件,使用方法比较简单,主要是两个模块:QSerialPort, QSerialPortInfo
# 导入包
from PyQt5.QtSerialPort import QSerialPort, QSerialPortInfo

#获取当前的所有串口,得到一个列表
portlist = QSerialPortInfo.availablePorts()
#获取串口的名称和描述
l = [x.portName()+x.description() for x in self.portlist]
#建立一个串口,里面的参数可以填串口名或者就是串口类
ser = QSerialPort()
#接收数据对应调用的函数
ser.readyRead.connect(recv_data)

#设置串口
def init_port(self, port:QSerialPort):
	port.setBaudRate(self.baud)
	port.setDataBits(QSerialPort.DataBits.Data8)
	port.setParity(QSerialPort.Parity.NoParity)
	port.setStopBits(QSerialPort.StopBits.OneStop)
	port.readyRead.connect(recv_data)

#数据接收
data = ser.readAll().data() #得到的是字节字符串
以上就是串口部分的代码,比较简单,利用代码提示基本没有什么问题。
关于字节字符串的处理可以看一下这篇文章
- 【学习笔记】字节数据和字节字符串(b“ “)那些事
3 绘图部分
经过调研,发现在Qt当中绘制函数曲线,常用的有3个包,分别是QCustomPlot , QWT和QtChart,其中前两者都是第三方包,后者是Qt官方做的,不过三者都兼容PyQt5就是了
3.1 QCustomPlot
QCustomPlot目前在pypi上好像有好几个版本
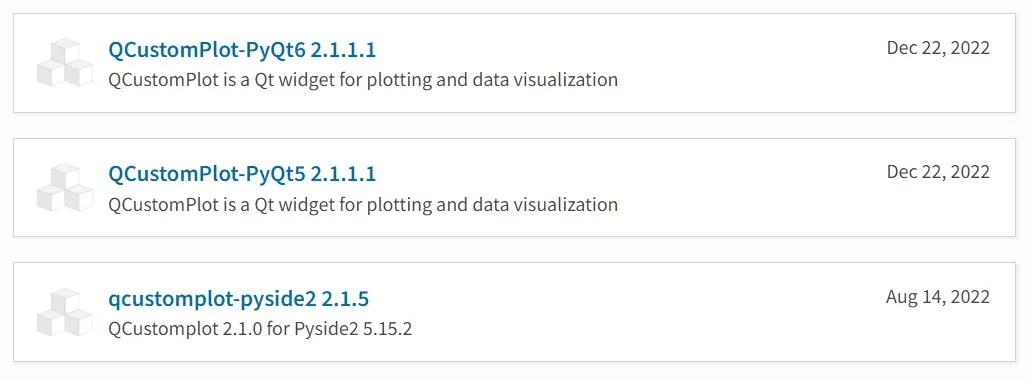
除此之外,如果直接运行pip install QCustomPlot2也是可以安装的,而且用着感觉和QCustomPlot-PyQt5没什么区别,所以也不知道啥有这么多的版本。
不过这个包有一个最大的问题,那就是它对Python的支持不够好。网上有很多关于这个包在C环境下的使用,但是Python环境下却不支持代码提示,安装的包是一个编译过的pyd文件。
以下是一个例子
import sys
import math
from PyQt5.QtCore import Qt
from PyQt5.QtGui import QPen, QBrush, QColor
from PyQt5.QtWidgets import QApplication, QMainWindow

from QCustomPlot2 import QCustomPlot, QCP
#以上QCustomPlot2完全可以直接换成QCustomPlot-PyQt5

app = QApplication(sys.argv)
window = QMainWindow()
window.resize(800, 600)

customPlot = QCustomPlot()
window.setCentralWidget(customPlot)

graph0 = customPlot.addGraph()
graph0.setPen(QPen(Qt.blue))
graph0.setBrush(QBrush(QColor(0, 0, 255, 20)))

graph1 = customPlot.addGraph()
graph1.setPen(QPen(Qt.red))

x, y0, y1 = [], [], []
for i in range (251):
    x.append(i)
    y0.append(math.exp(-i/150.0)*math.cos(i/10.0))  # exponentially decaying cosine
    y1.append(math.exp(-i/150.0))                   # exponential envelope

graph0.setData(x, y0)
graph1.setData(x, y1) #除setData外,还有addData函数,即添加一个点

customPlot.rescaleAxes()
customPlot.setInteraction(QCP.iRangeDrag)
customPlot.setInteraction(QCP.iRangeZoom)
customPlot.setInteraction(QCP.iSelectPlottables)

window.show()
sys.exit(app.exec_())
以下是在类中的使用参考:
def initPlot(self):
    self.ui.widget

    self.ui.widget.setInteractions(QCP.iRangeDrag | QCP.iRangeZoom | QCP.iSelectAxes | QCP.iSelectLegend | QCP.iSelectPlottables)
    # self.ui.widget.axisRect().setRangeZoomAxes(, self.ui.widget.yAxis)
    self.ui.widget.xAxis.setLabel("t")
    self.ui.widget.yAxis.setLabel("accel")
    self.ui.widget.legend.setVisible(True)
    self.ui.widget.yAxis.setRange(-2,2)

    self.ui.widget.axisRect().insetLayout().setInsetAlignment(0, Qt.AlignLeft|Qt.AlignTop)

    self.ui.widget.addGraph()#添加第1条曲线
    self.ui.widget.graph(0).setName("x")#曲线名称
    self.ui.widget.graph(0).setPen(QPen(Qt.red)) # line1 color red for second graph

    self.ui.widget.addGraph()#添加第2条曲线
    self.ui.widget.graph(1).setName("y")#曲线名称
    self.ui.widget.graph(1).setPen(QPen(Qt.blue)) # line1 color red for second graph

    self.ui.widget.addGraph()#添加第3条曲线
    self.ui.widget.graph(2).setName("z")#曲线名称
    self.ui.widget.graph(2).setPen(QPen(Qt.green)) # line1 color red for second graph

    self.ui.widget.addGraph()#添加第4条曲线
    self.ui.widget.graph(3).setName("norm")#曲线名称
    self.ui.widget.graph(3).setPen(QPen(Qt.cyan)) # line1 color red for second graph

    self.key_init = QDateTime.currentDateTime().toMSecsSinceEpoch()/1000

def fresh(self, x=0, y=0, z=0, norm=0):
    key = QDateTime.currentDateTime().toMSecsSinceEpoch()/1000 - self.key_init
    self.ui.widget.graph(0).addData(key, x)
    self.ui.widget.graph(1).addData(key, y)
    self.ui.widget.graph(2).addData(key, z)
    self.ui.widget.graph(3).addData(key, norm)
    self.ui.widget.rescaleAxes()

    # self.ui.widget.xAxis.setRange(self.x, 8, Qt.AlignRight)
    self.ui.widget.replot()
3.2 QtChart
使用前先安装:pip install PyQtChart,在使用这个包时,要注意其基本的逻辑。显示的类为QChartView, 但是QChartView需要关联一个QChart,而每个QChart可以包含一个或多个series,即一条或多条曲线,当然series类型有很多,这个和曲线计算方式和想要绘制图形的类型有关。看个例子。
import sys
from PyQt5.QtGui import QPainter
from PyQt5.QtWidgets import QApplication, QMainWindow, QWidget, QVBoxLayout
from PyQt5.QtChart import QLineSeries, QChart, QChartView
def create_chart():
    # 创建折线图的数据
    series = QLineSeries()
    series.append(0, 0)
    series.append(1, 1)
    series.append(2, 2)
    series.append(3, 3)
    chart = QChart()
    chart.addSeries(series)
    chart.setTitle('Chart Example') # 设置图表标题
    chart.setAnimationOptions(QChart.SeriesAnimations) # 设置动画效果
    return chart
class MainWindow(QMainWindow):
    def __init__(self, parent=None):
        super(MainWindow, self).__init__(parent)
        self.setWindowTitle('QtChart Example')
        chart_view = QChartView(create_chart())

        chart_view.setRenderHint(QPainter.Antialiasing) # 设置渲染方式
        self.setCentralWidget(chart_view)
if __name__ == '__main__':
    app = QApplication(sys.argv)
    window = MainWindow()
    window.show()
    sys.exit(app.exec_())
//2023.5.16
这个有一点需要注意的是,序列,坐标系,图表的建立要遵循一定的顺序,具体可以参考这篇博客中的代码。
3.3 QWT
这个没有用过,但是感觉还行,也有代码提示,安装方法:
# 一定要安装这个包,否则无法使用
pip install pyqt5-tools
# 再安装对应的包
pip install PythonQwt
这里给一个pypi官网提供的例子:
from qtpy import QtWidgets as QW
import qwt
import numpy as np

app = QW.QApplication([])
x = np.linspace(-10, 10, 500)
plot = qwt.QwtPlot("Trigonometric functions")
plot.insertLegend(qwt.QwtLegend(), qwt.QwtPlot.BottomLegend)
qwt.QwtPlotCurve.make(x, np.cos(x), "Cosinus", plot, linecolor="red", antialiased=True)
qwt.QwtPlotCurve.make(x, np.sin(x), "Sinus", plot, linecolor="blue", antialiased=True)
plot.resize(600, 300)
plot.show()
app.exec_()
3.4 Qt Designer中如何使用
在上面的前期教程当中,有提到PyQt常用的开发方式,就是在Qt Designer中设计ui,然后转换成py文件,再另写一个py文件进行界面的显示和处理。那这些曲线怎么在Qt Designer中设计呢?
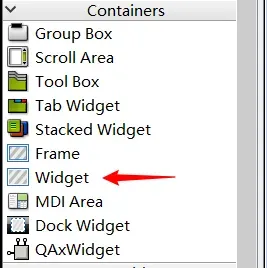
在需要显示的位置放置一个Widget控件:
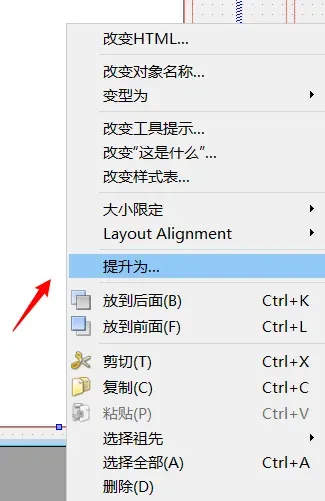
然后右键该控件,选择“提升为”
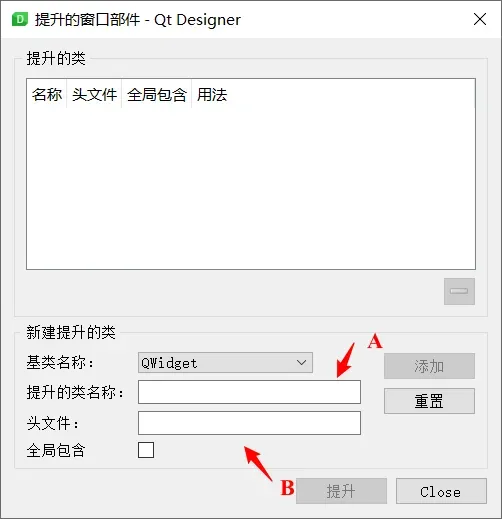
这里主要是填两个空,即提升的类名称和头文件,由于Python当中没有头文件,实际填的是模块名。即保证结构是from B import A,其中A应该是一个显示的类,具体应该填什么根据使用的包决定。比如如果使用的是QtChart,那么应该是from PyQt5.QtChart import QChartView
参考链接
- PyQt5 QSerialPort子线程操作
- Python3+PyQt5+QtChart 实现简单的实时更新曲线图
- QChart的简单使用
- Qwt、QChart、QCustomPlot使用
- PyQtChart
文章出处登录后可见!