前言
Of all the applications of machine-learning, diagnosing any serious disease using a black box is always going to be a hard sell。If the output from a model is the particular course of treatment (potentially with side-effects), or surgery, or the absence of treatment, people are going to want to know why.This dataset gives a number of variables along with a target condition of having or not having heart disease。Below, the data is first used in a simple random forest model, and then the model is investigated using ML explainability tools and techniques.
一、项目流程
- 数据预处理和类型转换
- 随机森林模型的建立与解释
- 决策树可视化
- 基于混淆矩阵的分类评价指标
- 部分依赖图PDP的绘制和解释
- AutoML机器学习SHAP库的使用和解释
二、PDPBOX、ELI5、SHAP、SEABORN库
前提:
因为在做机器学习项目时会引入第三方库,笔者建议新建一个conda环境安装相关库,以避免库与库之间的冲突。故新建一个名为project的conda环境,具体代码如下:
1. conda create -n project1 python==3.7
当出现$conda activate project1时,代表project1已经创建完成
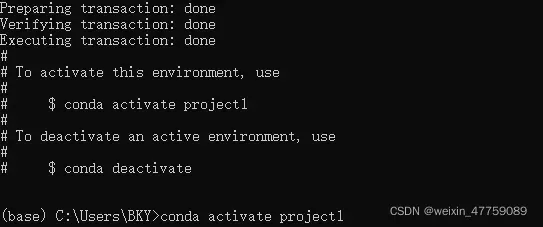
2.conda activate project1
进入project1环境
本项目主要库为:pdpbox、eli5、shap、seaborn。接下来逐一介绍:
- PDPBOX:
PDP(Partial Dependence Plot) 是一个显示特征对机器学习模型预测结果的边际影响的图。它用于评估特征与目标之间的相关性是线性的、单调的还是更复杂的。
安装:
1.pip install pdpbox
- ELI5:
ELI5 是一个 Python 包,有助于机器学习的可解释性。
安装:
2.pip install eli5
- SHAP:
SHAP是一种博弈论方法,用来解释任何机器学习模型的输出。
安装:
3.pip install shap
- SEABORN
4.pip install seaborn
三、项目详情:
1.引入库
import numpy as np
import pandas as pd
import matplotlib.pyplot as plt
import seaborn as sns
from sklearn.ensemble import RandomForestClassifier
from sklearn.tree import DecisionTreeClassifier
from sklearn.tree import export_graphviz
from sklearn.metrics import roc_curve, auc
from sklearn.metrics import classification_report
from sklearn.metrics import confusion_matrix
from sklearn.model_selection import train_test_split
import eli5
from eli5.sklearn import PermutationImportance
import shap
from pdpbox import pdp, info_plots
np.random.seed(123)
pd.options.mode.chained_assignment = None
2.数据预处理和类型转化
1).导入数据
获取心脏数据,提取码:ykyh
dt = pd.read_csv("heart.csv")
dt.head().append(dt.tail())
读取数据,并输出首尾5行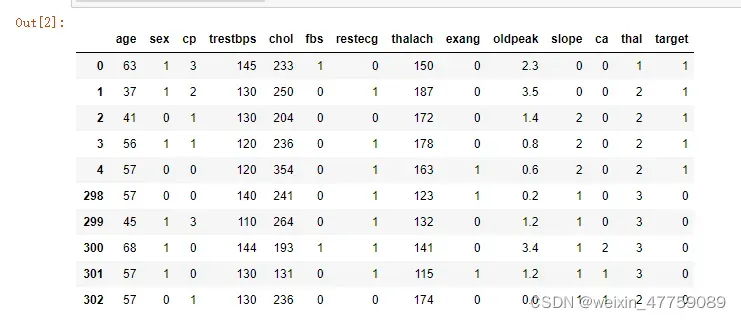
2).缺失值情况
dt.isnull().sum()
观察没有缺失值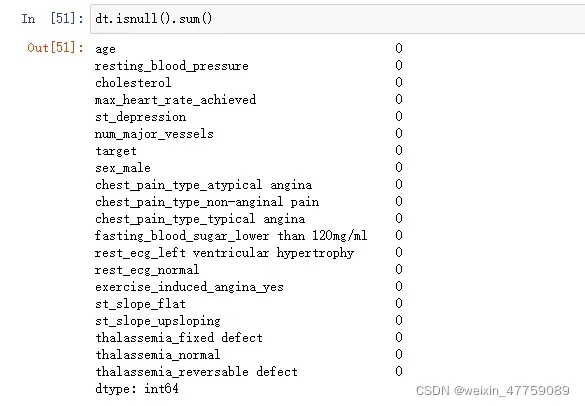
3).设置字段
dt.columns = ['age', 'sex', 'chest_pain_type', 'resting_blood_pressure', 'cholesterol', 'fasting_blood_sugar', 'rest_ecg', 'max_heart_rate_achieved',
       'exercise_induced_angina', 'st_depression', 'st_slope', 'num_major_vessels', 'thalassemia', 'target']
每个字段的含义:
age:年龄
sex 性别 1=male 0=female
cp 胸痛类型;4种取值情况
1:典型心绞痛
2:非典型心绞痛
3:非心绞痛
4:无症状
trestbps 静息血压
chol 血清胆固醇
fbs 空腹血糖 >120mg/dl :1=true;0=false
restecg 静息心电图(值0,1,2)
thalach 达到的最大心率
exang 运动诱发的心绞痛(1=yes;0=no)
oldpeak 相对于休息的运动引起的ST值(ST值与心电图上的位置有关)
slope 运动高峰ST段的坡度
1:upsloping向上倾斜
2:flat持平
3:downsloping向下倾斜
ca The number of major vessels(血管) (0-3)
thal A blood disorder called thalassemia ,一种叫做地中海贫血的血液疾病(3 = normal;6 = fixed defect;;7 = reversable defect)
target 生病没有(0=no;1=yes)
4).字段转化
dt['sex'][dt['sex'] == 0] = 'female'
dt['sex'][dt['sex'] == 1] = 'male'
dt['chest_pain_type'][dt['chest_pain_type'] == 1] = 'typical angina'
dt['chest_pain_type'][dt['chest_pain_type'] == 2] = 'atypical angina'
dt['chest_pain_type'][dt['chest_pain_type'] == 3] = 'non-anginal pain'
dt['chest_pain_type'][dt['chest_pain_type'] == 4] = 'asymptomatic'
dt['fasting_blood_sugar'][dt['fasting_blood_sugar'] == 0] = 'lower than 120mg/ml'
dt['fasting_blood_sugar'][dt['fasting_blood_sugar'] == 1] = 'greater than 120mg/ml'
dt['rest_ecg'][dt['rest_ecg'] == 0] = 'normal'
dt['rest_ecg'][dt['rest_ecg'] == 1] = 'ST-T wave abnormality'
dt['rest_ecg'][dt['rest_ecg'] == 2] = 'left ventricular hypertrophy'
dt['exercise_induced_angina'][dt['exercise_induced_angina'] == 0] = 'no'
dt['exercise_induced_angina'][dt['exercise_induced_angina'] == 1] = 'yes'
dt['st_slope'][dt['st_slope'] == 1] = 'upsloping'
dt['st_slope'][dt['st_slope'] == 2] = 'flat'
dt['st_slope'][dt['st_slope'] == 3] = 'downsloping'
dt['thalassemia'][dt['thalassemia'] == 1] = 'normal'
dt['thalassemia'][dt['thalassemia'] == 2] = 'fixed defect'
dt['thalassemia'][dt['thalassemia'] == 3] = 'reversable defect'
dt.dtypes
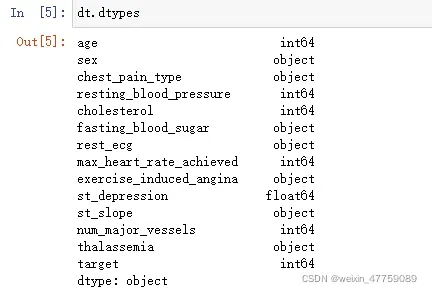
字段类型转换
dt['sex'] = dt['sex'].astype('object')
dt['chest_pain_type'] = dt['chest_pain_type'].astype('object')
dt['fasting_blood_sugar'] = dt['fasting_blood_sugar'].astype('object')
dt['rest_ecg'] = dt['rest_ecg'].astype('object')
dt['exercise_induced_angina'] = dt['exercise_induced_angina'].astype('object')
dt['st_slope'] = dt['st_slope'].astype('object')
dt['thalassemia'] = dt['thalassemia'].astype('object')
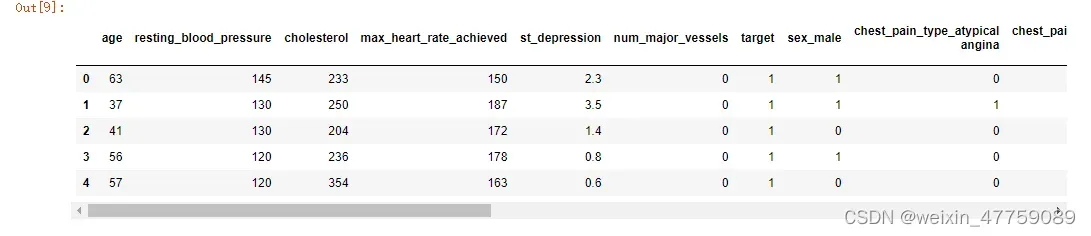
生成虚拟变量
dt = pd.get_dummies(dt, drop_first=True)
dt.head()
3.随机森林模型建立与解释
1).切分数据
X_train, X_test, y_train, y_test = train_test_split(dt.drop('target', 1), dt['target'], test_size = .2, random_state=10)
2).建立模型
model = RandomForestClassifier(max_depth=5)
model.fit(X_train, y_train)
estimator = model.estimators_[1]
feature_names = [i for i in X_train.columns]
y_train_str = y_train.astype('str')
y_train_str[y_train_str == '0'] = 'no disease'
y_train_str[y_train_str == '1'] = 'disease'
y_train_str = y_train_str.values
y_train_str[:5]
4.决策树可视化
数据获取提取码:h0cz
import pandas as pd
import numpy as np
from sklearn import tree
from sklearn.model_selection import train_test_split
df_t=pd.read_excel(r'heart.xlsx')
arr_t=df_t.values.astype(np.float32)
arr_t
Xtrain,Xtest,Ytrain,Ytest = train_test_split(arr_t[:,:-1],arr_t[:,-1],test_size=0.3)
实例化决策树,训练模型,查看正确率
dtc = tree.DecisionTreeClassifier(criterion="entropy"
                                 ,max_depth=4
                                 ,min_samples_split=10).fit(Xtrain,Ytrain)
score = dtc.score(Xtest,Ytest)
score
最终准确率为:0.8021978021978022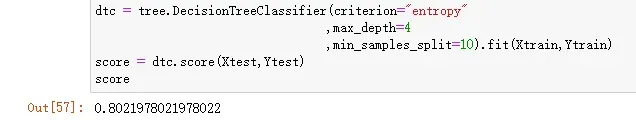
在可视化之前需要安装graphviz
a.去官网下载graphviz,下载并安装对应的exe即可
b.pip uninstall graphviz
c.conda install python-graphviz
d.配置环境变量
User Path:C:\Program Files \Graphviz2.38\bin
System Path:C:\Program Files \Graphviz2.38\bin\dot.exe
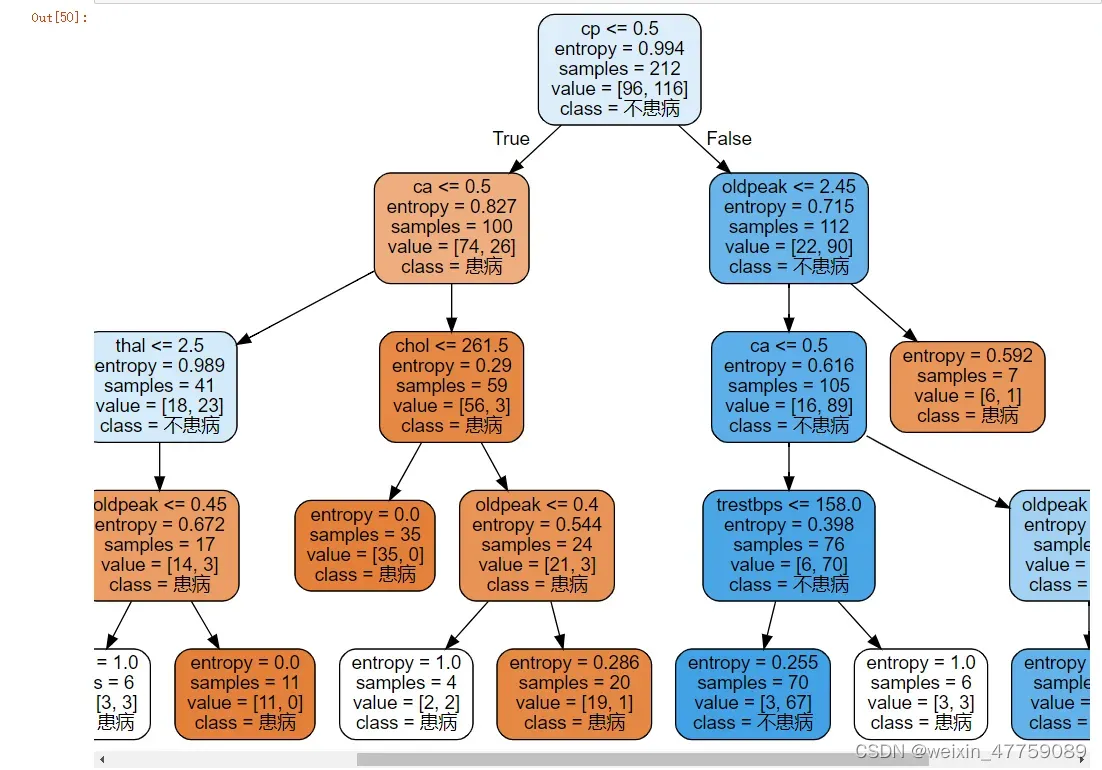
接下来可视化:
graph_tree = graphviz.Source(tree.export_graphviz(dtc
                                 ,feature_names = df_t.keys()[:-1]
                                 ,class_names = ['患病','不患病']
                                 ,filled = True
                                 ,rounded = True))
graph_tree
5.基于混淆矩阵的分类评价指标
1).混淆矩阵
confusion_matrix = confusion_matrix(y_test, y_pred_bin)
confusion_matrix
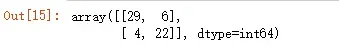
2).计算sensitivity and specificity
total=sum(sum(confusion_matrix))
sensitivity = confusion_matrix[0,0]/(confusion_matrix[0,0]+confusion_matrix[1,0])
print('Sensitivity : ', sensitivity )
specificity = confusion_matrix[1,1]/(confusion_matrix[1,1]+confusion_matrix[0,1])
print('Specificity : ', specificity)
计算结果如图:
3).绘制ROC曲线
fpr, tpr, thresholds = roc_curve(y_test, y_pred_quant)
fig, ax = plt.subplots()
ax.plot(fpr, tpr)
ax.plot([0, 1], [0, 1], transform=ax.transAxes, ls="--", c=".3")
plt.xlim([0.0, 1.0])
plt.ylim([0.0, 1.0])
plt.rcParams['font.size'] = 12
plt.title('ROC curve for diabetes classifier')
plt.xlabel('False Positive Rate (1 - Specificity)')
plt.ylabel('True Positive Rate (Sensitivity)')
plt.grid(True)
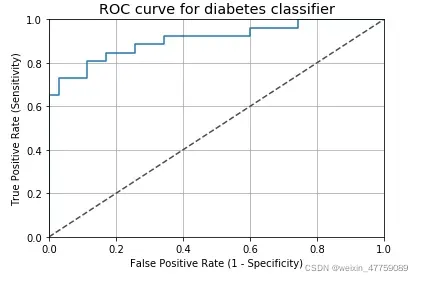
最终的ROC曲线值: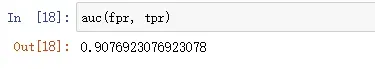
由一般ROC曲线的评价标准,评分大于0.90视为极好,本项目的表现结果还是可观的。
6.部分依赖图PDP的绘制和解释
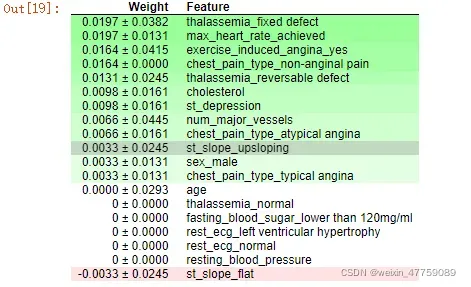
1).排列重要性
perm = PermutationImportance(model, random_state=1).fit(X_test, y_test)
eli5.show_weights(perm, feature_names = X_test.columns.tolist())
2).一维PDP
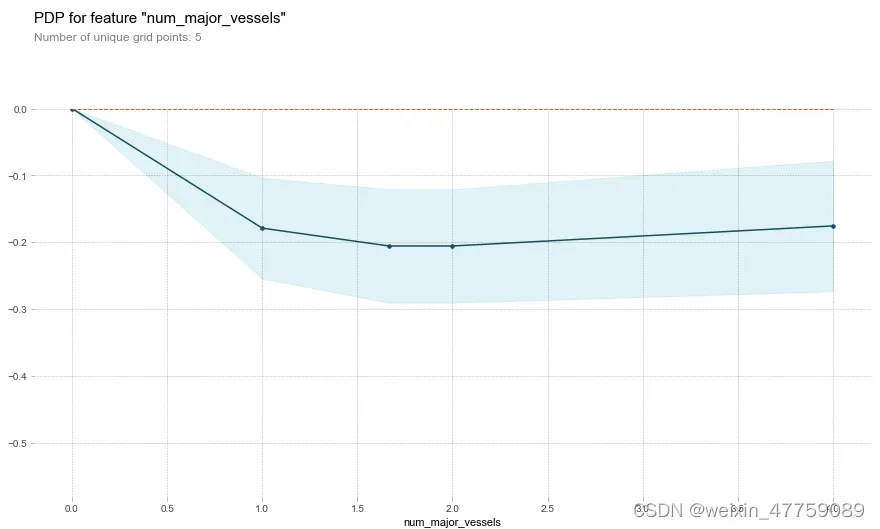
Partial Dependence就是用来解释某个特征和目标值y的关系的,一般是通过画出Partial Dependence Plot(PDP)来体现。也就是说PDP在X1的值,就是把训练集中第一个变量换成X1之后,原模型预测出来的平均值。
查看各个特征与目标值之间的关系
字段num_major_vessels
base_features = dt.columns.values.tolist()
base_features.remove('target')
feat_name = 'num_major_vessels'
pdp_dist = pdp.pdp_isolate(model=model, dataset=X_test, model_features=base_features, feature=feat_name)
pdp.pdp_plot(pdp_dist, feat_name)
plt.show()
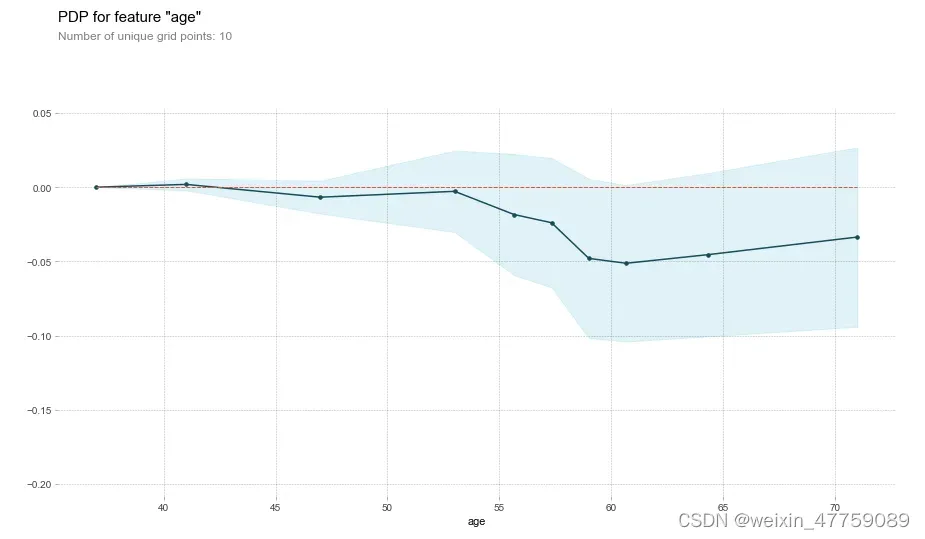
字段age
feat_name = 'age'
pdp_dist = pdp.pdp_isolate(model=model, dataset=X_test, model_features=base_features, feature=feat_name)
pdp.pdp_plot(pdp_dist, feat_name)
plt.show()
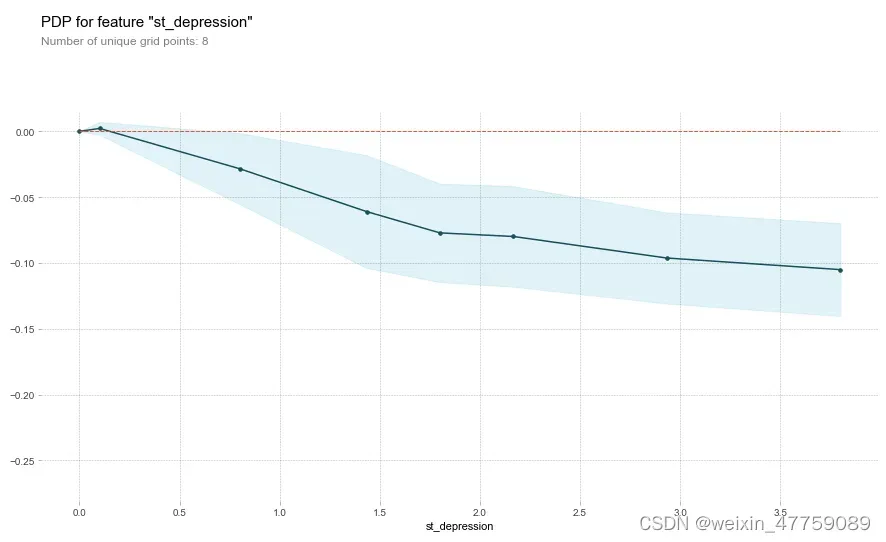
字段st_depression
feat_name = 'st_depression'
pdp_dist = pdp.pdp_isolate(model=model, dataset=X_test, model_features=base_features, feature=feat_name)
pdp.pdp_plot(pdp_dist, feat_name)
plt.show()
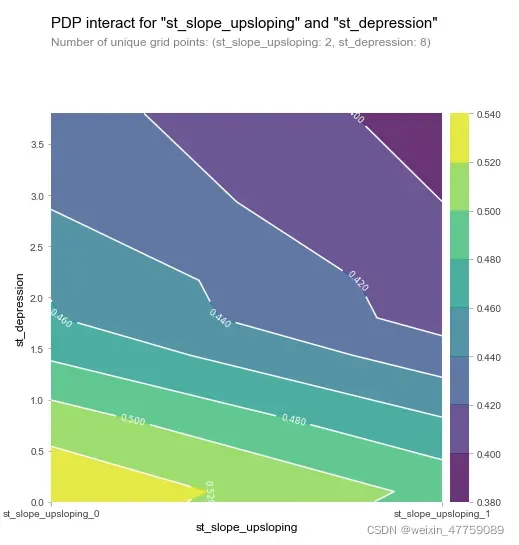
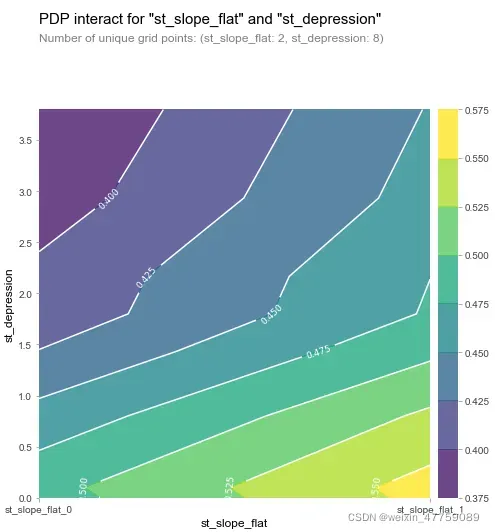
3).2D-PDP图
inter1  =  pdp.pdp_interact(model=model, dataset=X_test, model_features=base_features, features=['st_slope_upsloping', 'st_depression'])
pdp.pdp_interact_plot(pdp_interact_out=inter1, feature_names=['st_slope_upsloping', 'st_depression'], plot_type='contour')
plt.show()
inter1  =  pdp.pdp_interact(model=model, dataset=X_test, model_features=base_features, features=['st_slope_flat', 'st_depression'])
pdp.pdp_interact_plot(pdp_interact_out=inter1, feature_names=['st_slope_flat', 'st_depression'], plot_type='contour')
plt.show()
7.AutoML机器学习SHAP库的使用和解释
在SHAP中进行模型解释之前需要先创建一个explainer,本项目以tree为例
传入随机森林模型model,在explainer中传入特征值的数据,计算shap值
explainer = shap.TreeExplainer(model)
shap_values = explainer.shap_values(X_test)
shap.summary_plot(shap_values[1], X_test, plot_type="bar")
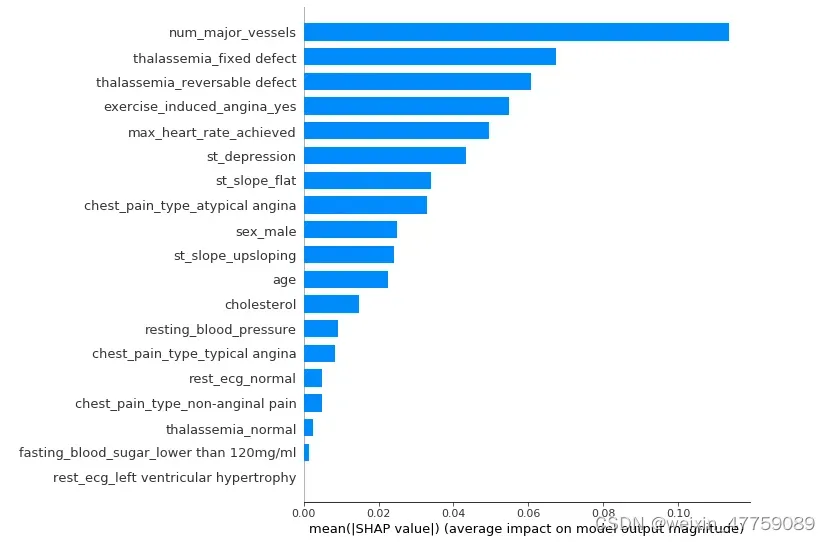
shap.summary_plot(shap_values[1], X_test)
a.每一行代表一个特征,横坐标为SHAP值
b.一个点代表一个样本,颜色表示特征值的高低(红色高,蓝色低)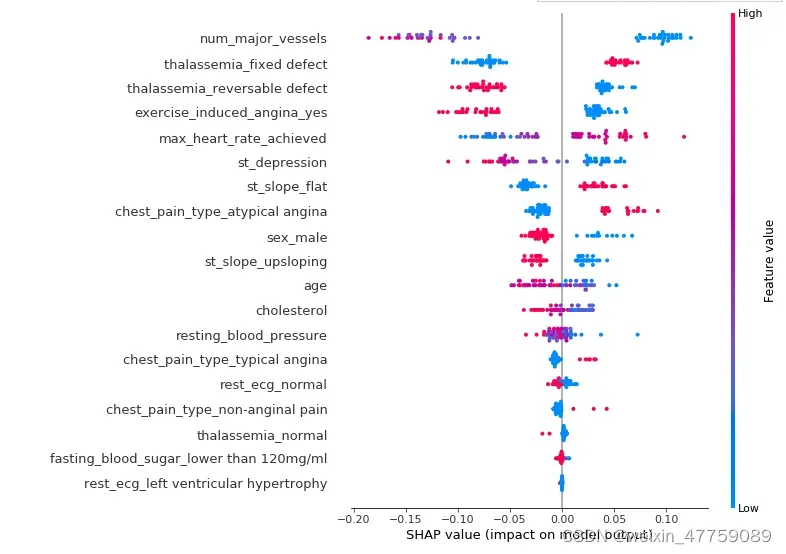
个体差异
了解个体患者的不同特征属性如何影响其结果
def heart_disease_risk_factors(model, patient):
    explainer = shap.TreeExplainer(model)
    shap_values = explainer.shap_values(patient)
    shap.initjs()
    return shap.force_plot(explainer.expected_value[1], shap_values[1], patient)
data_for_prediction = X_test.iloc[1,:].astype(float)
heart_disease_risk_factors(model, data_for_prediction)
data_for_prediction = X_test.iloc[3,:].astype(float)
heart_disease_risk_factors(model, data_for_prediction)
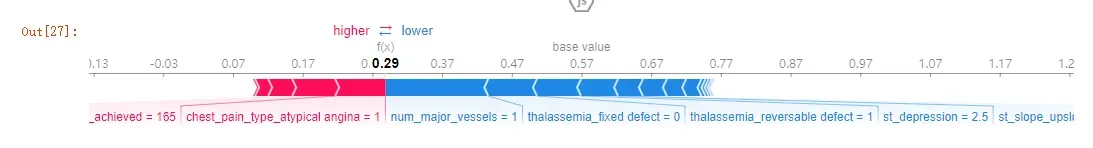
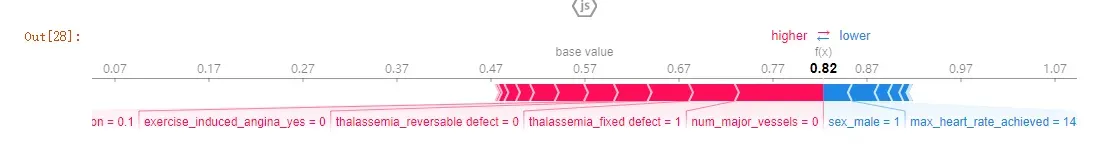
*P1:预测准确率高达29%(baseline是57%),更多的因素集中在ca、thal_fixed_defect、oldpeak等蓝色部分。
*P3:预测准确率高达82%,更多的影响因素在sel_male=0,thalach=143等
通过比较不同的患者,我们可以观察到不同患者之间的预测率和主要影响因素。
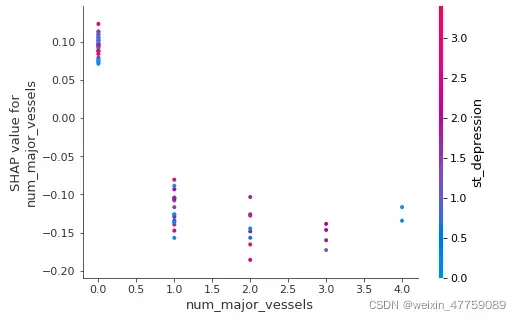
将单个feature的SHAP值与数据集中所有样本的feature值进行比较
ax2 = fig.add_subplot(224)
shap.dependence_plot('num_major_vessels', shap_values[1], X_test, interaction_index="st_depression")
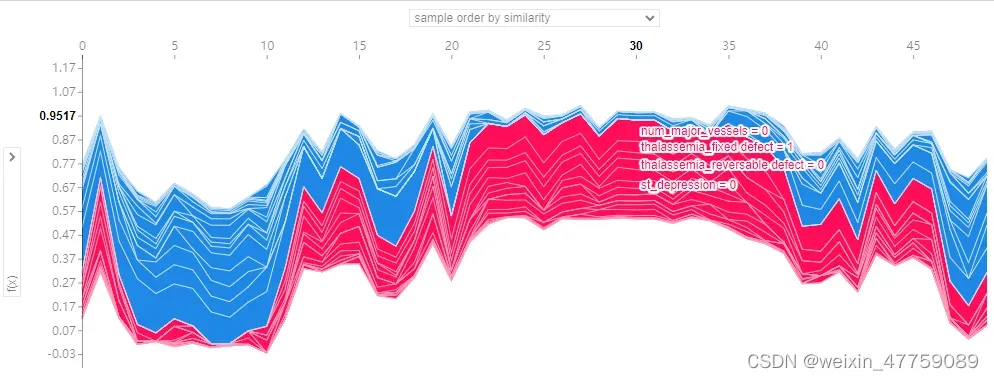
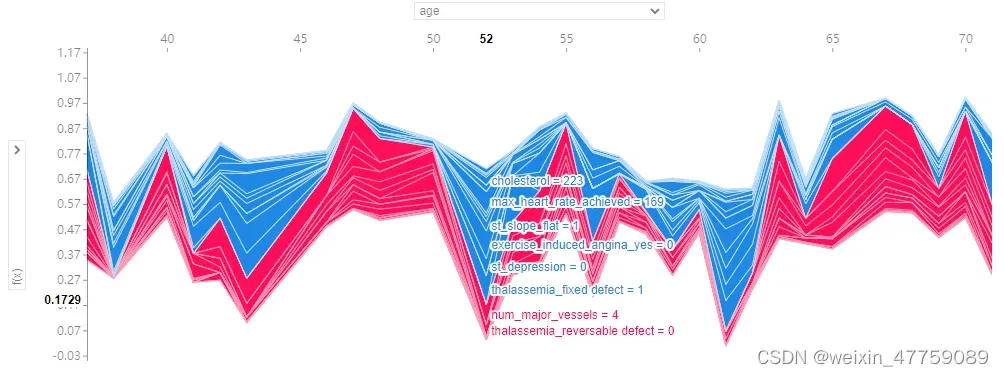
多样本视觉探索
将不同的特征属性对前50个患者的影响进行可视化分析。这里以sample order by similarity和age为例
shap_values = explainer.shap_values(X_train.iloc[:50])
shap.force_plot(explainer.expected_value[1], shap_values[1], X_test.iloc[:50])
总结
运行环境:jupyter notebook
基于随机森林模型的心脏病患者预测及可视化项目主要运用随机森林去建立模型。可视化部分主要用到graphviz以及shap库,这两个库在机器学习研究里面也是相当不错的可视化模型库。
笔者在安装graphviz以及pdpbox库中遇到不少问题,通过查阅官方文档已全部解决。在做本项目之前,建议新建一个conda环境,便于增添相关库以及避免库与库之间的冲突。
******欢迎读者留言交流******
版权声明:本文为博主weixin_47759089原创文章,版权归属原作者,如果侵权,请联系我们删除!
原文链接:https://blog.csdn.net/weixin_47759089/article/details/123221758