文章目录
- 一、pyecharts 地图绘制
- 1、pyecharts 地图绘制步骤
- 2、代码示例 – pyecharts 地图绘制
- 3、代码示例 – 为地图进行全局配置
pyecharts 画廊网站 : https://gallery.pyecharts.org/#/
- 在该网站可查看官方示例
一、pyecharts 地图绘制
1、pyecharts 地图绘制步骤
首先 , 导入 pyecharts 中的 Map 类 , 这是 地图绘制 的核心类 , 该类定义在 pyecharts.charts 中 ;
# 导入 pyecharts 模块中的 地图 Map 对象
from pyecharts.charts import Map
然后 , 创建 Map 类实例对象 , 该对象对应着一张地图 ;
# 创建地图对象
map = Map()
再后 , 准备要绘制的数据 , 数据类型是列表类型 , 列表元素是 元组 容器 , 元组中第一个元素是对应的 地图中的 地名 ;
# 要绘制的数据
data = [
    ("北京", 222),
    ("河北", 40),
    ("台湾", 8)
]
再后 , 调用 Map#add 函数 , 将数据设置到 Map 实例对象中 , 第一个参数是地图名称 , 第二个参数是 地图数据 , 第三个参数是地图类型 , 默认为 china ;
# 地图名称 : "中国地图"
# 地图数据 : data
# 地图类型 : "china"
map.add("中国地图", data, "china")
最后 , 调用 Map#render() 函数 , 生成地图 ;
# 生成图表
map.render()
运行程序 , 会生成一个 render.html 网页文件 ;
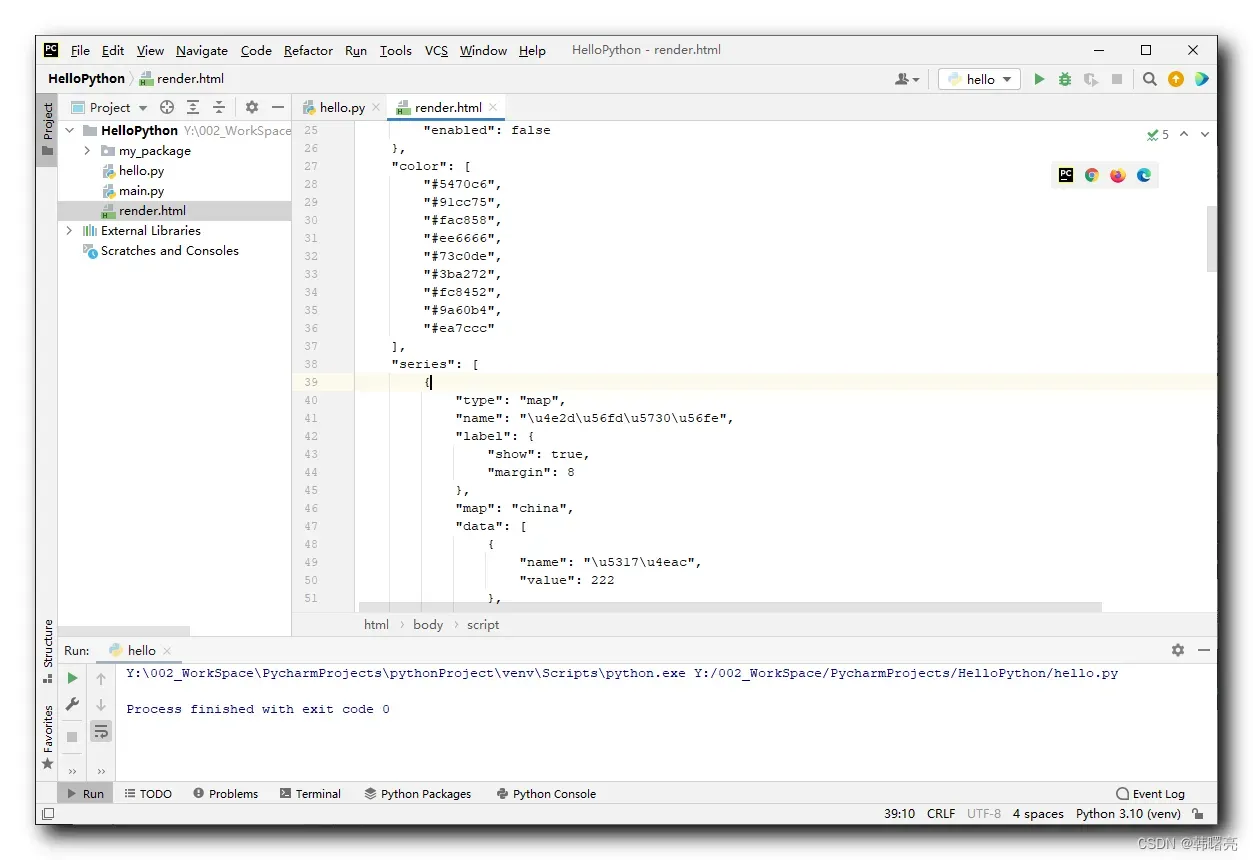
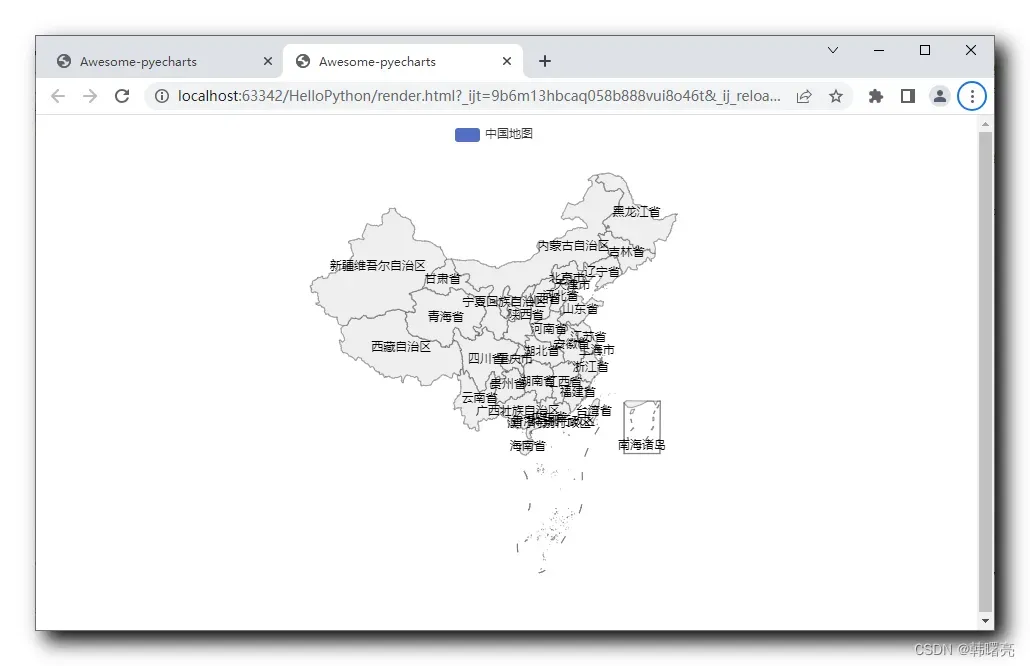
2、代码示例 – pyecharts 地图绘制
代码示例 :
"""
pyecharts 模块
"""

# 导入 pyecharts 模块中的 地图 Map 对象
from pyecharts.charts import Map

# 创建地图对象
map = Map()

# 要绘制的数据
data = [
    ("北京", 222),
    ("河北", 40),
    ("台湾", 8)
]

# 地图名称 : "中国地图"
# 地图数据 : data
# 地图类型 : "china"
map.add("中国地图", data, "china")


# 生成图表
map.render()
执行结果 : 生成的 render.html 如下 ;
<!DOCTYPE html>
<html>
<head>
    <meta charset="UTF-8">
    <title>Awesome-pyecharts</title>
                <script type="text/javascript" src="https://assets.pyecharts.org/assets/v5/echarts.min.js"></script>
            <script type="text/javascript" src="https://assets.pyecharts.org/assets/v5/maps/china.js"></script>

</head>
<body >
    <div id="6891137765714ca4a2f9012f78110f6e" class="chart-container" style="width:900px; height:500px; "></div>
    <script>
        var chart_6891137765714ca4a2f9012f78110f6e = echarts.init(
            document.getElementById('6891137765714ca4a2f9012f78110f6e'), 'white', {renderer: 'canvas'});
        var option_6891137765714ca4a2f9012f78110f6e = {
    "animation": true,
    "animationThreshold": 2000,
    "animationDuration": 1000,
    "animationEasing": "cubicOut",
    "animationDelay": 0,
    "animationDurationUpdate": 300,
    "animationEasingUpdate": "cubicOut",
    "animationDelayUpdate": 0,
    "aria": {
        "enabled": false
    },
    "color": [
        "#5470c6",
        "#91cc75",
        "#fac858",
        "#ee6666",
        "#73c0de",
        "#3ba272",
        "#fc8452",
        "#9a60b4",
        "#ea7ccc"
    ],
    "series": [
        {
            "type": "map",
            "name": "\u4e2d\u56fd\u5730\u56fe",
            "label": {
                "show": true,
                "margin": 8
            },
            "map": "china",
            "data": [
                {
                    "name": "\u5317\u4eac",
                    "value": 222
                },
                {
                    "name": "\u6cb3\u5317",
                    "value": 40
                },
                {
                    "name": "\u53f0\u6e7e",
                    "value": 8
                }
            ],
            "roam": true,
            "aspectScale": 0.75,
            "nameProperty": "name",
            "selectedMode": false,
            "zoom": 1,
            "zlevel": 0,
            "z": 2,
            "seriesLayoutBy": "column",
            "datasetIndex": 0,
            "mapValueCalculation": "sum",
            "showLegendSymbol": true,
            "emphasis": {}
        }
    ],
    "legend": [
        {
            "data": [
                "\u4e2d\u56fd\u5730\u56fe"
            ],
            "selected": {}
        }
    ],
    "tooltip": {
        "show": true,
        "trigger": "item",
        "triggerOn": "mousemove|click",
        "axisPointer": {
            "type": "line"
        },
        "showContent": true,
        "alwaysShowContent": false,
        "showDelay": 0,
        "hideDelay": 100,
        "enterable": false,
        "confine": false,
        "appendToBody": false,
        "transitionDuration": 0.4,
        "textStyle": {
            "fontSize": 14
        },
        "borderWidth": 0,
        "padding": 5,
        "order": "seriesAsc"
    }
};
        chart_6891137765714ca4a2f9012f78110f6e.setOption(option_6891137765714ca4a2f9012f78110f6e);
    </script>
</body>
</html>
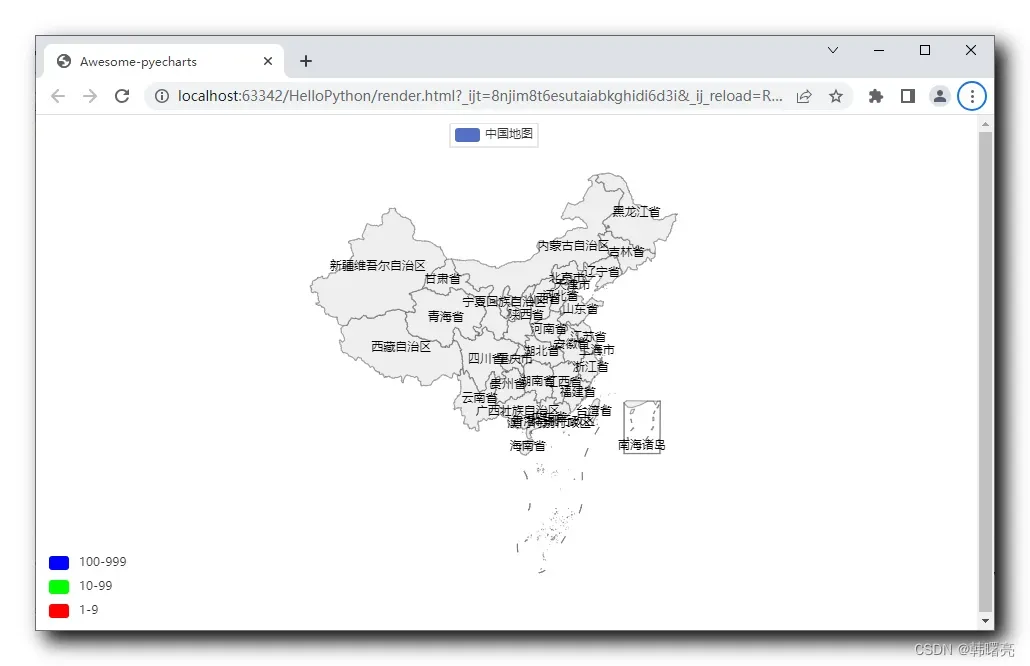
3、代码示例 – 为地图进行全局配置
首先 , 导入 视觉映射配置类 VisualMapOpts , 该类定义在 pyecharts.options 中 ;
# 导入 视觉映射配置 对象
from pyecharts.options import VisualMapOpts
然后 , 调用 Map#set_global_opts() 函数 , 设置全局配置 ; 使用关键字参数 , 指定 visualmap_opts 参数为 VisualMapOpts 类型实例对象 ;
- 在 VisualMapOpts 构造函数中 , 指定 is_piecewise 为 True , 允许手动校准范围 ;
- 在 VisualMapOpts 构造函数中 , 指定 pieces 参数 , 设置一个 列表 , 列表元素为字典 , 配置 范围参数 ;
# 设置全局配置
map.set_global_opts(
    visualmap_opts=VisualMapOpts(
        is_show=True,
        is_piecewise=True, # 允许手动校准范围
        pieces=[
            {"min": 1, "max": 9, "label": "1-9", "color": '#FF0000'},
            {"min": 10, "max": 99, "label": "10-99", "color": '#00FF00'},
            {"min": 100, "max": 999, "label": "100-999", "color": '#0000FF'}
        ]
    )
)
代码示例 :
"""
pyecharts 模块
"""

# 导入 pyecharts 模块中的 地图 Map 对象
from pyecharts.charts import Map

# 导入 视觉映射配置 对象
from pyecharts.options import VisualMapOpts

# 创建地图对象
map = Map()

# 要绘制的数据
data = [
    ("北京", 222),
    ("河北", 40),
    ("台湾", 8)
]

# 地图名称 : "中国地图"
# 地图数据 : data
# 地图类型 : "china"
map.add("中国地图", data, "china")

# 设置全局配置
map.set_global_opts(
    visualmap_opts=VisualMapOpts(
        is_show=True,
        is_piecewise=True, # 允许手动校准范围
        pieces=[
            {"min": 1, "max": 9, "label": "1-9", "color": '#FF0000'},
            {"min": 10, "max": 99, "label": "10-99", "color": '#00FF00'},
            {"min": 100, "max": 999, "label": "100-999", "color": '#0000FF'}
        ]
    )
)


# 生成图表
map.render()
执行结果 : 生成的 render.html 如下 , ( 仅做参考 )
<!DOCTYPE html>
<html>
<head>
    <meta charset="UTF-8">
    <title>Awesome-pyecharts</title>
                <script type="text/javascript" src="https://assets.pyecharts.org/assets/v5/echarts.min.js"></script>
            <script type="text/javascript" src="https://assets.pyecharts.org/assets/v5/maps/china.js"></script>

</head>
<body >
    <div id="4a3646c315624e1f8200eba34f73e11f" class="chart-container" style="width:900px; height:500px; "></div>
    <script>
        var chart_4a3646c315624e1f8200eba34f73e11f = echarts.init(
            document.getElementById('4a3646c315624e1f8200eba34f73e11f'), 'white', {renderer: 'canvas'});
        var option_4a3646c315624e1f8200eba34f73e11f = {
    "animation": true,
    "animationThreshold": 2000,
    "animationDuration": 1000,
    "animationEasing": "cubicOut",
    "animationDelay": 0,
    "animationDurationUpdate": 300,
    "animationEasingUpdate": "cubicOut",
    "animationDelayUpdate": 0,
    "aria": {
        "enabled": false
    },
    "color": [
        "#5470c6",
        "#91cc75",
        "#fac858",
        "#ee6666",
        "#73c0de",
        "#3ba272",
        "#fc8452",
        "#9a60b4",
        "#ea7ccc"
    ],
    "series": [
        {
            "type": "map",
            "name": "\u4e2d\u56fd\u5730\u56fe",
            "label": {
                "show": true,
                "margin": 8
            },
            "map": "china",
            "data": [
                {
                    "name": "\u5317\u4eac",
                    "value": 222
                },
                {
                    "name": "\u6cb3\u5317",
                    "value": 40
                },
                {
                    "name": "\u53f0\u6e7e",
                    "value": 8
                }
            ],
            "roam": true,
            "aspectScale": 0.75,
            "nameProperty": "name",
            "selectedMode": false,
            "zoom": 1,
            "zlevel": 0,
            "z": 2,
            "seriesLayoutBy": "column",
            "datasetIndex": 0,
            "mapValueCalculation": "sum",
            "showLegendSymbol": true,
            "emphasis": {}
        }
    ],
    "legend": [
        {
            "data": [
                "\u4e2d\u56fd\u5730\u56fe"
            ],
            "selected": {},
            "show": true,
            "padding": 5,
            "itemGap": 10,
            "itemWidth": 25,
            "itemHeight": 14,
            "backgroundColor": "transparent",
            "borderColor": "#ccc",
            "borderWidth": 1,
            "borderRadius": 0,
            "pageButtonItemGap": 5,
            "pageButtonPosition": "end",
            "pageFormatter": "{current}/{total}",
            "pageIconColor": "#2f4554",
            "pageIconInactiveColor": "#aaa",
            "pageIconSize": 15,
            "animationDurationUpdate": 800,
            "selector": false,
            "selectorPosition": "auto",
            "selectorItemGap": 7,
            "selectorButtonGap": 10
        }
    ],
    "tooltip": {
        "show": true,
        "trigger": "item",
        "triggerOn": "mousemove|click",
        "axisPointer": {
            "type": "line"
        },
        "showContent": true,
        "alwaysShowContent": false,
        "showDelay": 0,
        "hideDelay": 100,
        "enterable": false,
        "confine": false,
        "appendToBody": false,
        "transitionDuration": 0.4,
        "textStyle": {
            "fontSize": 14
        },
        "borderWidth": 0,
        "padding": 5,
        "order": "seriesAsc"
    },
    "title": [
        {
            "show": true,
            "target": "blank",
            "subtarget": "blank",
            "padding": 5,
            "itemGap": 10,
            "textAlign": "auto",
            "textVerticalAlign": "auto",
            "triggerEvent": false
        }
    ],
    "visualMap": {
        "show": true,
        "type": "piecewise",
        "min": 0,
        "max": 100,
        "inRange": {
            "color": [
                "#50a3ba",
                "#eac763",
                "#d94e5d"
            ]
        },
        "calculable": true,
        "inverse": false,
        "splitNumber": 5,
        "hoverLink": true,
        "orient": "vertical",
        "padding": 5,
        "showLabel": true,
        "itemWidth": 20,
        "itemHeight": 14,
        "borderWidth": 0,
        "pieces": [
            {
                "min": 1,
                "max": 9,
                "label": "1-9",
                "color": "#FF0000"
            },
            {
                "min": 10,
                "max": 99,
                "label": "10-99",
                "color": "#00FF00"
            },
            {
                "min": 100,
                "max": 999,
                "label": "100-999",
                "color": "#0000FF"
            }
        ]
    }
};
        chart_4a3646c315624e1f8200eba34f73e11f.setOption(option_4a3646c315624e1f8200eba34f73e11f);
    </script>
</body>
</html>
文章出处登录后可见!
已经登录?立即刷新