文章目录
- Logistic(Logistic Regression,LR)回归
- 原理讲解
- 参数计算
- python代码实现
- 生成数据集
- 不使用其他库实现
- 定义激活函数(标准Logistic函数即Sigmoid函数)
- 定义LogisticRegression类
- 调用LogisticRegression类解决分类问题
- 使用sklearn库
- 拓展
Logistic(Logistic Regression,LR)回归
原理讲解
在模式识别问题中,所关心的量是分类,比如是否会患有某种疾病,这时就不能用简单的线性回归来完成这个问题了。为了解决次问题,我们引入了非线性激活函数来预测类别标签的后验概率
,其中
,函数
的作用是把线性函数的值域从实数区间挤压到0和1之间
在Logistic回归中,激活函数的表达式为:
标签的后验概率为
这里,和
分别为D+1维的增广特征向量与增广权重向量
标签的后验概率为
对式(1)进行变换后得到上式左边为线性函数,右边为正反后验概率比值(几率)取对数,因此Logistic回归也称为对数几率回归
参数计算
LR采用交叉熵作为损失函数,使用梯度下降进行优化
假设存在N个训练样本,采用LR回归模型对每个样本
进行预测,输出其标签为1的后验概率,记为
,即
由于,样本
的真实条件概率可以表示为
采用交叉熵损失函数,其风险函数为
风险函数关于参数的偏导数为
由此我们可以采用梯度下降法更新参数最终得到合适的参数
python代码实现
生成数据集
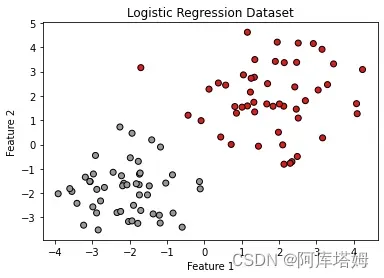
我们通过下面的代码自行生成一个样本数量为100的数据集
import numpy as np
import matplotlib.pyplot as plt

# 设置随机种子,以便结果可复现
np.random.seed(42)

# 生成随机数据
# 两个特征的均值和方差
mean_1 = [2, 2]
cov_1 = [[2, 0], [0, 2]]
mean_2 = [-2, -2]
cov_2 = [[1, 0], [0, 1]]

# 生成类别1的样本
X1 = np.random.multivariate_normal(mean_1, cov_1, 50)
y1 = np.zeros(50)

# 生成类别2的样本
X2 = np.random.multivariate_normal(mean_2, cov_2, 50)
y2 = np.ones(50)

# 合并样本和标签
X = np.concatenate((X1, X2), axis=0)
y = np.concatenate((y1, y2))

# 绘制散点图
plt.scatter(X[:, 0], X[:, 1], c=y, cmap=plt.cm.Set1, edgecolor='k')
plt.xlabel('Feature 1')
plt.ylabel('Feature 2')
plt.title('Logistic Regression Dataset')
plt.show()
运行结果如下图所示

不使用其他库实现
定义激活函数(标准Logistic函数即Sigmoid函数)
def sigmoid(x):
    if x>0:
        return 1.0/(1.0+np.exp(-x))
    else:
        return np.exp(x)/(1.0+np.exp(x))
定义LogisticRegression类
class LogisticRegression:
    def __init__(self, learning_rate=0.01, num_iterations=1000):
        self.learning_rate = learning_rate
        self.num_iterations = num_iterations
        self.weights = None
        self.bias = None

    def fit(self, X, y):
        num_samples, num_features = X.shape

        # 初始化权重和偏置
        self.weights = np.zeros(num_features)
        self.bias = 0

        # 梯度下降
        for _ in range(self.num_iterations):
            linear_model = np.dot(X, self.weights) + self.bias
            y_pred = sigmoid(linear_model)

            dw = (1 / num_samples) * np.dot(X.T, (y_pred - y))
            db = (1 / num_samples) * np.sum(y_pred - y)

            self.weights -= self.learning_rate * dw
            self.bias -= self.learning_rate * db

    def predict_prob(self, X):
        linear_model = np.dot(X, self.weights) + self.bias
        y_pred = sigmoid(linear_model)
        return y_pred

    def predict(self, X, threshold=0.5):
        y_pred_prob = self.predict_prob(X)
        y_pred = np.zeros_like(y_pred_prob)
        y_pred[y_pred_prob >= threshold] = 1
        return y_pred
调用LogisticRegression类解决分类问题
# 创建 Logistic 回归模型
    logreg = LogisticRegression()

    # 训练模型
    logreg.fit(X, y)

    # 预测样本
    X_new = np.array([[2.5, 2.5], [-6.0, -4.0]])
    y_pred_prob = logreg.predict_prob(X_new)
    y_pred = logreg.predict(X_new)

    print("Predicted Probabilities:", y_pred_prob)
    print("Predicted Labels:", y_pred)
输出结果为

使用sklearn库
我们可以通过使用sklearn库来简洁地实现LR
import numpy as np
from sklearn.model_selection import train_test_split
from sklearn.linear_model import LogisticRegression
from sklearn.metrics import accuracy_score

#所使用数据集同上X,y

# 划分训练集和测试集
X_train, X_test, y_train, y_test = train_test_split(X, y, test_size=0.2, random_state=42)

# 创建Logistic回归模型
logreg = LogisticRegression()

# 训练模型
logreg.fit(X_train, y_train)

# 预测测试集
y_pred = logreg.predict(X_test)

# 计算预测准确率
accuracy = accuracy_score(y_test, y_pred)
print("Accuracy:", accuracy)
最终测试集上计算得到的准确率accuracy为1,可见该分类器的效果非常好
拓展
logistic回归可以用于分类非线性可分的数据。尽管logistic回归本身是一个线性分类器,但可以通过引入多项式特征、交互特征、组合特征等方法来扩展其能力,从而处理非线性的分类问题。
具体来说,可以通过特征工程的方式将原始特征进行变换,以引入非线性关系。例如,可以通过添加多项式特征,将原始特征的高阶项加入到模型中,例如原始特征的平方项、立方项等。还可以引入交互特征,将不同特征之间的乘积或分割点(例如,做差或做除)作为新的特征。
通过引入这些非线性特征,logistic回归可以更好地捕捉到数据中的非线性关系,从而能够更好地分类非线性可分的数据。需要注意的是,在引入非线性特征时,可能需要进行正则化或其他模型调优技巧,以避免过拟合问题。
文章出处登录后可见!
