matplotlib.pyplot.hist 的官方文档:https://matplotlib.org/stable/api/_as_gen/matplotlib.pyplot.hist.html
matplotlib.pyplot.hist
这个方法使用 numpy.histogram 首先将 x 中的数据分桶并统计每个桶中的元素数量,接着使用条形图绘制这个分布。
函数参数、含义及样例如下:
from matplotlib import pyplot as plt
import numpy as np
参数列表及样例
x : 数据集对象(必填)
- (n,) array or sequence of (n,) arrays
Input values, this takes either a single array or a sequence of arrays which are not required to be of the same length.
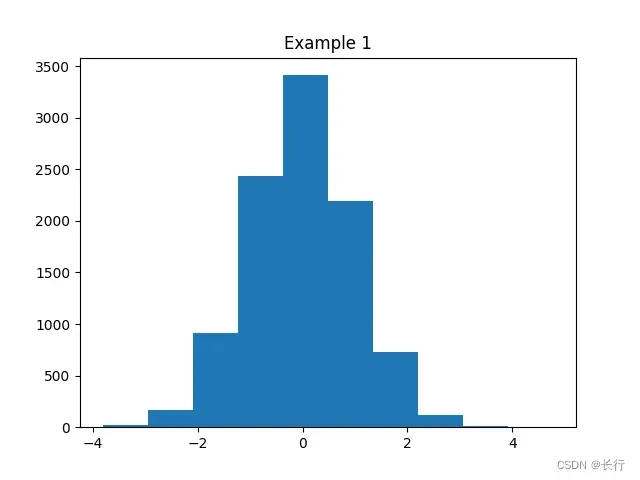
样例 1:当 x 为多维向量时,绘制多维向量的直方图
plt.hist(np.random.randn(10000))
plt.title("Example 1")
plt.show()
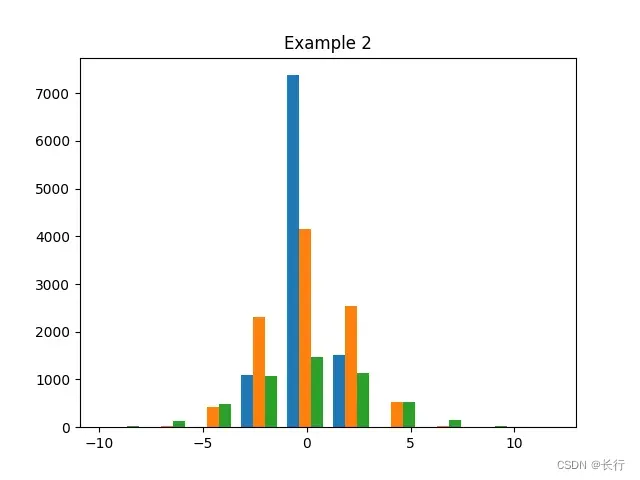
样例 2:当 x 为 m 个多维向量的列表时(各个向量的长度不需要全部相同),将在同一个轴上分别绘制 m 个多维向量的直方图
plt.hist([
    np.random.randn(10000),
    2 * np.random.randn(10000),
    3 * np.random.randn(5000)
])
plt.title("Example 2")
plt.show()
bins : 分桶数 / 分桶数值(非必填)
- int or sequence or str, default:
rcParams["hist.bins"](default:10)
If bins is an integer, it defines the number of equal-width bins in the range.
If bins is a sequence, it defines the bin edges, including the left edge of the first bin and the right edge of the last bin; in this case, bins may be unequally spaced. All but the last (righthand-most) bin is half-open. In other words, if bins is:
[1, 2, 3, 4]
then the first bin is [1, 2) (including 1, but excluding 2) and the second [2, 3). The last bin, however, is [3, 4], which includes 4.
If bins is a string, it is one of the binning strategies supported by numpy.histogram_bin_edges: ‘auto’, ‘fd’, ‘doane’, ‘scott’, ‘stone’, ‘rice’, ‘sturges’, or ‘sqrt’.
此参数用于传给
numpy.histogram的bins形参,详情见numpy.histogram_bin_edges的文档。
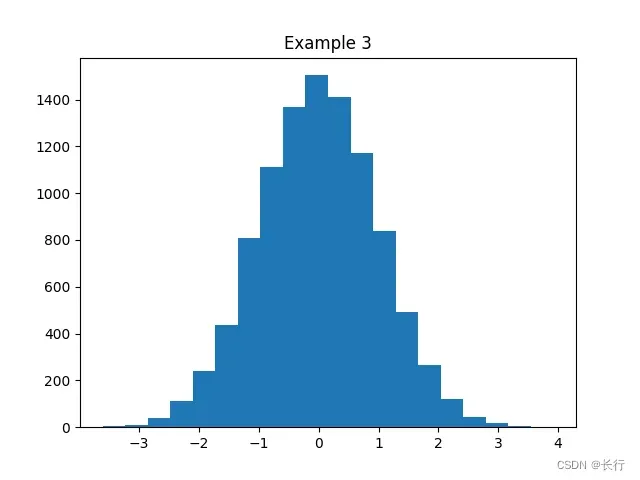
样例 3:当 bins 传入整数时,会分为 bins 数量的等宽桶
plt.hist(np.random.randn(10000), bins=20)
plt.title("Example 3")
plt.show()
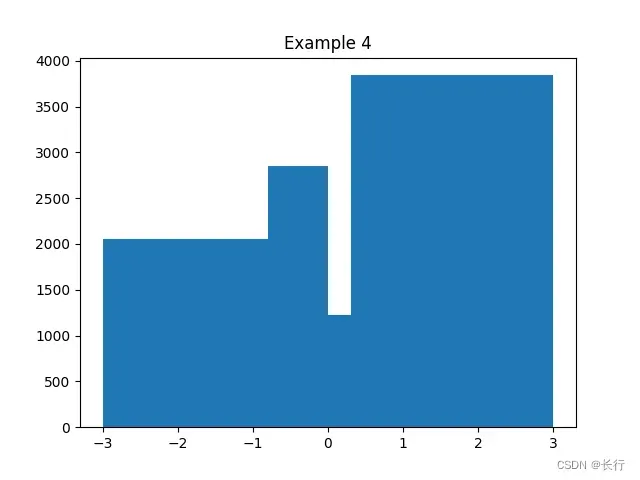
样例 4:当 bins 传入序列时,会视作每个桶的边界
plt.hist(np.random.randn(10000), bins=[-3, -0.8, 0, 0.3, 3])
plt.title("Example 4")
plt.show()
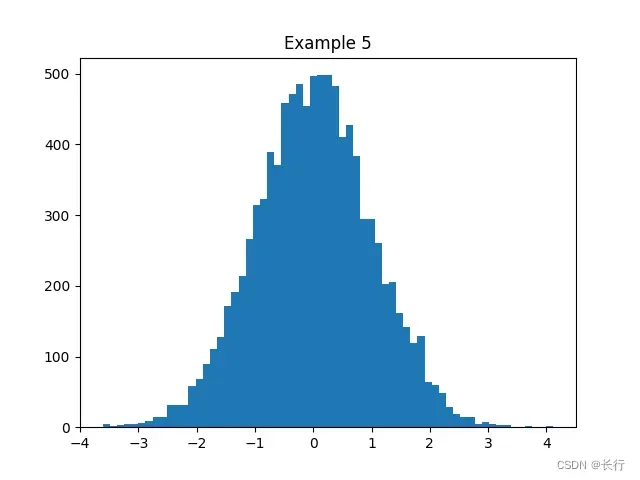
样例 5:当传入字符串时,例如 “fd”
plt.hist(np.random.randn(10000), bins="fd")
plt.title("Example 5")
plt.show()
range : 桶的下界和上界(非必填)
- tuple or None, default: None
The lower and upper range of the bins. Lower and upper outliers are ignored. If not provided, range is (x.min(), x.max()). Range has no effect if bins is a sequence.
If bins is a sequence or range is specified, autoscaling is based on the specified bin range instead of the range of x.
此参数用于传给
numpy.histogram的range形参,详情见numpy.histogram_bin_edges的文档。
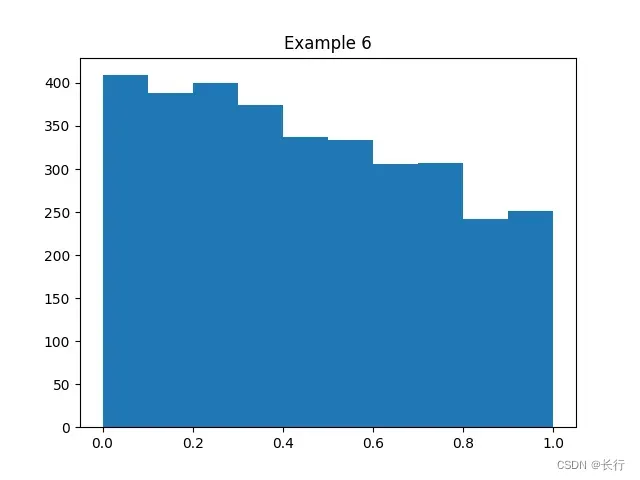
样例 6:使用 range 参数
plt.hist(np.random.randn(10000), range=(0, 1))
plt.title("Example 6")
plt.show()
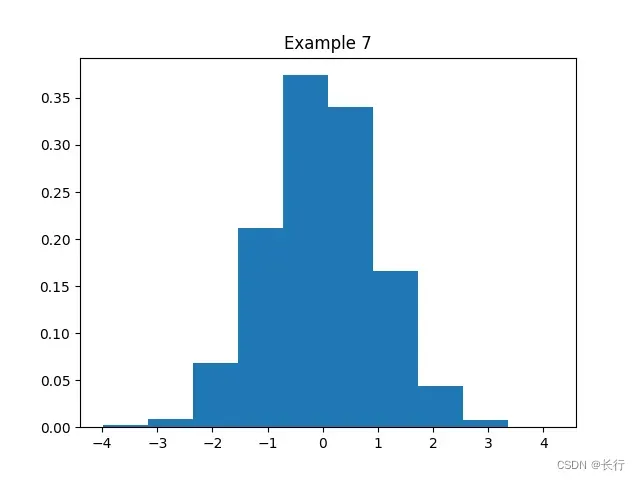
density : y 轴是否使用频率(非必填)
- bool, default: False
If True, draw and return a probability density: each bin will display the bin’s raw count divided by the total number of counts and the bin width (density = counts / (sum(counts) * np.diff(bins))), so that the area under the histogram integrates to 1 (np.sum(density * np.diff(bins)) == 1).
If stacked is also True, the sum of the histograms is normalized to 1.
样例 7:显示频率
plt.hist(np.random.randn(10000), density=True)
plt.title("Example 7")
plt.show()
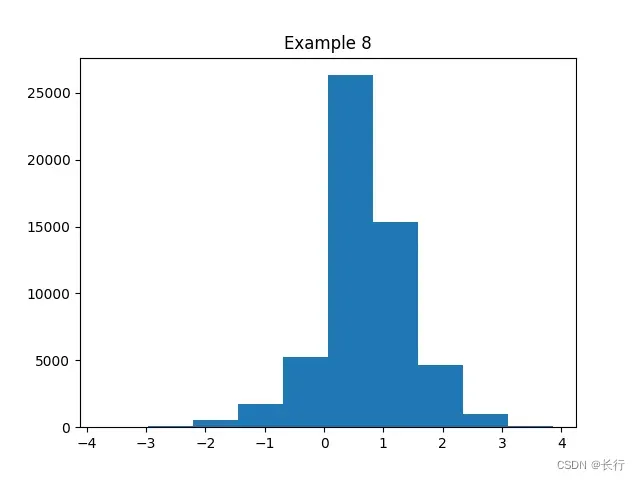
weight :是否为元素赋予权重
- (n,) array-like or None, default: None
An array of weights, of the same shape as x. Each value in x only contributes its associated weight towards the bin count (instead of 1). If density is True, the weights are normalized, so that the integral of the density over the range remains 1.
样例 8:配置权重
x = np.random.randn(10000)
weights = 10 * (x >= 0) + 1 * (x < 0)
plt.hist(x, weights=weights)
plt.title("Example 8")
plt.show()
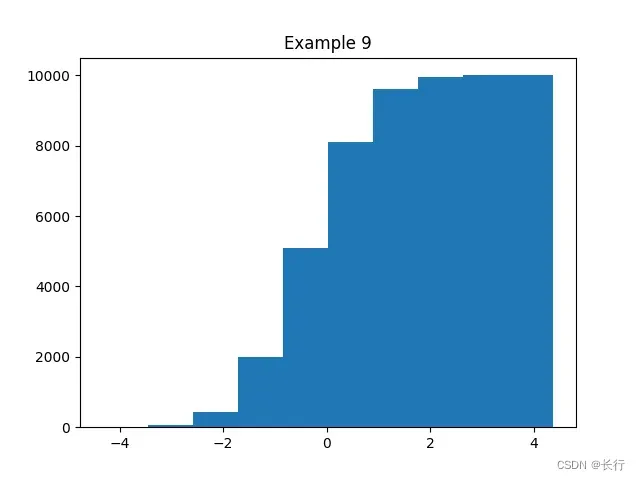
cumulative : 是否绘制累加直方图
- bool or -1, default: False
If True, then a histogram is computed where each bin gives the counts in that bin plus all bins for smaller values. The last bin gives the total number of datapoints.
If density is also True then the histogram is normalized such that the last bin equals 1.
If cumulative is a number less than 0 (e.g., -1), the direction of accumulation is reversed. In this case, if density is also True, then the histogram is normalized such that the first bin equals 1.
样例 9:累加直方图
plt.hist(np.random.randn(10000), cumulative=True)
plt.title("Example 9")
plt.show()
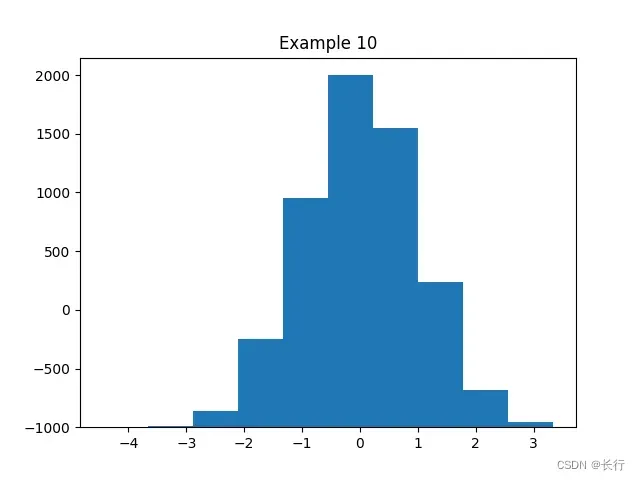
bottom : 每个桶的初始值
- array-like, scalar, or None, default: None
Location of the bottom of each bin, i.e. bins are drawn from bottom to bottom + hist(x, bins) If a scalar, the bottom of each bin is shifted by the same amount. If an array, each bin is shifted independently and the length of bottom must match the number of bins. If None, defaults to 0.
样例 10:统一的桶初始值
plt.hist(np.random.randn(10000), bottom=-1000)
plt.title("Example 10")
plt.show()
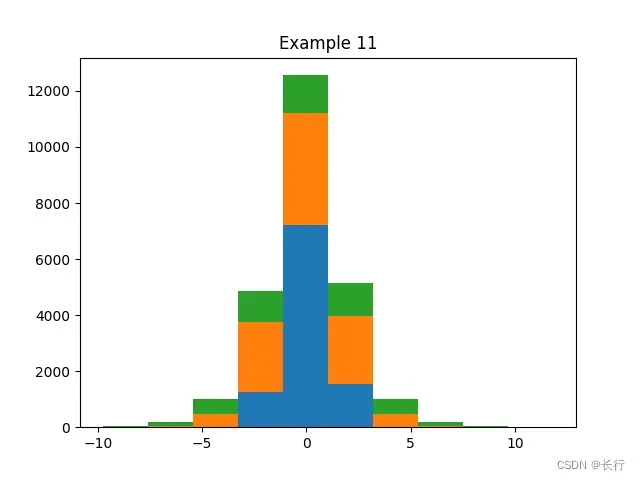
histype : 多个数据的直方图类型
- {‘bar’, ‘barstacked’, ‘step’, ‘stepfilled’}, default: ‘bar’
The type of histogram to draw.
- ‘bar’ is a traditional bar-type histogram. If multiple data are given the bars are arranged side by side.
- ‘barstacked’ is a bar-type histogram where multiple data are stacked on top of each other.
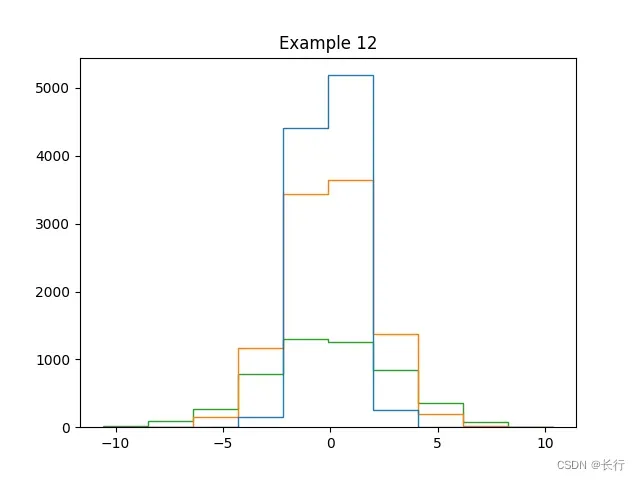
- ‘step’ generates a lineplot that is by default unfilled.
- ‘stepfilled’ generates a lineplot that is by default filled.
样例 11:barstacked 类型直方图
plt.hist([np.random.randn(10000), 2 * np.random.randn(10000), 3 * np.random.randn(5000)],
         histtype="barstacked")
plt.title("Example 11")
plt.show()
样例 12:step 类型直方图
plt.hist([np.random.randn(10000), 2 * np.random.randn(10000), 3 * np.random.randn(5000)],
         histtype="step")
plt.title("Example 12")
plt.show()
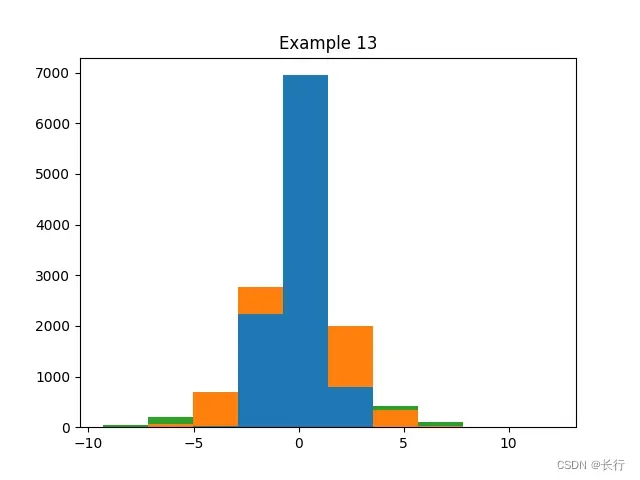
样例 13:stepfilled 类型直方图
plt.hist([np.random.randn(10000), 2 * np.random.randn(10000), 3 * np.random.randn(5000)],
         histtype="stepfilled")
plt.title("Example 13")
plt.show()
align : 对齐方式
- {‘left’, ‘mid’, ‘right’}, default: ‘mid’
The horizontal alignment of the histogram bars.
- ‘left’: bars are centered on the left bin edges.
- ‘mid’: bars are centered between the bin edges.
- ‘right’: bars are centered on the right bin edges.
orientation : 横向 / 纵向柱状图
- {‘vertical’, ‘horizontal’}, default: ‘vertical’
If ‘horizontal’, barh will be used for bar-type histograms and the bottom kwarg will be the left edges.
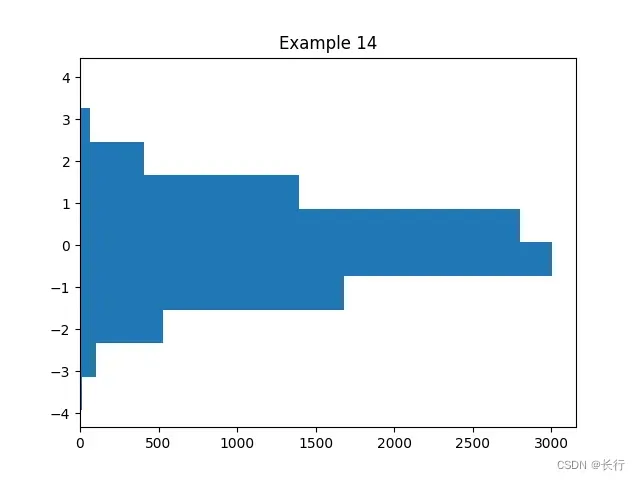
样例 14:横向直方图
plt.hist(np.random.randn(10000), orientation="horizontal")
plt.title("Example 14")
plt.show()
rwidth : 条形图的相对宽度
- float or None, default: None
The relative width of the bars as a fraction of the bin width. If None, automatically compute the width.
Ignored if histtype is ‘step’ or ‘stepfilled’.
log : 是否对 y 轴使用对数缩放
- bool, default: False
If True, the histogram axis will be set to a log scale.
color : 桶的颜色
- color or array-like of colors or None, default: None
Color or sequence of colors, one per dataset. Default (None) uses the standard line color sequence.
label : 标签
- str or None, default: None
String, or sequence of strings to match multiple datasets. Bar charts yield multiple patches per dataset, but only the first gets the label, so that legend will work as expected.
stacked : 是否绘制堆积图
- bool, default: False
If True, multiple data are stacked on top of each other If False multiple data are arranged side by side if histtype is ‘bar’ or on top of each other if histtype is ‘step’.
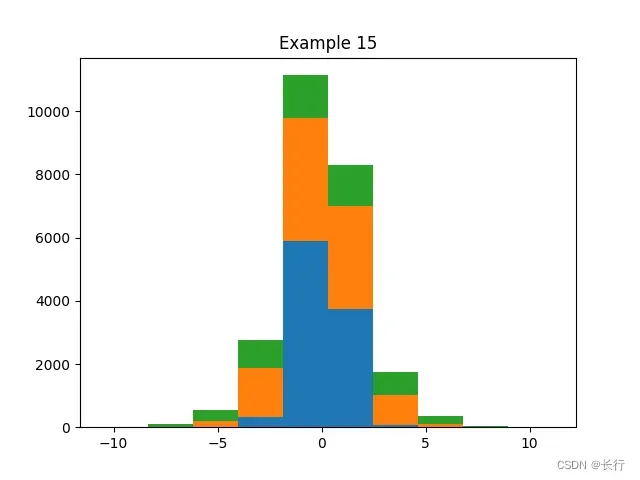
样例 15:绘制堆积图
plt.hist([np.random.randn(10000), 2 * np.random.randn(10000), 3 * np.random.randn(5000)],
         stacked=True)
plt.title("Example 15")
plt.show()
返回值列表
>>> n, bins, patches = plt.hist([np.random.randn(10000), 2 * np.random.randn(10000), 3 * np.random.randn(5000)])
>>> n
[[0.000e+00 0.000e+00 0.000e+00 6.900e+01 3.325e+03 6.092e+03 5.140e+02
  0.000e+00 0.000e+00 0.000e+00]
 [0.000e+00 2.000e+00 9.700e+01 9.420e+02 3.086e+03 3.797e+03 1.773e+03
  2.830e+02 2.000e+01 0.000e+00]
 [1.000e+01 5.500e+01 2.200e+02 7.170e+02 1.188e+03 1.341e+03 9.130e+02
  4.200e+02 1.130e+02 2.300e+01]]
>>> bins
[-10.7843734   -8.71395108  -6.64352876  -4.57310643  -2.50268411
  -0.43226179   1.63816053   3.70858286   5.77900518   7.8494275
   9.91984982]
>>> patches
<a list of 3 BarContainer objects>
n : 每一个堆的样本数
- array or list of arrays
The values of the histogram bins. See density and weights for a description of the possible semantics. If input x is an array, then this is an array of length nbins. If input is a sequence of arrays [data1, data2, ...], then this is a list of arrays with the values of the histograms for each of the arrays in the same order. The dtype of the array n (or of its element arrays) will always be float even if no weighting or normalization is used.
bins : 堆的边界
- array
The edges of the bins. Length nbins + 1 (nbins left edges and right edge of last bin). Always a single array even when multiple data sets are passed in.
patches : BarContainer 对象的列表
BarContaineror list of a singlePolygonor list of such objects
Container of individual artists used to create the histogram or list of such containers if there are multiple input datasets.
文章出处登录后可见!