1.爬取广惠河深2022-2024年的天气数据
import requests     # 发送请求要用的模块 需要额外安装的
import parsel
import csv

f = open('广-惠-河-深天气.csv', mode='a', encoding='utf-8', newline='')
csv_writer = csv.writer(f)
csv_writer.writerow(['日期', '最高温度', '最低温度', '天气', '风向', '城市'])
city_list = [72049, 59287,59293,59493]
for city in city_list:
    city_name = ''
    if city == 72049:
        city_name = '惠州'
    elif city == 59287:
        city_name = '广州'
    elif city == 59293:
        city_name = '河源'
    elif city == 59493:
        city_name = '深圳'
    for year in range(2022, 2024):
        for month in range(1, 13):
            url = f'https://tianqi.2345.com/Pc/GetHistory?areaInfo%5BareaId%5D={city}&areaInfo%5BareaType%5D=2&date%5Byear%5D={year}&date%5Bmonth%5D={month}'
            # 1. 发送请求
            response = requests.get(url=url)
            # 2. 获取数据
            html_data = response.json()['data']
            # 3. 解析数据
            select = parsel.Selector(html_data)
            trs = select.css('.history-table tr')   # 拿到31个tr
            for tr in trs[1:]:                      # 第一个表头不要
                tds = tr.css('td::text').getall()   # 针对每个tr进行提取 取出所有的td里面的内容
                tds.append(city_name)               # 把城市追加到列表里面
                print(tds)
                # 4. 保存数据
                csv_writer.writerow(tds)
爬取的数据如下图所示

2.读取csv文件
import pandas as pd
data = pd.read_csv('广-惠-河-深天气.csv')
data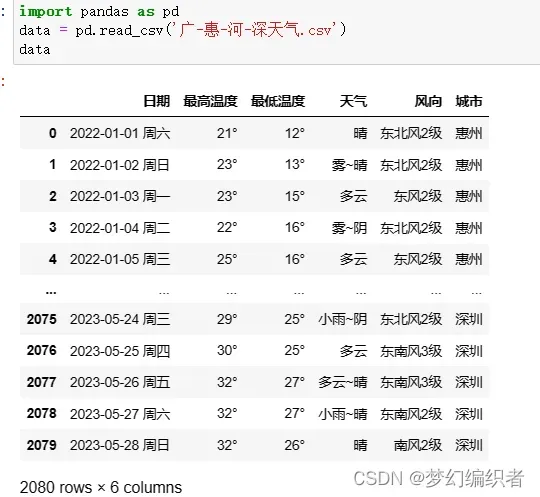
3.去除多余字符
#去除多余字符
data[['最高温度','最低温度']] = data[['最高温度','最低温度']].apply(lambda x: x.str.replace('°','').replace('', '0'))
data.head()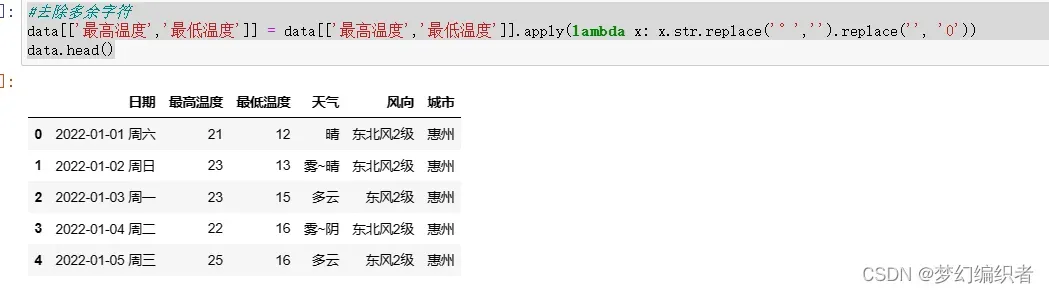
4.分割星期和日期
#分割日期与星期
data[['日期','星期']] = data['日期'].str.split(' ',expand=True,n=1)
data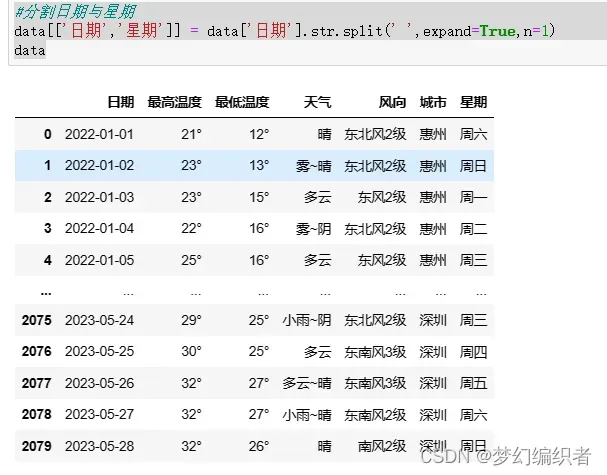
5.筛选出城市数据子集。其中包含了四个城市在不同天气下的天数统计结果。
# 按城市和天气分组,并计算每组的天数
grouped = data.groupby(['城市', '天气']).size().reset_index(name='天数')

# 将结果按城市分为4个DataFrame
gz_weather = grouped[grouped['城市'] == '广州']
hy_weather = grouped[grouped['城市'] == '河源']
hz_weather = grouped[grouped['城市'] == '惠州']
sz_weather = grouped[grouped['城市'] == '深圳']
gz_weatherhy_weatherhz_weathersz_weather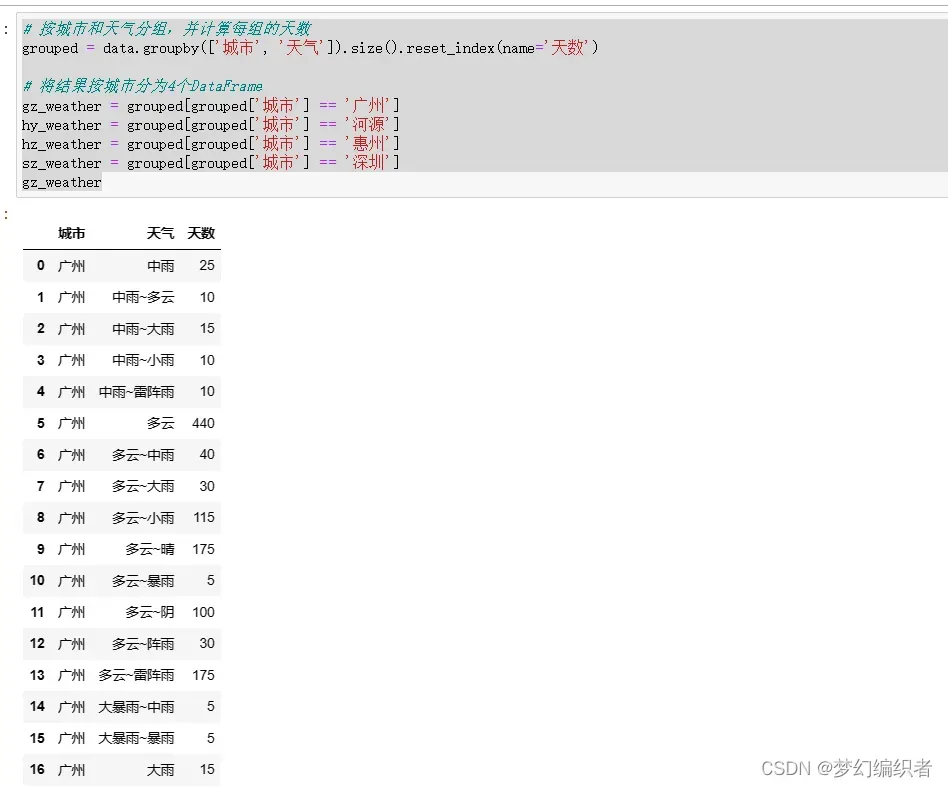

6.将原有的天气类型按照关键字划分
# 定义一个函数,将原有的天气类型按照关键字划分
def classify_weather(weather):
    if '多云' in weather:
        return '多云'
    elif '晴' in weather:
        return '晴'
    elif '阴' in weather:
        return '阴'
    elif '大雨' in weather:
        return '雨'
    elif '中雨' in weather:
        return '雨'
    elif '小雨' in weather:
        return '雨'
    elif '雷阵雨' in weather:
        return '雨'
    elif '雾' in weather:
        return '雾'
    else:
        return '其他'

# 将原有的天气类型按照关键字划分,并存进新的 DataFrame 中
new_data = data[['城市', '天气']].copy()
new_data['新天气'] = new_data['天气'].apply(classify_weather)
new_data
7.对城市的天气数据按照新天气列分组后,计算每一种天气的天数,然后将“天气”列名改为“天数”得到的数据框。
# 按照城市和新天气列进行分组,并计算每一种天气的天数
count_data = new_data.groupby(['城市', '新天气'])['天气'].count().reset_index()
# 根据条件筛选出符合要求的行
df1 = count_data.loc[count_data['城市'] == '广州']
df2 = count_data.loc[count_data['城市'] == '河源']
df3 = count_data.loc[count_data['城市'] == '惠州']
df4 = count_data.loc[count_data['城市'] == '深圳']
# 将“天气”列名改为“天数”
df5 = df1.rename(columns={'天气': '天数'})
df6 = df2.rename(columns={'天气': '天数'})
df7 = df3.rename(columns={'天气': '天数'})
df8 = df4.rename(columns={'天气': '天数'})
# 输出结果
df5.to_csv('df5.csv',index=False)
上面输出结果保存到csv文件中,如果要查看可以输出df5 查看数据

8.筛选出每个城市平均温度等于最高温度和最低温度平均值的数据
# 筛选出平均温度等于最高温度和最低温度平均值的数据
data1 = data[(data['平均温度'] == (data['最高温度'] + data['最低温度']) / 2)]

data_AB = data1[(data1['城市'] == '广州') | (data1['城市'] == '深圳') | (data1['城市'] == '河源') | (data1['城市'] == '惠州')]

#将日期转换为月份并赋值给新的列
data_AB['月份'] = pd.to_datetime(data_AB['日期']).dt.month

#按照城市和月份分组,计算每组的平均气温
grouped_AB = data_AB.groupby(['城市', '月份'])['平均温度'].mean().reset_index()

#按照城市和月份排序
grouped_AB = grouped_AB.sort_values(['城市', '月份'])

#打印结果
grouped_AB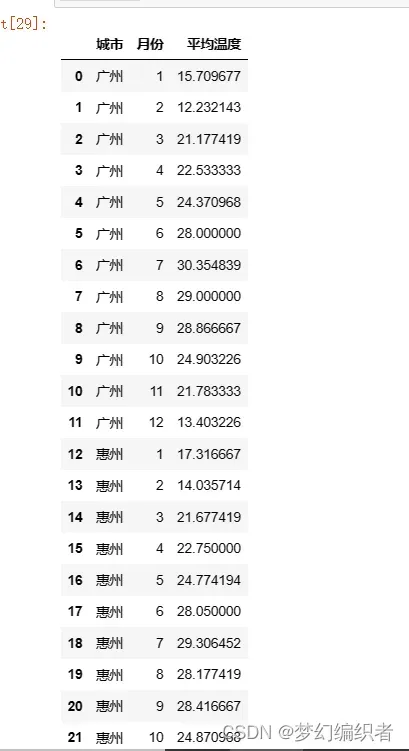
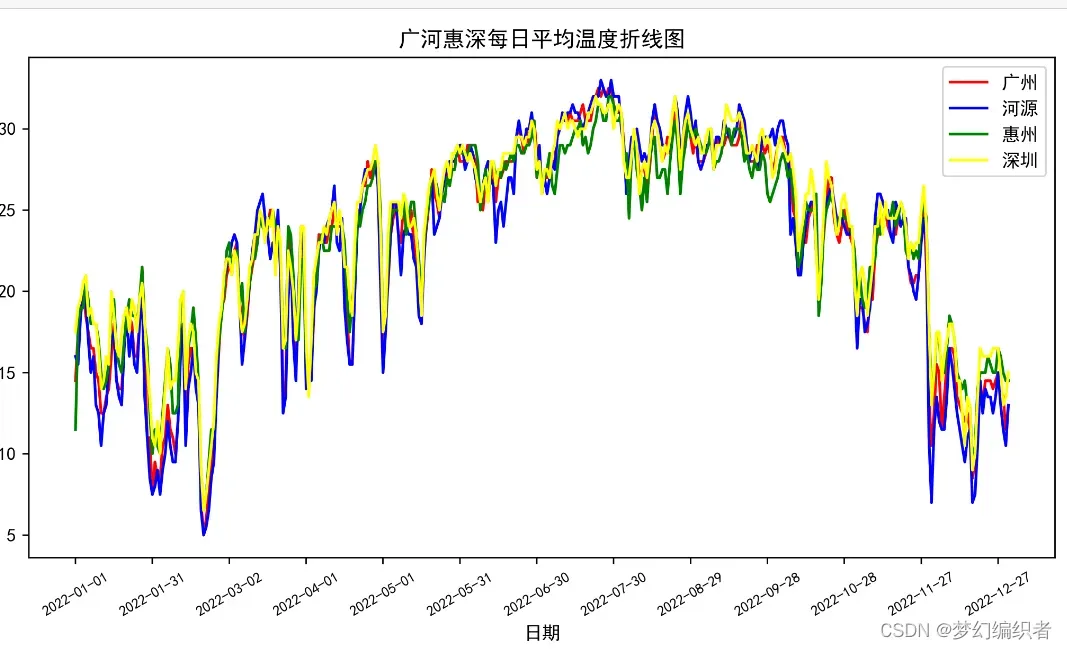
9.绘制广州、河源、惠州和深圳每日平均温度的折线图
import matplotlib as mpl
import matplotlib.pyplot as plt
import matplotlib.ticker as ticker
# 筛选出广州和湛江的数据
gz_data = data[data['城市'] == '广州']
hy_data = data[data['城市'] == '河源']
hz_data = data[data['城市'] == '惠州']
sz_data = data[data['城市'] == '深圳']

# 提取日期和平均温度数据
x = gz_data['日期']
y1 = gz_data['平均温度']
y2 = hy_data['平均温度']
y3 = hz_data['平均温度']
y4 = sz_data['平均温度']

# 绘制折线图
plt.figure(dpi=500, figsize=(10, 5))
plt.title("广河惠深每日平均温度折线图")
plt.plot(x, y1, color='red', label='广州')
plt.plot(x, y2, color='blue', label='河源')
plt.plot(x,y3,color='green',label='惠州')
plt.plot(x,y4,color='yellow',label='深圳')
# 获取图的坐标信息
coordinates = plt.gca()
# 设置x轴每个刻度的间隔天数
xLocator = mpl.ticker.MultipleLocator(30)
coordinates.xaxis.set_major_locator(xLocator)
# 将日期旋转30°
plt.xticks(rotation=30)
plt.xticks(fontsize=8)
plt.ylabel("温度(℃)")
plt.xlabel("日期")
plt.legend()
plt.savefig("广河惠深每日平均温度折线图.png")
plt.show()
10.绘制城市为广州、惠州、深圳、河源的月平均气温数据
data_GZ_HZ_SZ_HY = grouped_AB[(grouped_AB['城市'] == '广州') | (grouped_AB['城市'] == '惠州') | (grouped_AB['城市'] == '深圳') | (grouped_AB['城市'] == '河源')]

#绘制折线图
fig, ax = plt.subplots()
for city in ['广州', '惠州', '深圳', '河源']:
    ax.plot(data_GZ_HZ_SZ_HY[data_GZ_HZ_SZ_HY['城市'] == city]['月份'], data_GZ_HZ_SZ_HY[data_GZ_HZ_SZ_HY['城市'] == city]['平均温度'], label=city)

#设置图例和标题
ax.legend()
ax.set_title('广州、惠州、深圳、河源每月气温折线图')

#显示图形
plt.show()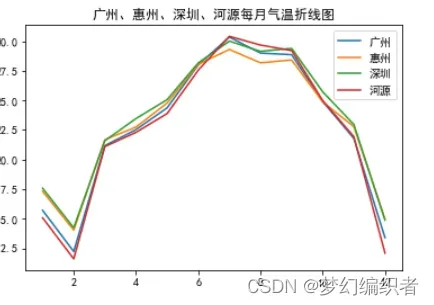
11.绘制四个城市数据对比
import matplotlib.pyplot as plt

#创建一个画布
fig, ax = plt.subplots(figsize=(10, 5))

#绘制广州各类天气条形图
ax.bar(df5['新天气'], df5['天数'], width=0.2, label='广州')

#绘制惠州各类天气条形图
ax.bar(df7['新天气'], df7['天数'], width=0.2, label='惠州', alpha=0.7)

#绘制河源各类天气条形图
ax.bar(df6['新天气'], df6['天数'], width=0.2, label='河源', alpha=0.7)

#绘制深圳各类天气条形图
ax.bar(df8['新天气'], df8['天数'], width=0.2, label='深圳', alpha=0.7)

#设置图例
ax.legend()

#设置 x 轴标签和标题
ax.set_xlabel('天气类型')
ax.set_ylabel('天数')
ax.set_title('广州、惠州、河源、深圳各类天气天数对比')

#显示图表
plt.show() 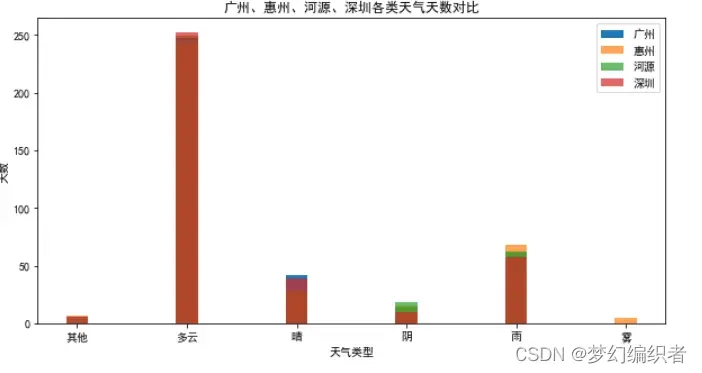
12.各个城市天气占比
import pandas as pd
from pyecharts.charts import Pie
from pyecharts import options as opts

# 读取csv文件并转换为列表格式
df = pd.read_csv('df5.csv')
data_list = df[['新天气', '天数']].values.tolist()

# 生成饼图
pie = Pie()
pie.add("", data_list)
pie.set_global_opts(title_opts=opts.TitleOpts(title="广州各类天气天数占比"))
pie.set_series_opts(label_opts=opts.LabelOpts(formatter="{b}"))
pie.render_notebook()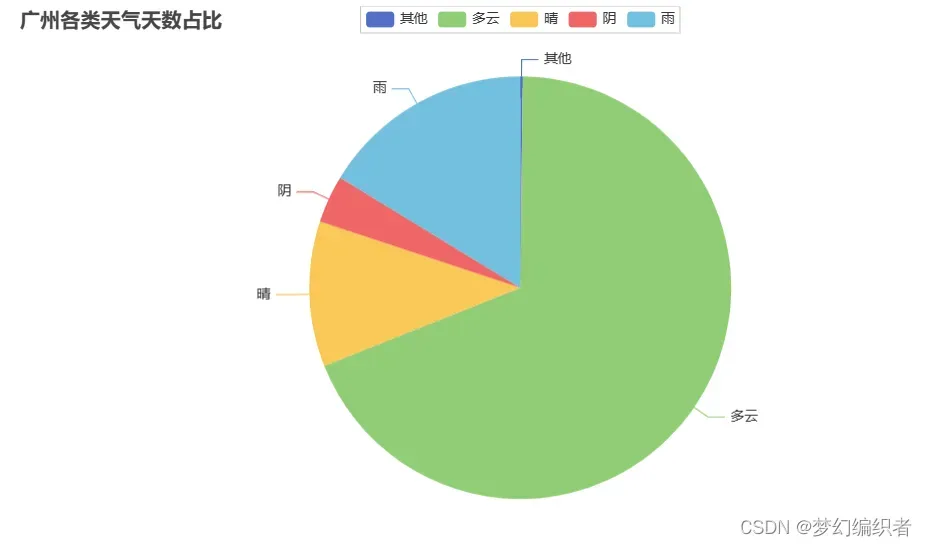
import pandas as pd
from pyecharts.charts import Pie
from pyecharts import options as opts

# 读取csv文件并转换为列表格式
df = pd.read_csv('df6.csv')
data_list = df[['新天气', '天数']].values.tolist()

# 生成饼图
pie = Pie()
pie.add("", data_list)
pie.set_global_opts(title_opts=opts.TitleOpts(title="河源各类天气天数占比"))
pie.set_series_opts(label_opts=opts.LabelOpts(formatter="{b}"))
pie.render_notebook()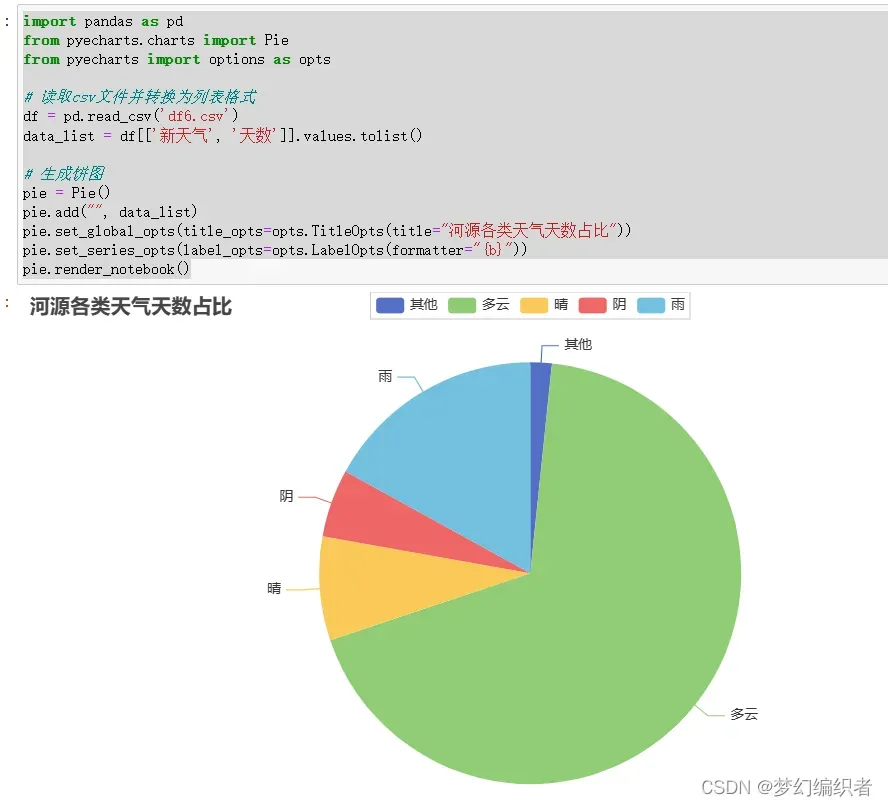
import pandas as pd
from pyecharts.charts import Pie
from pyecharts import options as opts

# 读取csv文件并转换为列表格式
df = pd.read_csv('df7.csv')
data_list = df[['新天气', '天数']].values.tolist()

# 生成饼图
pie = Pie()
pie.add("", data_list)
pie.set_global_opts(title_opts=opts.TitleOpts(title="惠州各类天气天数占比"))
pie.set_series_opts(label_opts=opts.LabelOpts(formatter="{b}"))
pie.render_notebook()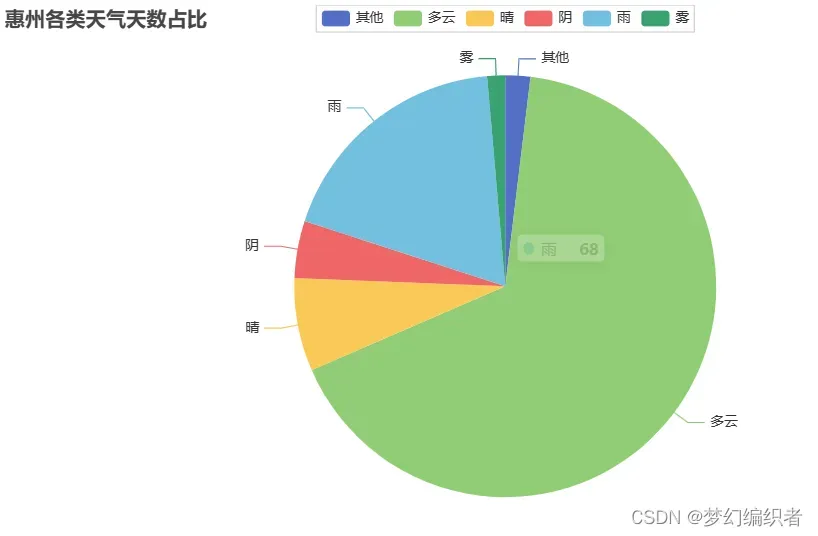
import pandas as pd
from pyecharts.charts import Pie
from pyecharts import options as opts

# 读取csv文件并转换为列表格式
df = pd.read_csv('df8.csv')
data_list = df[['新天气', '天数']].values.tolist()

# 生成饼图
pie = Pie()
pie.add("", data_list)
pie.set_global_opts(title_opts=opts.TitleOpts(title="深圳各类天气天数占比"))
pie.set_series_opts(label_opts=opts.LabelOpts(formatter="{b}"))
pie.render_notebook()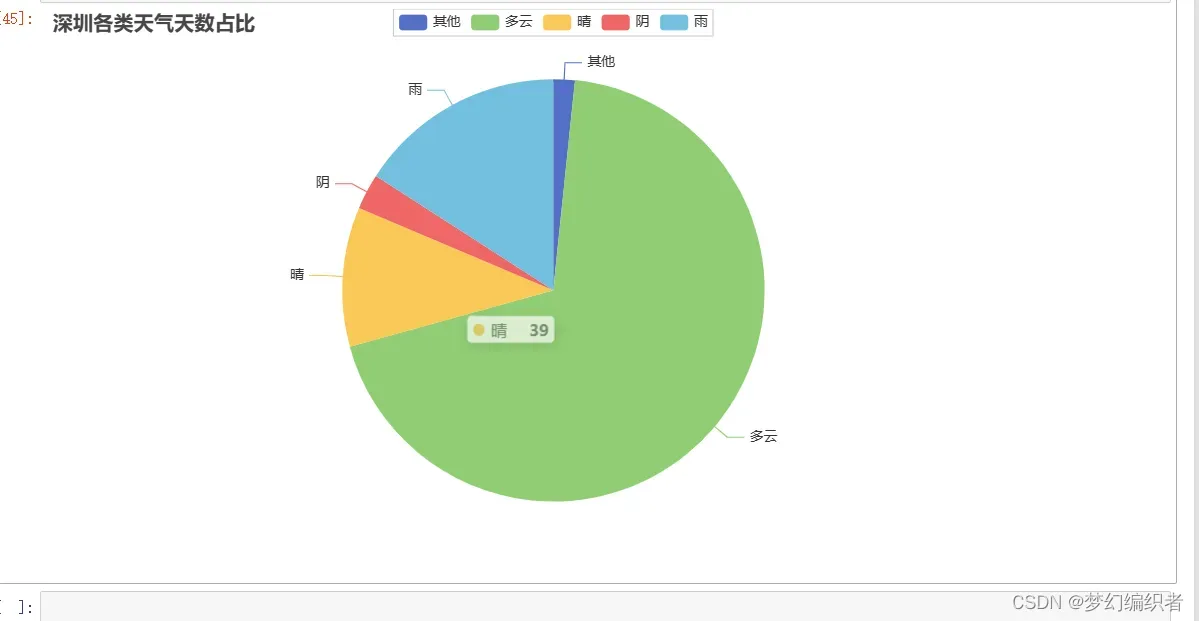
13.统计四个城市每日气温折线图
import matplotlib.pyplot as plt
import matplotlib as mpl
import pandas as pd
# 筛选出广州和湛江的数据
gz_data = data[data['城市'] == '广州']
hy_data = data[data['城市'] == '河源']
hz_data = data[data['城市'] == '惠州']
sz_data = data[data['城市'] == '深圳']

# 提取日期和平均温度数据
x = gz_data['日期']
y1 = gz_data['平均温度']
y2 = hy_data['平均温度']
y3 = hz_data['平均温度']
y4 = sz_data['平均温度']

# 绘制面积图
plt.figure(dpi=500, figsize=(10, 5))
plt.title("广州惠州河源深圳折线图")
plt.fill_between(x, y1, color='red', alpha=0.5, label='广州')
plt.fill_between(x, y2, color='blue', alpha=0.5, label='河源')
plt.fill_between(x, y3, color='yellow', alpha=0.5, label='惠州')
plt.fill_between(x, y4, color='green', alpha=0.5, label='深圳')
# 获取图的坐标信息
coordinates = plt.gca()
# 设置x轴每个刻度的间隔天数
xLocator = mpl.ticker.MultipleLocator(30)
coordinates.xaxis.set_major_locator(xLocator)
# 将日期旋转30°
plt.xticks(rotation=30)
plt.xticks(fontsize=8)
plt.ylabel("温度(℃)")
plt.xlabel("日期")
plt.legend()
plt.savefig("广-惠-河-深折线图")
plt.show()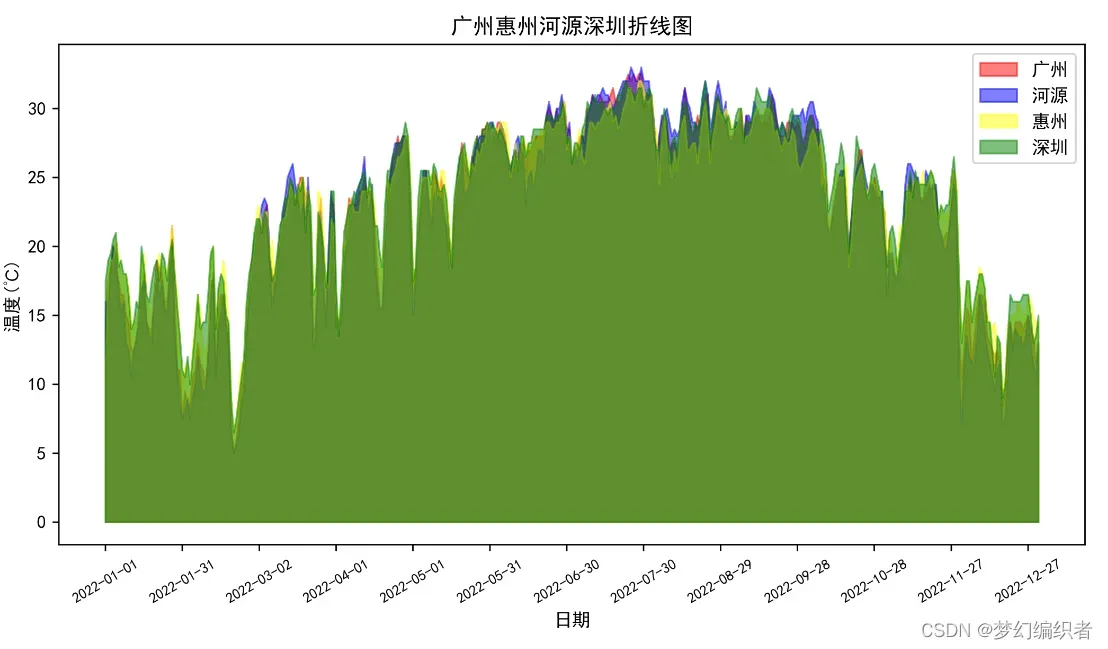
14.读取四个城市各类天气天数对比图
import matplotlib.pyplot as plt
from pyecharts.charts import Bar
# 读取广州数据并生成柱状图
df1 = pd.read_csv('df5.csv')
data_list1 = df1[['新天气', '天数']].values.tolist()

# 读取河源数据并生成柱状图
df2 = pd.read_csv('df6.csv')
data_list2 = df2[['新天气', '天数']].values.tolist()

# 读取惠州数据并生成柱状图
df3 = pd.read_csv('df7.csv')
data_list3 = df3[['新天气', '天数']].values.tolist()

# 读取深圳数据并生成柱状图
df4 = pd.read_csv('df8.csv')
data_list4 = df4[['新天气', '天数']].values.tolist()
# 合并 x 轴数据
x_data = list(set([i[0] for i in data_list1] + [i[0] for i in data_list2] + [i[0] for i in data_list3] + [i[0] for i in data_list4]))

# 生成柱状图
bar = Bar()
bar.add_xaxis(x_data)
bar.add_yaxis("广州", [df1.loc[df1['新天气']==x, '天数'].tolist()[0] if x in df1['新天气'].tolist() else 0 for x in x_data])
bar.add_yaxis("河源", [df2.loc[df2['新天气']==x, '天数'].tolist()[0] if x in df2['新天气'].tolist() else 0 for x in x_data])
bar.add_yaxis("惠州", [df3.loc[df3['新天气']==x, '天数'].tolist()[0] if x in df3['新天气'].tolist() else 0 for x in x_data])
bar.add_yaxis("深圳", [df4.loc[df4['新天气']==x, '天数'].tolist()[0] if x in df4['新天气'].tolist() else 0 for x in x_data])
bar.set_global_opts(title_opts=opts.TitleOpts(title="广州惠州河源深圳各类天气天数对比图"),
                     xaxis_opts=opts.AxisOpts(axislabel_opts=opts.LabelOpts(rotate=-45)),
                     legend_opts=opts.LegendOpts(pos_left="center"))
bar.render_notebook()
15.读取四个城市当中一个城市的天气天数对比图
import matplotlib.pyplot as plt
from pyecharts.charts import Bar
# 读取惠州数据并生成柱状图
df3 = pd.read_csv('df7.csv')
data_list3 = df3[['新天气', '天数']].values.tolist()
# 生成柱状图
bar = Bar()
bar.add_xaxis(x_data)
bar.add_yaxis("惠州", [df3.loc[df3['新天气']==x, '天数'].tolist()[0] if x in df3['新天气'].tolist() else 0 for x in x_data])
bar.set_global_opts(title_opts=opts.TitleOpts(title="广州惠州河源深圳各类天气天数对比图"),
                     xaxis_opts=opts.AxisOpts(axislabel_opts=opts.LabelOpts(rotate=-45)),
                     legend_opts=opts.LegendOpts(pos_left="center"))
bar.render_notebook()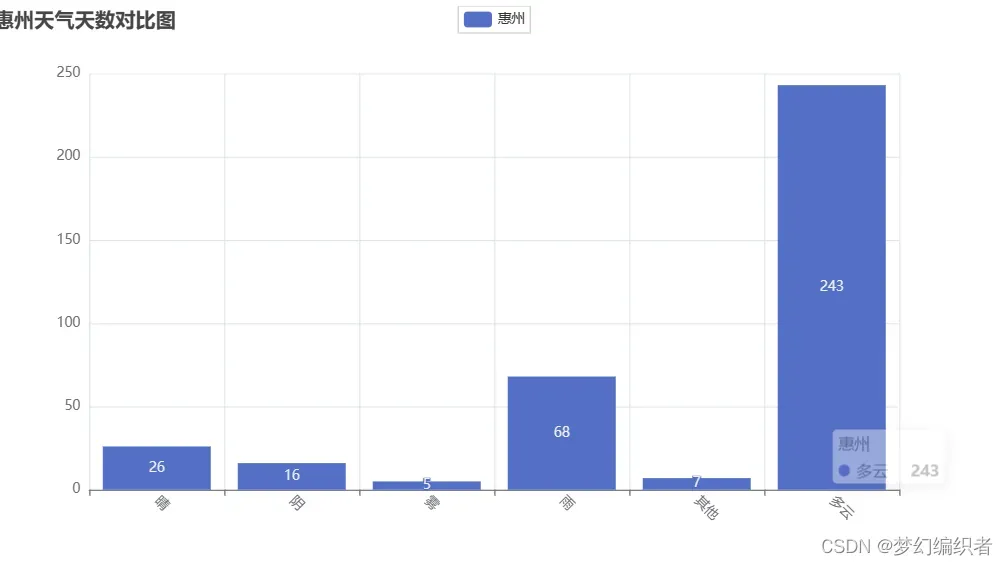
当今社会,数据越来越重要,因此,仪表盘成为了一种非常流行的数据可视化方式。通过使用仪表盘,用户可以更轻松地理解数据,从而做出更好的决策。在本文中,我们将介绍如何使用前端网页来实现仪表盘文字。
首先,我们需要一个基本的 HTML 文件。在这个文件中,我们将创建一个仪表盘的基本框架,并使用 CSS 来设置样式。在这个基本框架中,我们将包含一个 div 元素,用于显示仪表盘的文本。我们将使用 JavaScript 来动态地更新这个文本。
<!DOCTYPE html>
<html>
<head>
<meta charset="UTF-8">
<title>Awesome-pyecharts</title>
<script type="text/javascript" src="https://assets.pyecharts.org/assets/v5/echarts.min.js"></script>
<script type="text/javascript" src="https://assets.pyecharts.org/assets/v5/jquery.min.js"></script>
<script type="text/javascript" src="https://assets.pyecharts.org/assets/v5/jquery-ui.min.js"></script>
<script type="text/javascript" src="https://assets.pyecharts.org/assets/v5/ResizeSensor.js"></script>
<link rel="stylesheet" href="https://assets.pyecharts.org/assets/v5/jquery-ui.css">
</head>
<body >
<style>.box { } </style>
<button onclick="downloadCfg()">Save Config</button>
<div class="box">
<div id="c48b9e2d9b7440e1b2f458d54f3b383c" class="chart-container" style="width:900px; height:500px; "></div>
<script>
var chart_c48b9e2d9b7440e1b2f458d54f3b383c = echarts.init(
document.getElementById('c48b9e2d9b7440e1b2f458d54f3b383c'), 'white', {renderer: 'canvas'});
var option_c48b9e2d9b7440e1b2f458d54f3b383c = {
"animation": true,
"animationThreshold": 2000,
"animationDuration": 1000,
"animationEasing": "cubicOut",
"animationDelay": 0,
"animationDurationUpdate": 300,
"animationEasingUpdate": "cubicOut",
"animationDelayUpdate": 0,
"aria": {
"enabled": false
},
"color": [
"#5470c6",
"#91cc75",
"#fac858",
"#ee6666",
"#73c0de",
"#3ba272",
"#fc8452",
"#9a60b4",
"#ea7ccc"
],
"series": [
{
"type": "bar",
"name": "广州",
"legendHoverLink": true,
"data": [
247,
0,
1,
14,
61,
42
],
"realtimeSort": false,
"showBackground": false,
"stackStrategy": "samesign",
"cursor": "pointer",
"barMinHeight": 0,
"barCategoryGap": "20%",
"barGap": "30%",
"large": false,
"largeThreshold": 400,
"seriesLayoutBy": "column",
"datasetIndex": 0,
"clip": true,
"zlevel": 0,
"z": 2,
"label": {
"show": true,
"margin": 8
}
},
{
"type": "bar",
"name": "河源",
"legendHoverLink": true,
"data": [
249,
0,
6,
19,
62,
29
],
"realtimeSort": false,
"showBackground": false,
"stackStrategy": "samesign",
"cursor": "pointer",
"barMinHeight": 0,
"barCategoryGap": "20%",
"barGap": "30%",
"large": false,
"largeThreshold": 400,
"seriesLayoutBy": "column",
"datasetIndex": 0,
"clip": true,
"zlevel": 0,
"z": 2,
"label": {
"show": true,
"margin": 8
}
},
{ "type": "bar",
"name": "惠州",
"legendHoverLink": true,
"data": [
243,
5,
7,
16,
68,
26,
],
"realtimeSort": false,
"showBackground": false,
"stackStrategy": "samesign",
"cursor": "pointer",
"barMinHeight": 0,
"barCategoryGap": "20%",
"barGap": "30%",
"large": false,
"largeThreshold": 400,
"seriesLayoutBy": "column",
"datasetIndex": 0,
"clip": true,
"zlevel": 0,
"z": 2,
"label": {
"show": true,
"margin": 8
}
},
{
"type": "bar",
"name": "深圳",
"legendHoverLink": true,
"data": [
252,
0,
6,
10,
58,
39
],
"realtimeSort": false,
"showBackground": false,
"stackStrategy": "samesign",
"cursor": "pointer",
"barMinHeight": 0,
"barCategoryGap": "20%",
"barGap": "30%",
"large": false,
"largeThreshold": 400,
"seriesLayoutBy": "column",
"datasetIndex": 0,
"clip": true,
"zlevel": 0,
"z": 2,
"label": {
"show": true,
"margin": 8
}
}
],
"legend": [
{
"data": [
"广州",
"河源",
"惠州",
"深圳"
],
"selected": {},
"show": true,
"left": "center",
"padding": 5,
"itemGap": 10,
"itemWidth": 25,
"itemHeight": 14,
"backgroundColor": "transparent",
"borderColor": "#ccc",
"borderWidth": 1,
"borderRadius": 0,
"pageButtonItemGap": 5,
"pageButtonPosition": "end",
"pageFormatter": "{current}/{total}",
"pageIconColor": "#2f4554",
"pageIconInactiveColor": "#aaa",
"pageIconSize": 15,
"animationDurationUpdate": 800,
"selector": false,
"selectorPosition": "auto",
"selectorItemGap": 7,
"selectorButtonGap": 10
}
],
"tooltip": {
"show": true,
"trigger": "item",
"triggerOn": "mousemove|click",
"axisPointer": {
"type": "line"
},
"showContent": true,
"alwaysShowContent": false,
"showDelay": 0,
"hideDelay": 100,
"enterable": false,
"confine": false,
"appendToBody": false,
"transitionDuration": 0.4,
"textStyle": {
"fontSize": 14
},
"borderWidth": 0,
"padding": 5,
"order": "seriesAsc"
},
"xAxis": [
{
"show": true,
"scale": false,
"nameLocation": "end",
"nameGap": 15,
"gridIndex": 0,
"axisLabel": {
"show": true,
"rotate": -45,
"margin": 8
},
"inverse": false,
"offset": 0,
"splitNumber": 5,
"minInterval": 0,
"splitLine": {
"show": true,
"lineStyle": {
"show": true,
"width": 1,
"opacity": 1,
"curveness": 0,
"type": "solid"
}
},
"data": [
"多云",
"雾",
"其他",
"阴",
"雨",
"晴"
]
}
],
"yAxis": [
{
"show": true,
"scale": false,
"nameLocation": "end",
"nameGap": 15,
"gridIndex": 0,
"inverse": false,
"offset": 0,
"splitNumber": 5,
"minInterval": 0,
"splitLine": {
"show": true,
"lineStyle": {
"show": true,
"width": 1,
"opacity": 1,
"curveness": 0,
"type": "solid"
}
}
}
],
"title": [
{
"show": true,
"text": "广州河源惠州深圳各类天气天数对比图",
"target": "blank",
"subtarget": "blank",
"padding": 5,
"itemGap": 10,
"textAlign": "auto",
"textVerticalAlign": "auto",
"triggerEvent": false
}
]
};
chart_c48b9e2d9b7440e1b2f458d54f3b383c.setOption(option_c48b9e2d9b7440e1b2f458d54f3b383c);
</script>
<br/> <div id="88ddd5d9c5594bf597661b16ae91e0e4" class="chart-container" style="width:900px; height:500px; "></div>
<script>
var chart_88ddd5d9c5594bf597661b16ae91e0e4 = echarts.init(
document.getElementById('88ddd5d9c5594bf597661b16ae91e0e4'), 'white', {renderer: 'canvas'});
var option_88ddd5d9c5594bf597661b16ae91e0e4 = {
"animation": true,
"animationThreshold": 2000,
"animationDuration": 1000,
"animationEasing": "cubicOut",
"animationDelay": 0,
"animationDurationUpdate": 300,
"animationEasingUpdate": "cubicOut",
"animationDelayUpdate": 0,
"aria": {
"enabled": false
},
"color": [
"#5470c6",
"#91cc75",
"#fac858",
"#ee6666",
"#73c0de",
"#3ba272",
"#fc8452",
"#9a60b4",
"#ea7ccc"
],
"series": [
{
"type": "pie",
"colorBy": "data",
"legendHoverLink": true,
"selectedMode": false,
"selectedOffset": 10,
"clockwise": true,
"startAngle": 90,
"minAngle": 0,
"minShowLabelAngle": 0,
"avoidLabelOverlap": true,
"stillShowZeroSum": true,
"percentPrecision": 2,
"showEmptyCircle": true,
"emptyCircleStyle": {
"color": "lightgray",
"borderColor": "#000",
"borderWidth": 0,
"borderType": "solid",
"borderDashOffset": 0,
"borderCap": "butt",
"borderJoin": "bevel",
"borderMiterLimit": 10,
"opacity": 1
},
"data": [
{
"name": "其他",
"value": 1
},
{
"name": "多云",
"value": 247
},
{
"name":"晴",
"value": 42
},
{
"name": "阴",
"value": 14
},
{
"name": "雨",
"value": 61
}
],
"radius": [
"0%",
"75%"
],
"center": [
"50%",
"50%"
],
"label": {
"show": true,
"margin": 8,
"formatter": "{b}"
},
"labelLine": {
"show": true,
"showAbove": false,
"length": 15,
"length2": 15,
"smooth": false,
"minTurnAngle": 90,
"maxSurfaceAngle": 90
},
"rippleEffect": {
"show": true,
"brushType": "stroke",
"scale": 2.5,
"period": 4
}
}
],
"legend": [
{
"data": [
"其他",
"多云",
"阴",
"雨",
"晴"
],
"selected": {},
"show": true,
"padding": 5,
"itemGap": 10,
"itemWidth": 25,
"itemHeight": 14,
"backgroundColor": "transparent",
"borderColor": "#ccc",
"borderWidth": 1,
"borderRadius": 0,
"pageButtonItemGap": 5,
"pageButtonPosition": "end",
"pageFormatter": "{current}/{total}",
"pageIconColor": "#2f4554",
"pageIconInactiveColor": "#aaa",
"pageIconSize": 15,
"animationDurationUpdate": 800,
"selector": false,
"selectorPosition": "auto",
"selectorItemGap": 7,
"selectorButtonGap": 10
}
],
"tooltip": {
"show": true,
"trigger": "item",
"triggerOn": "mousemove|click",
"axisPointer": {
"type": "line"
},
"showContent": true,
"alwaysShowContent": false,
"showDelay": 0,
"hideDelay": 100,
"enterable": false,
"confine": false,
"appendToBody": false,
"transitionDuration": 0.4,
"textStyle": {
"fontSize": 14
},
"borderWidth": 0,
"padding": 5,
"order": "seriesAsc"
},
"title": [
{
"show": true,
"text": "广州各类天气天数占比",
"target": "blank",
"subtarget": "blank",
"padding": 5,
"itemGap": 10,
"textAlign": "auto",
"textVerticalAlign": "auto",
"triggerEvent": false
}
]
};
chart_88ddd5d9c5594bf597661b16ae91e0e4.setOption(option_88ddd5d9c5594bf597661b16ae91e0e4);
</script>
<br/> <div id="8d11665b4f43436cbb0b2ed6ae6b27f9" class="chart-container" style="width:900px; height:500px; "></div>
<script>
var chart_8d11665b4f43436cbb0b2ed6ae6b27f9 = echarts.init(
document.getElementById('8d11665b4f43436cbb0b2ed6ae6b27f9'), 'white', {renderer: 'canvas'});
var option_8d11665b4f43436cbb0b2ed6ae6b27f9 = {
"animation": true,
"animationThreshold": 2000,
"animationDuration": 1000,
"animationEasing": "cubicOut",
"animationDelay": 0,
"animationDurationUpdate": 300,
"animationEasingUpdate": "cubicOut",
"animationDelayUpdate": 0,
"aria": {
"enabled": false
},
"color": [
"#5470c6",
"#91cc75",
"#fac858",
"#ee6666",
"#73c0de",
"#3ba272",
"#fc8452",
"#9a60b4",
"#ea7ccc"
],
"series": [
{
"type": "pie",
"colorBy": "data",
"legendHoverLink": true,
"selectedMode": false,
"selectedOffset": 10,
"clockwise": true,
"startAngle": 90,
"minAngle": 0,
"minShowLabelAngle": 0,
"avoidLabelOverlap": true,
"stillShowZeroSum": true,
"percentPrecision": 2,
"showEmptyCircle": true,
"emptyCircleStyle": {
"color": "lightgray",
"borderColor": "#000",
"borderWidth": 0,
"borderType": "solid",
"borderDashOffset": 0,
"borderCap": "butt",
"borderJoin": "bevel",
"borderMiterLimit": 10,
"opacity": 1
},
"data": [
{
"name": "其他",
"value": 6
},
{
"name": "多云",
"value": 249
},
{
"name": "晴",
"value": 29
},
{
"name": "阴",
"value": 19
},
{
"name": "雨",
"value": 62
},
],
"radius": [
"0%",
"75%"
],
"center": [
"50%",
"50%"
],
"label": {
"show": true,
"margin": 8,
"formatter": "{b}"
},
"labelLine": {
"show": true,
"showAbove": false,
"length": 15,
"length2": 15,
"smooth": false,
"minTurnAngle": 90,
"maxSurfaceAngle": 90
},
"rippleEffect": {
"show": true,
"brushType": "stroke",
"scale": 2.5,
"period": 4
}
}
],
"legend": [
{
"data": [
"其他",
"多云",
"晴",
"阴",
"雨"
],
"selected": {},
"show": true,
"padding": 5,
"itemGap": 10,
"itemWidth": 25,
"itemHeight": 14,
"backgroundColor": "transparent",
"borderColor": "#ccc",
"borderWidth": 1,
"borderRadius": 0,
"pageButtonItemGap": 5,
"pageButtonPosition": "end",
"pageFormatter": "{current}/{total}",
"pageIconColor": "#2f4554",
"pageIconInactiveColor": "#aaa",
"pageIconSize": 15,
"animationDurationUpdate": 800,
"selector": false,
"selectorPosition": "auto",
"selectorItemGap": 7,
"selectorButtonGap": 10
}
],
"tooltip": {
"show": true,
"trigger": "item",
"triggerOn": "mousemove|click",
"axisPointer": {
"type": "line"
},
"showContent": true,
"alwaysShowContent": false,
"showDelay": 0,
"hideDelay": 100,
"enterable": false,
"confine": false,
"appendToBody": false,
"transitionDuration": 0.4,
"textStyle": {
"fontSize": 14
},
"borderWidth": 0,
"padding": 5,
"order": "seriesAsc"
},
"title": [
{
"show": true,
"text": "河源各类天气占比",
"target": "blank",
"subtarget": "blank",
"padding": 5,
"itemGap": 10,
"textAlign": "auto",
"textVerticalAlign": "auto",
"triggerEvent": false
}
]
};
chart_8d11665b4f43436cbb0b2ed6ae6b27f9.setOption(option_8d11665b4f43436cbb0b2ed6ae6b27f9);
</script>
<br/> <div id="3c4a8e7c9e8f5aebd9f23d5d3e7c2a3c" class="chart-container" style="width:900px; height:500px; "></div>
<script>
var chart_3c4a8e7c9e8f5aebd9f23d5d3e7c2a3c= echarts.init(
document.getElementById('3c4a8e7c9e8f5aebd9f23d5d3e7c2a3c'), 'white', {renderer: 'canvas'});
var option_3c4a8e7c9e8f5aebd9f23d5d3e7c2a3c = {
"animation": true,
"animationThreshold": 2000,
"animationDuration": 1000,
"animationEasing": "cubicOut",
"animationDelay": 0,
"animationDurationUpdate": 300,
"animationEasingUpdate": "cubicOut",
"animationDelayUpdate": 0,
"aria": {
"enabled": false
},
"color": [
"#5470c6",
"#91cc75",
"#fac858",
"#ee6666",
"#73c0de",
"#3ba272",
"#fc8452",
"#9a60b4",
"#ea7ccc"
],
"series": [
{
"type": "pie",
"colorBy": "data",
"legendHoverLink": true,
"selectedMode": false,
"selectedOffset": 10,
"clockwise": true,
"startAngle": 90,
"minAngle": 0,
"minShowLabelAngle": 0,
"avoidLabelOverlap": true,
"stillShowZeroSum": true,
"percentPrecision": 2,
"showEmptyCircle": true,
"emptyCircleStyle": {
"color": "lightgray",
"borderColor": "#000",
"borderWidth": 0,
"borderType": "solid",
"borderDashOffset": 0,
"borderCap": "butt",
"borderJoin": "bevel",
"borderMiterLimit": 10,
"opacity": 1
},
"data": [
{
"name": "其他",
"value": 7
},
{
"name": "多云",
"value": 243
},
{
"name":"晴",
"value": 26
},
{
"name": "阴",
"value": 16
},
{
"name": "雨",
"value": 68
},
{
"name":"雾",
"value": 5
}
],
"radius": [
"0%",
"75%"
],
"center": [
"50%",
"50%"
],
"label": {
"show": true,
"margin": 8,
"formatter": "{b}"
},
"labelLine": {
"show": true,
"showAbove": false,
"length": 15,
"length2": 15,
"smooth": false,
"minTurnAngle": 90,
"maxSurfaceAngle": 90
},
"rippleEffect": {
"show": true,
"brushType": "stroke",
"scale": 2.5,
"period": 4
}
}
],
"legend": [
{
"data": [
"其他",
"多云",
"阴",
"雨",
"晴",
"雾"
],
"selected": {},
"show": true,
"padding": 5,
"itemGap": 10,
"itemWidth": 25,
"itemHeight": 14,
"backgroundColor": "transparent",
"borderColor": "#ccc",
"borderWidth": 1,
"borderRadius": 0,
"pageButtonItemGap": 5,
"pageButtonPosition": "end",
"pageFormatter": "{current}/{total}",
"pageIconColor": "#2f4554",
"pageIconInactiveColor": "#aaa",
"pageIconSize": 15,
"animationDurationUpdate": 800,
"selector": false,
"selectorPosition": "auto",
"selectorItemGap": 7,
"selectorButtonGap": 10
}
],
"tooltip": {
"show": true,
"trigger": "item",
"triggerOn": "mousemove|click",
"axisPointer": {
"type": "line"
},
"showContent": true,
"alwaysShowContent": false,
"showDelay": 0,
"hideDelay": 100,
"enterable": false,
"confine": false,
"appendToBody": false,
"transitionDuration": 0.4,
"textStyle": {
"fontSize": 14
},
"borderWidth": 0,
"padding": 5,
"order": "seriesAsc"
},
"title": [
{
"show": true,
"text": "惠州各类天气天数占比",
"target": "blank",
"subtarget": "blank",
"padding": 5,
"itemGap": 10,
"textAlign": "auto",
"textVerticalAlign": "auto",
"triggerEvent": false
}
]
};
chart_3c4a8e7c9e8f5aebd9f23d5d3e7c2a3c.setOption(option_3c4a8e7c9e8f5aebd9f23d5d3e7c2a3c);
</script>
<br/> <div id="7e4f9b8a5c1225a9d9c8e7a8e8d7d6b2" class="chart-container" style="width:900px; height:500px; "></div>
<script>
var chart_7e4f9b8a5c1225a9d9c8e7a8e8d7d6b2= echarts.init(
document.getElementById('7e4f9b8a5c1225a9d9c8e7a8e8d7d6b2'), 'white', {renderer: 'canvas'});
var option_7e4f9b8a5c1225a9d9c8e7a8e8d7d6b2 = {
"animation": true,
"animationThreshold": 2000,
"animationDuration": 1000,
"animationEasing": "cubicOut",
"animationDelay": 0,
"animationDurationUpdate": 300,
"animationEasingUpdate": "cubicOut",
"animationDelayUpdate": 0,
"aria": {
"enabled": false
},
"color": [
" #5470c6",
"#91cc75",
"#fac858",
"#ee6666",
"#73c0de",
"#3ba272",
"#fc8452",
"#9a60b4",
"#ea7ccc"
],
"series": [
{
"type": "pie",
"colorBy": "data",
"legendHoverLink": true,
"selectedMode": false,
"selectedOffset": 10,
"clockwise": true,
"startAngle": 90,
"minAngle": 0,
"minShowLabelAngle": 0,
"avoidLabelOverlap": true,
"stillShowZeroSum": true,
"percentPrecision": 2,
"showEmptyCircle": true,
"emptyCircleStyle": {
"color": "lightgray",
"borderColor": "#",
"borderWidth": 0,
"borderType": "solid",
"borderDashOffset": 0,
"borderCap": "butt",
"borderJoin": "bevel",
"borderMiterLimit": 10,
"opacity": 1
},
"data": [
{
"name": "其他",
"value": 6
},
{
"name": "多云",
"value": 252
},
{
"name":"晴",
"value": 39
},
{
"name": "阴",
"value": 10
},
{
"name": "雨",
"value": 58
},
],
"radius": [
"0%",
"75%"
],
"center": [
"50%",
"50%"
],
"label": {
"show": true,
"margin": 8,
"formatter": "{b}"
},
"labelLine": {
"show": true,
"showAbove": false,
"length": 15,
"length2": 15,
"smooth": false,
"minTurnAngle": 90,
"maxSurfaceAngle": 90
},
"rippleEffect": {
"show": true,
"brushType": "stroke",
"scale": 2.5,
"period": 4
}
}
],
"legend": [
{
"data": [
"其他",
"多云",
"阴",
"雨",
"晴"
],
"selected": {},
"show": true,
"padding": 5,
"itemGap": 10,
"itemWidth": 25,
"itemHeight": 14,
"backgroundColor": "transparent",
"borderColor": "#ccc",
"borderWidth": 1,
"borderRadius": 0,
"pageButtonItemGap": 5,
"pageButtonPosition": "end",
"pageFormatter": "{current}/{total}",
"pageIconColor": "#2f4554",
"pageIconInactiveColor": "#aaa",
"pageIconSize": 15,
"animationDurationUpdate": 800,
"selector": false,
"selectorPosition": "auto",
"selectorItemGap": 7,
"selectorButtonGap": 10
}
],
"tooltip": {
"show": true,
"trigger": "item",
"triggerOn": "mousemove|click",
"axisPointer": {
"type": "line"
},
"showContent": true,
"alwaysShowContent": false,
"showDelay": 0,
"hideDelay": 100,
"enterable": false,
"confine": false,
"appendToBody": false,
"transitionDuration": 0.4,
"textStyle": {
"fontSize": 14
},
"borderWidth": 0,
"padding": 5,
"order": "seriesAsc"
},
"title": [
{
"show": true,
"text": "深圳各类天气天数占比",
"target": "blank",
"subtarget": "blank",
"padding": 5,
"itemGap": 10,
"textAlign": "auto",
"textVerticalAlign": "auto",
"triggerEvent": false
}
]
};
chart_7e4f9b8a5c1225a9d9c8e7a8e8d7d6b2.setOption(option_7e4f9b8a5c1225a9d9c8e7a8e8d7d6b2);
</script>
<br/> <div id="05381e07884b4ca4a31f555d2e24d39e" class="chart-container" style="width:980px; height:600px; "></div>
<script>
var chart_05381e07884b4ca4a31f555d2e24d39e = echarts.init(
document.getElementById('05381e07884b4ca4a31f555d2e24d39e'), 'white', {renderer: 'canvas'});
var option_05381e07884b4ca4a31f555d2e24d39e = {
"baseOption": {
"series": [
{
"type": "line",
"name": "广州",
"connectNulls": false,
"xAxisIndex": 0,
"symbolSize": 5,
"showSymbol": true,
"smooth": true,
"clip": true,
"step": false,
"data": [
[
1,
15.709677419354838
],
[
2,
12.232142857142858
],
[
3,
21.177419354838708
],
[
4,
22.533333333333335
],
[
5,
24.370967741935484
],
[
6,
28.0
],
[
7,
30.35483870967742
],
[
8,
29.0
],
[
9,
28.866666666666667
],
[
10,
24.903225806451612
],
[
11,
21.783333333333335
],
[
12,
13.403225806451612
]
],
"hoverAnimation": true,
"label": {
"show": false,
"margin": 8
},
"logBase": 10,
"seriesLayoutBy": "column",
"lineStyle": {
"normal": {
"width": 4,
"shadowColor": "blue",
"shadowBlur": 10,
"shadowOffsetY": 10,
"shadowOffsetX": 10
}
},
"areaStyle": {
"opacity": 0
},
"zlevel": 0,
"z": 0,
"rippleEffect": {
"show": true,
"brushType": "stroke",
"scale": 2.5,
"period": 4
}
},
{
"type": "line",
"name": "河源",
"connectNulls": false,
"xAxisIndex": 0,
"symbolSize": 5,
"showSymbol": true,
"smooth": true,
"clip": true,
"step": false,
"data": [
[
1,
15.080645
],
[
2,
11.607143
],
[
3,
21.096774
],
[
4,
22.300000
],
[
5,
23.887097
],
[
6,
27.550000
],
[
7,
30.419355
],
[
8,
29.677419
],
[
9,
29.216667
],
[
10,
24.983871
],
[
11,
21.933333
],
[
12,
12.096774
]
],
"hoverAnimation": true,
"label": {
"show": false,
"margin": 8
},
"logBase": 10,
"seriesLayoutBy": "column",
"lineStyle": {
"normal": {
"width": 4,
"shadowColor": "green",
"shadowBlur": 10,
"shadowOffsetY": 10,
"shadowOffsetX": 10
}
},
"areaStyle": {
"opacity": 0
},
"zlevel": 0,
"z": 0,
"rippleEffect": {
"show": true,
"brushType": "stroke",
"scale": 2.5,
"period": 4
}
},
{
"type": "line",
"name": "惠州",
"connectNulls": false,
"xAxisIndex": 0,
"symbolSize": 5,
"showSymbol": true,
"smooth": true,
"clip": true,
"step": false,
"data": [
[
1,
17.290323
],
[
2,
14.035714
],
[
3,
21.677419
],
[
4,
22.750000
],
[
5,
24.774194
],
[
6,
28.050000
],
[
7,
29.306452
],
[
8,
28.177419
],
[
9,
28.416667
],
[
10,
24.870968
],
[
11,
22.783333
],
[
12,
14.967742
]
],
"hoverAnimation": true,
"label": {
"show": false,
"margin": 8
},
"logBase": 10,
"seriesLayoutBy": "column",
"lineStyle": {
"normal": {
"width": 4,
"shadowColor": "yellow",
"shadowBlur": 10,
"shadowOffsetY": 10,
"shadowOffsetX": 10
}
},
"areaStyle": {
"opacity": 0
},
"zlevel": 0,
"z": 0,
"rippleEffect": {
"show": true,
"brushType": "stroke",
"scale": 2.5,
"period": 4
}
},
{
"type": "line",
"name": "深圳",
"connectNulls": false,
"xAxisIndex": 0,
"symbolSize": 5,
"showSymbol": true,
"smooth": true,
"clip": true,
"step": false,
"data": [
[
1,
17.580645
],
[
2,
14.232143
],
[
3,
21.596774
],
[
4,
23.466667
],
[
5,
25.064516
],
[
6,
28.166667
],
[
7,
30.016129
],
[
8,
29.145161
],
[
9,
29.400000
],
[
10,
25.725806
],
[
11,
22.966667
],
[
12,
14.870968
]
],
"hoverAnimation": true,
"label": {
"show": false,
"margin": 8
},
"logBase": 10,
"seriesLayoutBy": "column",
"lineStyle": {
"normal": {
"width": 4,
"shadowColor": "red",
"shadowBlur": 10,
"shadowOffsetY": 10,
"shadowOffsetX": 10
}
},
"areaStyle": {
"opacity": 0
},
"zlevel": 0,
"z": 0,
"rippleEffect": {
"show": true,
"brushType": "stroke",
"scale": 2.5,
"period": 4
}
}
],
"timeline": {
"axisType": "category",
"currentIndex": 0,
"orient": "horizontal",
"autoPlay": true,
"controlPosition": "left",
"loop": true,
"rewind": false,
"show": true,
"inverse": false,
"playInterval": 1000,
"left": "0",
"right": "0",
"bottom": "-5px",
"progress": {},
"data": [
"1月",
"2月",
"3月",
"4月",
"5月",
"6月",
"7月",
"8月",
"9月",
"10月",
"11月",
"12月"
]
},
"xAxis": [
{
"type": "category",
"show": true,
"scale": false,
"nameLocation": "end",
"nameGap": 15,
"gridIndex": 0,
"axisLine": {
"show": true,
"onZero": true,
"onZeroAxisIndex": 0,
"lineStyle": {
"show": true,
"width": 2,
"opacity": 1,
"curveness": 0,
"type": "solid",
"color": "#DB7093"
}
},
"axisLabel": {
"show": true,
"color": "red",
"margin": 8,
"fontSize": 14
},
"inverse": false,
"offset": 0,
"splitNumber": 5,
"boundaryGap": false,
"minInterval": 0,
"splitLine": {
"show": true,
"lineStyle": {
"show": true,
"width": 1,
"opacity": 1,
"curveness": 0,
"type": "solid"
}
},
"data": [
1,
2,
3,
4,
5,
6,
7,
8,
9,
10,
11,
12
]
}
],
"yAxis": [
{
"name": "平均温度",
"show": true,
"scale": true,
"nameLocation": "end",
"nameGap": 15,
"nameTextStyle": {
"color": "blue",
"fontWeight": "bold",
"fontSize": 16
},
"gridIndex": 0,
"axisLine": {
"show": true,
"onZero": true,
"onZeroAxisIndex": 0,
"lineStyle": {
"show": true,
"width": 2,
"opacity": 1,
"curveness": 0,
"type": "solid",
"color": "blue"
}
},
"axisLabel": {
"show": true,
"color": "yellow",
"margin": 8,
"fontSize": 13
},
"inverse": false,
"offset": 0,
"splitNumber": 5,
"min": 3,
"max": 25,
"minInterval": 0,
"splitLine": {
"show": true,
"lineStyle": {
"show": true,
"width": 1,
"opacity": 1,
"curveness": 0,
"type": "dashed"
}
}
}
],
"legend": [
{
"data": [
"广州",
"河源",
"惠州",
"深圳",
],
"selected": {},
"show": true,
"right": "1%",
"top": "2%",
"orient": "vertical",
"padding": 5,
"itemGap": 10,
"itemWidth": 25,
"itemHeight": 14,
"icon": "roundRect",
"backgroundColor": "transparent",
"borderColor": "#ccc",
"borderWidth": 1,
"borderRadius": 0,
"pageButtonItemGap": 5,
"pageButtonPosition": "end",
"pageFormatter": "{current}/{total}",
"pageIconColor": "#2f4554",
"pageIconInactiveColor": "#aaa",
"pageIconSize": 15,
"animationDurationUpdate": 800,
"selector": false,
"selectorPosition": "auto",
"selectorItemGap": 7,
"selectorButtonGap": 10
}
]
},
"options": [
{
"backgroundColor": new echarts.graphic.LinearGradient(0, 0, 0, 1, [{offset: 0, color: '#c86589'}, {offset: 1, color: '#06a7ff'}], false),
"series": [
{
"type": "line",
"name": "广州",
"connectNulls": false,
"xAxisIndex": 0,
"symbolSize": 5,
"showSymbol": true,
"smooth": true,
"clip": true,
"step": false,
"data": [
[
1,
15.709677
]
],
"hoverAnimation": true,
"label": {
"show": false,
"margin": 8
},
"logBase": 10,
"seriesLayoutBy": "column",
"lineStyle": {
"normal": {
"width": 4,
"shadowColor": "blue",
"shadowBlur": 10,
"shadowOffsetY": 10,
"shadowOffsetX": 10
}
},
"areaStyle": {
"opacity": 0
},
"zlevel": 0,
"z": 0,
"rippleEffect": {
"show": true,
"brushType": "stroke",
"scale": 2.5,
"period": 4
}
},
{
"type": "line",
"name": "河源",
"connectNulls": false,
"xAxisIndex": 0,
"symbolSize": 5,
"showSymbol": true,
"smooth": true,
"clip": true,
"step": false,
"data": [
[
1,
15.080645
]
],
"hoverAnimation": true,
"label": {
"show": false,
"margin": 8
},
"logBase": 10,
"seriesLayoutBy": "column",
"lineStyle": {
"normal": {
"width": 4,
"shadowColor": "green",
"shadowBlur": 10,
"shadowOffsetY": 10,
"shadowOffsetX": 10
}
},
"areaStyle": {
"opacity": 0
},
"zlevel": 0,
"z": 0,
"rippleEffect": {
"show": true,
"brushType": "stroke",
"scale": 2.5,
"period": 4
}
},
{
"type": "line",
"name": "惠州",
"connectNulls": false,
"xAxisIndex": 0,
"symbolSize": 5,
"showSymbol": true,
"smooth": true,
"clip": true,
"step": false,
"data": [
[
1,
17.290323
]
],
"hoverAnimation": true,
"label": {
"show": false,
"margin": 8
},
"logBase": 10,
"seriesLayoutBy": "column",
"lineStyle": {
"normal": {
"width": 4,
"shadowColor": "yellow",
"shadowBlur": 10,
"shadowOffsetY": 10,
"shadowOffsetX": 10
}
},
"areaStyle": {
"opacity": 0
},
"zlevel": 0,
"z": 0,
"rippleEffect": {
"show": true,
"brushType": "stroke",
"scale": 2.5,
"period": 4
}
},
{
"type": "line",
"name": "深圳",
"connectNulls": false,
"xAxisIndex": 0,
"symbolSize": 5,
"showSymbol": true,
"smooth": true,
"clip": true,
"step": false,
"data": [
[
1,
17.580645
]
],
"hoverAnimation": true,
"label": {
"show": false,
"margin": 8
},
"logBase": 10,
"seriesLayoutBy": "column",
"lineStyle": {
"normal": {
"width": 4,
"shadowColor": "red",
"shadowBlur": 10,
"shadowOffsetY": 10,
"shadowOffsetX": 10
}
},
"areaStyle": {
"opacity": 0
},
"zlevel": 0,
"z": 0,
"rippleEffect": {
"show": true,
"brushType": "stroke",
"scale": 2.5,
"period": 4
}
},
],
"xAxis": [
{
"type": "category",
"show": true,
"scale": false,
"nameLocation": "end",
"nameGap": 15,
"gridIndex": 0,
"axisLine": {
"show": true,
"onZero": true,
"onZeroAxisIndex": 0,
"lineStyle": {
"show": true,
"width": 2,
"opacity": 1,
"curveness": 0,
"type": "solid",
"color": "#DB7093"
}
},
"axisLabel": {
"show": true,
"color": "red",
"margin": 8,
"fontSize": 14
},
"inverse": false,
"offset": 0,
"splitNumber": 5,
"boundaryGap": false,
"minInterval": 0,
"splitLine": {
"show": true,
"lineStyle": {
"show": true,
"width": 1,
"opacity": 1,
"curveness": 0,
"type": "solid"
}
},
"data": [
1,
2,
3,
4,
5,
6,
7,
8,
9,
10,
11,
12
]
}
],
"yAxis": [
{
"name": "平均温度",
"show": true,
"scale": true,
"nameLocation": "end",
"nameGap": 15,
"nameTextStyle": {
"color": "blue",
"fontWeight": "bold",
"fontSize": 16
},
"gridIndex": 0,
"axisLine": {
"show": true,
"onZero": true,
"onZeroAxisIndex": 0,
"lineStyle": {
"show": true,
"width": 2,
"opacity": 1,
"curveness": 0,
"type": "solid",
"color": "blue"
}
},
"axisLabel": {
"show": true,
"color": "blue",
"margin": 8,
"fontSize": 13
},
"inverse": false,
"offset": 0,
"splitNumber": 5,
"min": 5,
"max": 27,
"minInterval": 0,
"splitLine": {
"show": true,
"lineStyle": {
"show": true,
"width": 1,
"opacity": 1,
"curveness": 0,
"type": "dashed"
}
}
}
],
"title": [
{
"show": true,
"text": "广州河源惠州深圳2022年每月平均温度变化趋势",
"target": "blank",
"subtarget": "blank",
"left": "center",
"top": "2%",
"padding": 5,
"itemGap": 10,
"textAlign": "auto",
"textVerticalAlign": "auto",
"triggerEvent": false,
"textStyle": {
"color": "red",
"fontSize": 20
}
}
],
"tooltip": {
"show": true,
"trigger": "axis",
"triggerOn": "mousemove|click",
"axisPointer": {
"type": "cross"
},
"showContent": true,
"alwaysShowContent": false,
"showDelay": 0,
"hideDelay": 100,
"enterable": false,
"confine": false,
"appendToBody": false,
"transitionDuration": 0.4,
"textStyle": {
"color": "#000"
},
"backgroundColor": "rgba(245, 245, 245, 0.8)",
"borderColor": "#ccc",
"borderWidth": 1,
"padding": 5,
"order": "seriesAsc"
},
"color": [
"#5470c6",
"#91cc75",
"#fac858",
"#ee6666",
"#73c0de",
"#3ba272",
"#fc8452",
"#9a60b4",
"#ea7ccc"
]
},
{
"backgroundColor": new echarts.graphic.LinearGradient(0, 0, 0, 1, [{offset: 0, color: '#c86589'}, {offset: 1, color: '#06a7ff'}], false),
"series": [
{
"type": "line",
"name": "广州",
"connectNulls": false,
"xAxisIndex": 0,
"symbolSize": 5,
"showSymbol": true,
"smooth": true,
"clip": true,
"step": false,
"data": [
[
1,
15.709677
],
[
2,
12.232143
]
],
"hoverAnimation": true,
"label": {
"show": false,
"margin": 8
},
"logBase": 10,
"seriesLayoutBy": "column",
"lineStyle": {
"normal": {
"width": 4,
"shadowColor": "#696969",
"shadowBlur": 10,
"shadowOffsetY": 10,
"shadowOffsetX": 10
}
},
"areaStyle": {
"opacity": 0
},
"zlevel": 0,
"z": 0,
"rippleEffect": {
"show": true,
"brushType": "stroke",
"scale": 2.5,
"period": 4
}
},
{
"type": "line",
"name": "河源",
"connectNulls": false,
"xAxisIndex": 0,
"symbolSize": 5,
"showSymbol": true,
"smooth": true,
"clip": true,
"step": false,
"data": [
[
1,
15.080645
],
[
2,
11.607143
]
],
"hoverAnimation": true,
"label": {
"show": false,
"margin": 8
},
"logBase": 10,
"seriesLayoutBy": "column",
"lineStyle": {
"normal": {
"width": 4,
"shadowColor": "#696969",
"shadowBlur": 10,
"shadowOffsetY": 10,
"shadowOffsetX": 10
}
},
"areaStyle": {
"opacity": 0
},
"zlevel": 0,
"z": 0,
"rippleEffect": {
"show": true,
"brushType": "stroke",
"scale": 2.5,
"period": 4
}
},
{
"type": "line",
"name": "惠州",
"connectNulls": false,
"xAxisIndex": 0,
"symbolSize": 5,
"showSymbol": true,
"smooth": true,
"clip": true,
"step": false,
"data": [
[
1,
17.290323
],
[
2,
14.035714
]
],
"hoverAnimation": true,
"label": {
"show": false,
"margin": 8
},
"logBase": 10,
"seriesLayoutBy": "column",
"lineStyle": {
"normal": {
"width": 4,
"shadowColor": "yellow",
"shadowBlur": 10,
"shadowOffsetY": 10,
"shadowOffsetX": 10
}
},
"areaStyle": {
"opacity": 0
},
"zlevel": 0,
"z": 0,
"rippleEffect": {
"show": true,
"brushType": "stroke",
"scale": 2.5,
"period": 4
}
},
{
"type": "line",
"name": "深圳",
"connectNulls": false,
"xAxisIndex": 0,
"symbolSize": 5,
"showSymbol": true,
"smooth": true,
"clip": true,
"step": false,
"data": [
[
1,
17.580645
],
[
2,
14.232143
]
],
"hoverAnimation": true,
"label": {
"show": false,
"margin": 8
},
"logBase": 10,
"seriesLayoutBy": "column",
"lineStyle": {
"normal": {
"width": 4,
"shadowColor": "red",
"shadowBlur": 10,
"shadowOffsetY": 10,
"shadowOffsetX": 10
}
},
"areaStyle": {
"opacity": 0
},
"zlevel": 0,
"z": 0,
"rippleEffect": {
"show": true,
"brushType": "stroke",
"scale": 2.5,
"period": 4
}
}
],
"xAxis": [
{
"type": "category",
"show": true,
"scale": false,
"nameLocation": "end",
"nameGap": 15,
"gridIndex": 0,
"axisLine": {
"show": true,
"onZero": true,
"onZeroAxisIndex": 0,
"lineStyle": {
"show": true,
"width": 2,
"opacity": 1,
"curveness": 0,
"type": "solid",
"color": "#DB7093"
}
},
"axisLabel": {
"show": true,
"color": "red",
"margin": 8,
"fontSize": 14
},
"inverse": false,
"offset": 0,
"splitNumber": 5,
"boundaryGap": false,
"minInterval": 0,
"splitLine": {
"show": true,
"lineStyle": {
"show": true,
"width": 1,
"opacity": 1,
"curveness": 0,
"type": "solid"
}
},
"data": [
1,
2,
3,
4,
5,
6,
7,
8,
9,
10,
11,
12
]
}
],
"yAxis": [
{
"name": "平均温度",
"show": true,
"scale": true,
"nameLocation": "end",
"nameGap": 15,
"nameTextStyle": {
"color": "#5470c6",
"fontWeight": "bold",
"fontSize": 16
},
"gridIndex": 0,
"axisLine": {
"show": true,
"onZero": true,
"onZeroAxisIndex": 0,
"lineStyle": {
"show": true,
"width": 2,
"opacity": 1,
"curveness": 0,
"type": "solid",
"color": "#5470c6"
}
},
"axisLabel": {
"show": true,
"color": "#5470c6",
"margin": 8,
"fontSize": 13
},
"inverse": false,
"offset": 0,
"splitNumber": 5,
"min": 2,
"max": 24,
"minInterval": 0,
"splitLine": {
"show": true,
"lineStyle": {
"show": true,
"width": 1,
"opacity": 1,
"curveness": 0,
"type": "dashed"
}
}
}
],
"title": [
{
"show": true,
"text": "广州河源惠州深圳2022年每月平均温度发生变化的趋势",
"target": "blank",
"subtarget": "blank",
"left": "center",
"top": "2%",
"padding": 5,
"itemGap": 10,
"textAlign": "auto",
"textVerticalAlign": "auto",
"triggerEvent": false,
"textStyle": {
"color": "#DC143C",
"fontSize": 20
}
}
],
"tooltip": {
"show": true,
"trigger": "axis",
"triggerOn": "mousemove|click",
"axisPointer": {
"type": "cross"
},
"showContent": true,
"alwaysShowContent": false,
"showDelay": 0,
"hideDelay": 100,
"enterable": false,
"confine": false,
"appendToBody": false,
"transitionDuration": 0.4,
"textStyle": {
"color": "#000"
},
"backgroundColor": "rgba(245, 245, 245, 0.8)",
"borderColor": "#ccc",
"borderWidth": 1,
"padding": 5,
"order": "seriesAsc"
},
"color": [
"#5470c6",
"#91cc75",
"#fac858",
"#ee6666",
"#73c0de",
"#3ba272",
"#fc8452",
"#9a60b4",
"#ea7ccc"
]
},
{
"backgroundColor": new echarts.graphic.LinearGradient(0, 0, 0, 1, [{offset: 0, color: '#blue'}, {offset: 1, color: '#yellow'},{offset:2,color:'#red'},{offset:3,color:'#green'}], false),
"series": [
{
"type": "line",
"name": "广州",
"connectNulls": false,
"xAxisIndex": 0,
"symbolSize": 5,
"showSymbol": true,
"smooth": true,
"clip": true,
"step": false,
"data": [
[
1,
15.709677
],
[
2,
12.232143
],
[
3,
21.177419
]
],
"hoverAnimation": true,
"label": {
"show": false,
"margin": 8
},
"logBase": 10,
"seriesLayoutBy": "column",
"lineStyle": {
"normal": {
"width": 4,
"shadowColor": "#696969",
"shadowBlur": 10,
"shadowOffsetY": 10,
"shadowOffsetX": 10
}
},
"areaStyle": {
"opacity": 0
},
"zlevel": 0,
"z": 0,
"rippleEffect": {
"show": true,
"brushType": "stroke",
"scale": 2.5,
"period": 4
}
},
{
"type": "line",
"name": "河源",
"connectNulls": false,
"xAxisIndex": 0,
"symbolSize": 5,
"showSymbol": true,
"smooth": true,
"clip": true,
"step": false,
"data": [
[
1,
15.080645
],
[
2,
11.607143
],
[
3,
21.096774
]
],
"hoverAnimation": true,
"label": {
"show": false,
"margin": 8
},
"logBase": 10,
"seriesLayoutBy": "column",
"lineStyle": {
"normal": {
"width": 4,
"shadowColor": "#696969",
"shadowBlur": 10,
"shadowOffsetY": 10,
"shadowOffsetX": 10
}
},
"areaStyle": {
"opacity": 0
},
"zlevel": 0,
"z": 0,
"rippleEffect": {
"show": true,
"brushType": "stroke",
"scale": 2.5,
"period": 4
}
},
{
"type": "line",
"name": "惠州",
"connectNulls": false,
"xAxisIndex": 0,
"symbolSize": 5,
"showSymbol": true,
"smooth": true,
"clip": true,
"step": false,
"data": [
[
1,
17.290323
],
[
2,
14.035714
],
[
3,
21.677419
]
],
"hoverAnimation": true,
"label": {
"show": false,
"margin": 8
},
"logBase": 10,
"seriesLayoutBy": "column",
"lineStyle": {
"normal": {
"width": 4,
"shadowColor": "yellow",
"shadowBlur": 10,
"shadowOffsetY": 10,
"shadowOffsetX": 10
}
},
"areaStyle": {
"opacity": 0
},
"zlevel": 0,
"z": 0,
"rippleEffect": {
"show": true,
"brushType": "stroke",
"scale": 2.5,
"period": 4
}
},
{
"type": "line",
"name": "深圳",
"connectNulls": false,
"xAxisIndex": 0,
"symbolSize": 5,
"showSymbol": true,
"smooth": true,
"clip": true,
"step": false,
"data": [
[
1,
17.580645
],
[
2,
14.232143
],
[
3,
21.596774
]
],
"hoverAnimation": true,
"label": {
"show": false,
"margin": 8
},
"logBase": 10,
"seriesLayoutBy": "column",
"lineStyle": {
"normal": {
"width": 4,
"shadowColor": "red",
"shadowBlur": 10,
"shadowOffsetY": 10,
"shadowOffsetX": 10
}
},
"areaStyle": {
"opacity": 0
},
"zlevel": 0,
"z": 0,
"rippleEffect": {
"show": true,
"brushType": "stroke",
"scale": 2.5,
"period": 4
}
}
],
"xAxis": [
{
"type": "category",
"show": true,
"scale": false,
"nameLocation": "end",
"nameGap": 15,
"gridIndex": 0,
"axisLine": {
"show": true,
"onZero": true,
"onZeroAxisIndex": 0,
"lineStyle": {
"show": true,
"width": 2,
"opacity": 1,
"curveness": 0,
"type": "solid",
"color": "#DB7093"
}
},
"axisLabel": {
"show": true,
"color": "red",
"margin": 8,
"fontSize": 14
},
"inverse": false,
"offset": 0,
"splitNumber": 5,
"boundaryGap": false,
"minInterval": 0,
"splitLine": {
"show": true,
"lineStyle": {
"show": true,
"width": 1,
"opacity": 1,
"curveness": 0,
"type": "solid"
}
},
"data": [
1,
2,
3,
4,
5,
6,
7,
8,
9,
10,
11,
12
]
}
],
"yAxis": [
{
"name": "平均温度",
"show": true,
"scale": true,
"nameLocation": "end",
"nameGap": 15,
"nameTextStyle": {
"color": "#5470c6",
"fontWeight": "bold",
"fontSize": 16
},
"gridIndex": 0,
"axisLine": {
"show": true,
"onZero": true,
"onZeroAxisIndex": 0,
"lineStyle": {
"show": true,
"width": 2,
"opacity": 1,
"curveness": 0,
"type": "solid",
"color": "#5470c6"
}
},
"axisLabel": {
"show": true,
"color": "#5470c6",
"margin": 8,
"fontSize": 13
},
"inverse": false,
"offset": 0,
"splitNumber": 5,
"min": 11,
"max": 31,
"minInterval": 0,
"splitLine": {
"show": true,
"lineStyle": {
"show": true,
"width": 1,
"opacity": 1,
"curveness": 0,
"type": "dashed"
}
}
}
],
"title": [
{
"show": true,
"text": "广州河源惠州深圳2022年每月平均温度发生变化的趋势",
"target": "blank",
"subtarget": "blank",
"left": "center",
"top": "2%",
"padding": 5,
"itemGap": 10,
"textAlign": "auto",
"textVerticalAlign": "auto",
"triggerEvent": false,
"textStyle": {
"color": "#DC143C",
"fontSize": 20
}
}
],
"tooltip": {
"show": true,
"trigger": "axis",
"triggerOn": "mousemove|click",
"axisPointer": {
"type": "cross"
},
"showContent": true,
"alwaysShowContent": false,
"showDelay": 0,
"hideDelay": 100,
"enterable": false,
"confine": false,
"appendToBody": false,
"transitionDuration": 0.4,
"textStyle": {
"color": "#000"
},
"backgroundColor": "rgba(245, 245, 245, 0.8)",
"borderColor": "#ccc",
"borderWidth": 1,
"padding": 5,
"order": "seriesAsc"
},
"color": [
"#5470c6",
"#91cc75",
"#fac858",
"#ee6666",
"#73c0de",
"#3ba272",
"#fc8452",
"#9a60b4",
"#ea7ccc"
]
},
{
"backgroundColor": new echarts.graphic.LinearGradient(0, 0, 0, 1, [{offset: 0, color: '#c86589'}, {offset: 1, color: '#06a7ff'}], false),
"series": [
{
"type": "line",
"name": "广州",
"connectNulls": false,
"xAxisIndex": 0,
"symbolSize": 5,
"showSymbol": true,
"smooth": true,
"clip": true,
"step": false,
"data": [
[
1,
15.709677
],
[
2,
12.232143
],
[
3,
21.177419
],
[
4,
22.533333
]
],
"hoverAnimation": true,
"label": {
"show": false,
"margin": 8
},
"logBase": 10,
"seriesLayoutBy": "column",
"lineStyle": {
"normal": {
"width": 4,
"shadowColor": "#696969",
"shadowBlur": 10,
"shadowOffsetY": 10,
"shadowOffsetX": 10
}
},
"areaStyle": {
"opacity": 0
},
"zlevel": 0,
"z": 0,
"rippleEffect": {
"show": true,
"brushType": "stroke",
"scale": 2.5,
"period": 4
}
},
{
"type": "line",
"name": "河源",
"connectNulls": false,
"xAxisIndex": 0,
"symbolSize": 5,
"showSymbol": true,
"smooth": true,
"clip": true,
"step": false,
"data": [
[
1,
15.080645
],
[
2,
11.607143
],
[
3,
21.096774
],
[
4,
22.300000
]
],
"hoverAnimation": true,
"label": {
"show": false,
"margin": 8
},
"logBase": 10,
"seriesLayoutBy": "column",
"lineStyle": {
"normal": {
"width": 4,
"shadowColor": "#696969",
"shadowBlur": 10,
"shadowOffsetY": 10,
"shadowOffsetX": 10
}
},
"areaStyle": {
"opacity": 0
},
"zlevel": 0,
"z": 0,
"rippleEffect": {
"show": true,
"brushType": "stroke",
"scale": 2.5,
"period": 4
}
},
{
"type": "line",
"name": "惠州",
"connectNulls": false,
"xAxisIndex": 0,
"symbolSize": 5,
"showSymbol": true,
"smooth": true,
"clip": true,
"step": false,
"data": [
[
1,
17.290323
],
[
2,
14.035714
],
[
3,
21.677419
],
[
4,
22.750000
]
],
"hoverAnimation": true,
"label": {
"show": false,
"margin": 8
},
"logBase": 10,
"seriesLayoutBy": "column",
"lineStyle": {
"normal": {
"width": 4,
"shadowColor": "#696969",
"shadowBlur": 10,
"shadowOffsetY": 10,
"shadowOffsetX": 10
}
},
"areaStyle": {
"opacity": 0
},
"zlevel": 0,
"z": 0,
"rippleEffect": {
"show": true,
"brushType": "stroke",
"scale": 2.5,
"period": 4
}
},
{
"type": "line",
"name": "深圳",
"connectNulls": false,
"xAxisIndex": 0,
"symbolSize": 5,
"showSymbol": true,
"smooth": true,
"clip": true,
"step": false,
"data": [
[
1,
17.580645
],
[
2,
14.232143
],
[
3,
21.596774
],
[
4,
23.466667
]
],
"hoverAnimation": true,
"label": {
"show": false,
"margin": 8
},
"logBase": 10,
"seriesLayoutBy": "column",
"lineStyle": {
"normal": {
"width": 4,
"shadowColor": "#696969",
"shadowBlur": 10,
"shadowOffsetY": 10,
"shadowOffsetX": 10
}
},
"areaStyle": {
"opacity": 0
},
"zlevel": 0,
"z": 0,
"rippleEffect": {
"show": true,
"brushType": "stroke",
"scale": 2.5,
"period": 4
}
}
],
"xAxis": [
{
"type": "category",
"show": true,
"scale": false,
"nameLocation": "end",
"nameGap": 15,
"gridIndex": 0,
"axisLine": {
"show": true,
"onZero": true,
"onZeroAxisIndex": 0,
"lineStyle": {
"show": true,
"width": 2,
"opacity": 1,
"curveness": 0,
"type": "solid",
"color": "#DB7093"
}
},
"axisLabel": {
"show": true,
"color": "red",
"margin": 8,
"fontSize": 14
},
"inverse": false,
"offset": 0,
"splitNumber": 5,
"boundaryGap": false,
"minInterval": 0,
"splitLine": {
"show": true,
"lineStyle": {
"show": true,
"width": 1,
"opacity": 1,
"curveness": 0,
"type": "solid"
}
},
"data": [
1,
2,
3,
4,
5,
6,
7,
8,
9,
10,
11,
12
]
}
],
"yAxis": [
{
"name": "平均温度",
"show": true,
"scale": true,
"nameLocation": "end",
"nameGap": 15,
"nameTextStyle": {
"color": "#5470c6",
"fontWeight": "bold",
"fontSize": 16
},
"gridIndex": 0,
"axisLine": {
"show": true,
"onZero": true,
"onZeroAxisIndex": 0,
"lineStyle": {
"show": true,
"width": 2,
"opacity": 1,
"curveness": 0,
"type": "solid",
"color": "#5470c6"
}
},
"axisLabel": {
"show": true,
"color": "#5470c6",
"margin": 8,
"fontSize": 13
},
"inverse": false,
"offset": 0,
"splitNumber": 5,
"min": 12,
"max": 32,
"minInterval": 0,
"splitLine": {
"show": true,
"lineStyle": {
"show": true,
"width": 1,
"opacity": 1,
"curveness": 0,
"type": "dashed"
}
}
}
],
"title": [
{
"show": true,
"text": "广州河源惠州深圳2022年每月平均温度变化趋势",
"target": "blank",
"subtarget": "blank",
"left": "center",
"top": "2%",
"padding": 5,
"itemGap": 10,
"textAlign": "auto",
"textVerticalAlign": "auto",
"triggerEvent": false,
"textStyle": {
"color": "#DC143C",
"fontSize": 20
}
}
],
"tooltip": {
"show": true,
"trigger": "axis",
"triggerOn": "mousemove|click",
"axisPointer": {
"type": "cross"
},
"showContent": true,
"alwaysShowContent": false,
"showDelay": 0,
"hideDelay": 100,
"enterable": false,
"confine": false,
"appendToBody": false,
"transitionDuration": 0.4,
"textStyle": {
"color": "#000"
},
"backgroundColor": "rgba(245, 245, 245, 0.8)",
"borderColor": "#ccc",
"borderWidth": 1,
"padding": 5,
"order": "seriesAsc"
},
"color": [
"#5470c6",
"#91cc75",
"#fac858",
"#ee6666",
"#73c0de",
"#3ba272",
"#fc8452",
"#9a60b4",
"#ea7ccc"
]
},
{
"backgroundColor": new echarts.graphic.LinearGradient(0, 0, 0, 1, [{offset: 0, color: '#c86589'}, {offset: 1, color: '#06a7ff'}], false),
"series": [
{
"type": "line",
"name": "广州",
"connectNulls": false,
"xAxisIndex": 0,
"symbolSize": 5,
"showSymbol": true,
"smooth": true,
"clip": true,
"step": false,
"data": [
[
1,
15.709677
],
[
2,
12.232143
],
[
3,
21.177419
],
[
4,
22.533333
],
[
5,
24.370968
]
],
"hoverAnimation": true,
"label": {
"show": false,
"margin": 8
},
"logBase": 10,
"seriesLayoutBy": "column",
"lineStyle": {
"normal": {
"width": 4,
"shadowColor": "#696969",
"shadowBlur": 10,
"shadowOffsetY": 10,
"shadowOffsetX": 10
}
},
"areaStyle": {
"opacity": 0
},
"zlevel": 0,
"z": 0,
"rippleEffect": {
"show": true,
"brushType": "stroke",
"scale": 2.5,
"period": 4
}
},
{
"type": "line",
"name": "河源",
"connectNulls": false,
"xAxisIndex": 0,
"symbolSize": 5,
"showSymbol": true,
"smooth": true,
"clip": true,
"step": false,
"data": [
[
1,
15.080645
],
[
2,
11.607143
],
[
3,
21.096774
],
[
4,
22.300000
],
[
5,
23.887097
]
],
"hoverAnimation": true,
"label": {
"show": false,
"margin": 8
},
"logBase": 10,
"seriesLayoutBy": "column",
"lineStyle": {
"normal": {
"width": 4,
"shadowColor": "#696969",
"shadowBlur": 10,
"shadowOffsetY": 10,
"shadowOffsetX": 10
}
},
"areaStyle": {
"opacity": 0
},
"zlevel": 0,
"z": 0,
"rippleEffect": {
"show": true,
"brushType": "stroke",
"scale": 2.5,
"period": 4
}
},
{
"type": "line",
"name": "惠州",
"connectNulls": false,
"xAxisIndex": 0,
"symbolSize": 5,
"showSymbol": true,
"smooth": true,
"clip": true,
"step": false,
"data": [
[
1,
17.290323
],
[
2,
14.035714
],
[
3,
21.677419
],
[
4,
22.750000
],
[
5,
24.774194
]
],
"hoverAnimation": true,
"label": {
"show": false,
"margin": 8
},
"logBase": 10,
"seriesLayoutBy": "column",
"lineStyle": {
"normal": {
"width": 4,
"shadowColor": "#696969",
"shadowBlur": 10,
"shadowOffsetY": 10,
"shadowOffsetX": 10
}
},
"areaStyle": {
"opacity": 0
},
"zlevel": 0,
"z": 0,
"rippleEffect": {
"show": true,
"brushType": "stroke",
"scale": 2.5,
"period": 4
}
},
{
"type": "line",
"name": "深圳",
"connectNulls": false,
"xAxisIndex": 0,
"symbolSize": 5,
"showSymbol": true,
"smooth": true,
"clip": true,
"step": false,
"data": [
[
1,
17.580645
],
[
2,
14.232143
],
[
3,
21.596774
],
[
4,
23.466667
],
[
5,
25.064516
]
],
"hoverAnimation": true,
"label": {
"show": false,
"margin": 8
},
"logBase": 10,
"seriesLayoutBy": "column",
"lineStyle": {
"normal": {
"width": 4,
"shadowColor": "#696969",
"shadowBlur": 10,
"shadowOffsetY": 10,
"shadowOffsetX": 10
}
},
"areaStyle": {
"opacity": 0
},
"zlevel": 0,
"z": 0,
"rippleEffect": {
"show": true,
"brushType": "stroke",
"scale": 2.5,
"period": 4
}
}
],
"xAxis": [
{
"type": "category",
"show": true,
"scale": false,
"nameLocation": "end",
"nameGap": 15,
"gridIndex": 0,
"axisLine": {
"show": true,
"onZero": true,
"onZeroAxisIndex": 0,
"lineStyle": {
"show": true,
"width": 2,
"opacity": 1,
"curveness": 0,
"type": "solid",
"color": "#DB7093"
}
},
"axisLabel": {
"show": true,
"color": "red",
"margin": 8,
"fontSize": 14
},
"inverse": false,
"offset": 0,
"splitNumber": 5,
"boundaryGap": false,
"minInterval": 0,
"splitLine": {
"show": true,
"lineStyle": {
"show": true,
"width": 1,
"opacity": 1,
"curveness": 0,
"type": "solid"
}
},
"data": [
1,
2,
3,
4,
5,
6,
7,
8,
9,
10,
11,
12
]
}
],
"yAxis": [
{
"name": "平均温度",
"show": true,
"scale": true,
"nameLocation": "end",
"nameGap": 15,
"nameTextStyle": {
"color": "#5470c6",
"fontWeight": "bold",
"fontSize": 16
},
"gridIndex": 0,
"axisLine": {
"show": true,
"onZero": true,
"onZeroAxisIndex": 0,
"lineStyle": {
"show": true,
"width": 2,
"opacity": 1,
"curveness": 0,
"type": "solid",
"color": "#5470c6"
}
},
"axisLabel": {
"show": true,
"color": "#5470c6",
"margin": 8,
"fontSize": 13
},
"inverse": false,
"offset": 0,
"splitNumber": 5,
"min": 14,
"max": 35,
"minInterval": 0,
"splitLine": {
"show": true,
"lineStyle": {
"show": true,
"width": 1,
"opacity": 1,
"curveness": 0,
"type": "dashed"
}
}
}
],
"title": [
{
"show": true,
"text": "广州河源惠州深圳2022年每月平均温度发生变化的趋势",
"target": "blank",
"subtarget": "blank",
"left": "center",
"top": "2%",
"padding": 5,
"itemGap": 10,
"textAlign": "auto",
"textVerticalAlign": "auto",
"triggerEvent": false,
"textStyle": {
"color": "#DC143C",
"fontSize": 20
}
}
],
"tooltip": {
"show": true,
"trigger": "axis",
"triggerOn": "mousemove|click",
"axisPointer": {
"type": "cross"
},
"showContent": true,
"alwaysShowContent": false,
"showDelay": 0,
"hideDelay": 100,
"enterable": false,
"confine": false,
"appendToBody": false,
"transitionDuration": 0.4,
"textStyle": {
"color": "#000"
},
"backgroundColor": "rgba(245, 245, 245, 0.8)",
"borderColor": "#ccc",
"borderWidth": 1,
"padding": 5,
"order": "seriesAsc"
},
"color": [
"#5470c6",
"#91cc75",
"#fac858",
"#ee6666",
"#73c0de",
"#3ba272",
"#fc8452",
"#9a60b4",
"#ea7ccc"
]
},
{
"backgroundColor": new echarts.graphic.LinearGradient(0, 0, 0, 1, [{offset: 0, color: '#c86589'}, {offset: 1, color: '#06a7ff'}], false),
"series": [
{
"type": "line",
"name": "广州",
"connectNulls": false,
"xAxisIndex": 0,
"symbolSize": 5,
"showSymbol": true,
"smooth": true,
"clip": true,
"step": false,
"data": [
[
1,
15.709677
],
[
2,
12.232143
],
[
3,
21.177419
],
[
4,
22.533333
],
[
5,
24.370968
],
[
6,
28.000000
]
],
"hoverAnimation": true,
"label": {
"show": false,
"margin": 8
},
"logBase": 10,
"seriesLayoutBy": "column",
"lineStyle": {
"normal": {
"width": 4,
"shadowColor": "#696969",
"shadowBlur": 10,
"shadowOffsetY": 10,
"shadowOffsetX": 10
}
},
"areaStyle": {
"opacity": 0
},
"zlevel": 0,
"z": 0,
"rippleEffect": {
"show": true,
"brushType": "stroke",
"scale": 2.5,
"period": 4
}
},
{
"type": "line",
"name": "河源",
"connectNulls": false,
"xAxisIndex": 0,
"symbolSize": 5,
"showSymbol": true,
"smooth": true,
"clip": true,
"step": false,
"data": [
[
1,
15.080645
],
[
2,
11.607143
],
[
3,
21.096774
],
[
4,
22.300000
],
[
5,
23.887097
],
[
6,
27.550000
]
],
"hoverAnimation": true,
"label": {
"show": false,
"margin": 8
},
"logBase": 10,
"seriesLayoutBy": "column",
"lineStyle": {
"normal": {
"width": 4,
"shadowColor": "#696969",
"shadowBlur": 10,
"shadowOffsetY": 10,
"shadowOffsetX": 10
}
},
"areaStyle": {
"opacity": 0
},
"zlevel": 0,
"z": 0,
"rippleEffect": {
"show": true,
"brushType": "stroke",
"scale": 2.5,
"period": 4
}
},
{
"type": "line",
"name": "惠州",
"connectNulls": false,
"xAxisIndex": 0,
"symbolSize": 5,
"showSymbol": true,
"smooth": true,
"clip": true,
"step": false,
"data": [
[
1,
17.290323
],
[
2,
14.035714
],
[
3,
21.677419
],
[
4,
22.750000
],
[
5,
24.774194
],
[
6,
28.050000
]
],
"hoverAnimation": true,
"label": {
"show": false,
"margin": 8
},
"logBase": 10,
"seriesLayoutBy": "column",
"lineStyle": {
"normal": {
"width": 4,
"shadowColor": "#696969",
"shadowBlur": 10,
"shadowOffsetY": 10,
"shadowOffsetX": 10
}
},
"areaStyle": {
"opacity": 0
},
"zlevel": 0,
"z": 0,
"rippleEffect": {
"show": true,
"brushType": "stroke",
"scale": 2.5,
"period": 4
}
},
{
"type": "line",
"name": "深圳",
"connectNulls": false,
"xAxisIndex": 0,
"symbolSize": 5,
"showSymbol": true,
"smooth": true,
"clip": true,
"step": false,
"data": [
[
1,
17.580645
],
[
2,
14.232143
],
[
3,
21.596774
],
[
4,
23.466667
],
[
5,
25.064516
],
[
6,
28.166667
]
],
"hoverAnimation": true,
"label": {
"show": false,
"margin": 8
},
"logBase": 10,
"seriesLayoutBy": "column",
"lineStyle": {
"normal": {
"width": 4,
"shadowColor": "#696969",
"shadowBlur": 10,
"shadowOffsetY": 10,
"shadowOffsetX": 10
}
},
"areaStyle": {
"opacity": 0
},
"zlevel": 0,
"z": 0,
"rippleEffect": {
"show": true,
"brushType": "stroke",
"scale": 2.5,
"period": 4
}
}
],
"xAxis": [
{
"type": "category",
"show": true,
"scale": false,
"nameLocation": "end",
"nameGap": 15,
"gridIndex": 0,
"axisLine": {
"show": true,
"onZero": true,
"onZeroAxisIndex": 0,
"lineStyle": {
"show": true,
"width": 2,
"opacity": 1,
"curveness": 0,
"type": "solid",
"color": "#DB7093"
}
},
"axisLabel": {
"show": true,
"color": "red",
"margin": 8,
"fontSize": 14
},
"inverse": false,
"offset": 0,
"splitNumber": 5,
"boundaryGap": false,
"minInterval": 0,
"splitLine": {
"show": true,
"lineStyle": {
"show": true,
"width": 1,
"opacity": 1,
"curveness": 0,
"type": "solid"
}
},
"data": [
1,
2,
3,
4,
5,
6,
7,
8,
9,
10,
11,
12
]
}
],
"yAxis": [
{
"name": "平均温度",
"show": true,
"scale": true,
"nameLocation": "end",
"nameGap": 15,
"nameTextStyle": {
"color": "#5470c6",
"fontWeight": "bold",
"fontSize": 16
},
"gridIndex": 0,
"axisLine": {
"show": true,
"onZero": true,
"onZeroAxisIndex": 0,
"lineStyle": {
"show": true,
"width": 2,
"opacity": 1,
"curveness": 0,
"type": "solid",
"color": "#5470c6"
}
},
"axisLabel": {
"show": true,
"color": "#5470c6",
"margin": 8,
"fontSize": 13
},
"inverse": false,
"offset": 0,
"splitNumber": 5,
"min": 18,
"max": 39,
"minInterval": 0,
"splitLine": {
"show": true,
"lineStyle": {
"show": true,
"width": 1,
"opacity": 1,
"curveness": 0,
"type": "dashed"
}
}
}
],
"title": [
{
"show": true,
"text": "广州河源惠州深圳2022年每月平均温度发生变化的趋势",
"target": "blank",
"subtarget": "blank",
"left": "center",
"top": "2%",
"padding": 5,
"itemGap": 10,
"textAlign": "auto",
"textVerticalAlign": "auto",
"triggerEvent": false,
"textStyle": {
"color": "#DC143C",
"fontSize": 20
}
}
],
"tooltip": {
"show": true,
"trigger": "axis",
"triggerOn": "mousemove|click",
"axisPointer": {
"type": "cross"
},
"showContent": true,
"alwaysShowContent": false,
"showDelay": 0,
"hideDelay": 100,
"enterable": false,
"confine": false,
"appendToBody": false,
"transitionDuration": 0.4,
"textStyle": {
"color": "#000"
},
"backgroundColor": "rgba(245, 245, 245, 0.8)",
"borderColor": "#ccc",
"borderWidth": 1,
"padding": 5,
"order": "seriesAsc"
},
"color": [
"#5470c6",
"#91cc75",
"#fac858",
"#ee6666",
"#73c0de",
"#3ba272",
"#fc8452",
"#9a60b4",
"#ea7ccc"
]
},
{
"backgroundColor": new echarts.graphic.LinearGradient(0, 0, 0, 1, [{offset: 0, color: '#c86589'}, {offset: 1, color: '#06a7ff'}], false),
"series": [
{
"type": "line",
"name": "广州",
"connectNulls": false,
"xAxisIndex": 0,
"symbolSize": 5,
"showSymbol": true,
"smooth": true,
"clip": true,
"step": false,
"data": [
[
1,
15.709677
],
[
2,
12.232143
],
[
3,
21.177419
],
[
4,
22.533333
],
[
5,
24.370968
],
[
6,
28.000000
],
[
7,
30.354839
]
],
"hoverAnimation": true,
"label": {
"show": false,
"margin": 8
},
"logBase": 10,
"seriesLayoutBy": "column",
"lineStyle": {
"normal": {
"width": 4,
"shadowColor": "#696969",
"shadowBlur": 10,
"shadowOffsetY": 10,
"shadowOffsetX": 10
}
},
"areaStyle": {
"opacity": 0
},
"zlevel": 0,
"z": 0,
"rippleEffect": {
"show": true,
"brushType": "stroke",
"scale": 2.5,
"period": 4
}
},
{
"type": "line",
"name": "河源",
"connectNulls": false,
"xAxisIndex": 0,
"symbolSize": 5,
"showSymbol": true,
"smooth": true,
"clip": true,
"step": false,
"data": [
[
1,
15.080645
],
[
2,
11.607143
],
[
3,
21.096774
],
[
4,
22.300000
],
[
5,
23.887097
],
[
6,
27.550000
],
[
7,
30.419355
]
],
"hoverAnimation": true,
"label": {
"show": false,
"margin": 8
},
"logBase": 10,
"seriesLayoutBy": "column",
"lineStyle": {
"normal": {
"width": 4,
"shadowColor": "#696969",
"shadowBlur": 10,
"shadowOffsetY": 10,
"shadowOffsetX": 10
}
},
"areaStyle": {
"opacity": 0
},
"zlevel": 0,
"z": 0,
"rippleEffect": {
"show": true,
"brushType": "stroke",
"scale": 2.5,
"period": 4
}
},
{
"type": "line",
"name": "惠州",
"connectNulls": false,
"xAxisIndex": 0,
"symbolSize": 5,
"showSymbol": true,
"smooth": true,
"clip": true,
"step": false,
"data": [
[
1,
17.290323
],
[
2,
14.035714
],
[
3,
21.677419
],
[
4,
22.750000
],
[
5,
24.774194
],
[
6,
28.050000
],
[
7,
29.306452
]
],
"hoverAnimation": true,
"label": {
"show": false,
"margin": 8
},
"logBase": 10,
"seriesLayoutBy": "column",
"lineStyle": {
"normal": {
"width": 4,
"shadowColor": "#696969",
"shadowBlur": 10,
"shadowOffsetY": 10,
"shadowOffsetX": 10
}
},
"areaStyle": {
"opacity": 0
},
"zlevel": 0,
"z": 0,
"rippleEffect": {
"show": true,
"brushType": "stroke",
"scale": 2.5,
"period": 4
}
},
{
"type": "line",
"name": "深圳",
"connectNulls": false,
"xAxisIndex": 0,
"symbolSize": 5,
"showSymbol": true,
"smooth": true,
"clip": true,
"step": false,
"data": [
[
1,
17.580645
],
[
2,
14.232143
],
[
3,
21.596774
],
[
4,
23.466667
],
[
5,
25.064516
],
[
6,
28.166667
],
[
7,
30.016129
]
],
"hoverAnimation": true,
"label": {
"show": false,
"margin": 8
},
"logBase": 10,
"seriesLayoutBy": "column",
"lineStyle": {
"normal": {
"width": 4,
"shadowColor": "#696969",
"shadowBlur": 10,
"shadowOffsetY": 10,
"shadowOffsetX": 10
}
},
"areaStyle": {
"opacity": 0
},
"zlevel": 0,
"z": 0,
"rippleEffect": {
"show": true,
"brushType": "stroke",
"scale": 2.5,
"period": 4
}
}
],
"xAxis": [
{
"type": "category",
"show": true,
"scale": false,
"nameLocation": "end",
"nameGap": 15,
"gridIndex": 0,
"axisLine": {
"show": true,
"onZero": true,
"onZeroAxisIndex": 0,
"lineStyle": {
"show": true,
"width": 2,
"opacity": 1,
"curveness": 0,
"type": "solid",
"color": "#DB7093"
}
},
"axisLabel": {
"show": true,
"color": "red",
"margin": 8,
"fontSize": 14
},
"inverse": false,
"offset": 0,
"splitNumber": 5,
"boundaryGap": false,
"minInterval": 0,
"splitLine": {
"show": true,
"lineStyle": {
"show": true,
"width": 1,
"opacity": 1,
"curveness": 0,
"type": "solid"
}
},
"data": [
1,
2,
3,
4,
5,
6,
7,
8,
9,
10,
11,
12
]
}
],
"yAxis": [
{
"name": "平均温度",
"show": true,
"scale": true,
"nameLocation": "end",
"nameGap": 15,
"nameTextStyle": {
"color": "#5470c6",
"fontWeight": "bold",
"fontSize": 16
},
"gridIndex": 0,
"axisLine": {
"show": true,
"onZero": true,
"onZeroAxisIndex": 0,
"lineStyle": {
"show": true,
"width": 2,
"opacity": 1,
"curveness": 0,
"type": "solid",
"color": "#5470c6"
}
},
"axisLabel": {
"show": true,
"color": "#5470c6",
"margin": 8,
"fontSize": 13
},
"inverse": false,
"offset": 0,
"splitNumber": 5,
"min": 19,
"max": 40,
"minInterval": 0,
"splitLine": {
"show": true,
"lineStyle": {
"show": true,
"width": 1,
"opacity": 1,
"curveness": 0,
"type": "dashed"
}
}
}
],
"title": [
{
"show": true,
"text": "广州河源惠州深圳2022年每月平均温度发生变化的趋势",
"target": "blank",
"subtarget": "blank",
"left": "center",
"top": "2%",
"padding": 5,
"itemGap": 10,
"textAlign": "auto",
"textVerticalAlign": "auto",
"triggerEvent": false,
"textStyle": {
"color": "#DC143C",
"fontSize": 20
}
}
],
"tooltip": {
"show": true,
"trigger": "axis",
"triggerOn": "mousemove|click",
"axisPointer": {
"type": "cross"
},
"showContent": true,
"alwaysShowContent": false,
"showDelay": 0,
"hideDelay": 100,
"enterable": false,
"confine": false,
"appendToBody": false,
"transitionDuration": 0.4,
"textStyle": {
"color": "#000"
},
"backgroundColor": "rgba(245, 245, 245, 0.8)",
"borderColor": "#ccc",
"borderWidth": 1,
"padding": 5,
"order": "seriesAsc"
},
"color": [
"#5470c6",
"#91cc75",
"#fac858",
"#ee6666",
"#73c0de",
"#3ba272",
"#fc8452",
"#9a60b4",
"#ea7ccc"
]
},
{
"backgroundColor": new echarts.graphic.LinearGradient(0, 0, 0, 1, [{offset: 0, color: '#c86589'}, {offset: 1, color: '#06a7ff'}], false),
"series": [
{
"type": "line",
"name": "广州",
"connectNulls": false,
"xAxisIndex": 0,
"symbolSize": 5,
"showSymbol": true,
"smooth": true,
"clip": true,
"step": false,
"data": [
[
1,
15.709677
],
[
2,
12.232143
],
[
3,
21.177419
],
[
4,
22.533333
],
[
5,
24.370968
],
[
6,
28.000000
],
[
7,
30.354839
],
[
8,
29.000000
]
],
"hoverAnimation": true,
"label": {
"show": false,
"margin": 8
},
"logBase": 10,
"seriesLayoutBy": "column",
"lineStyle": {
"normal": {
"width": 4,
"shadowColor": "#696969",
"shadowBlur": 10,
"shadowOffsetY": 10,
"shadowOffsetX": 10
}
},
"areaStyle": {
"opacity": 0
},
"zlevel": 0,
"z": 0,
"rippleEffect": {
"show": true,
"brushType": "stroke",
"scale": 2.5,
"period": 4
}
},
{
"type": "line",
"name": "河源",
"connectNulls": false,
"xAxisIndex": 0,
"symbolSize": 5,
"showSymbol": true,
"smooth": true,
"clip": true,
"step": false,
"data": [
[
1,
15.080645
],
[
2,
11.607143
],
[
3,
21.096774
],
[
4,
22.300000
],
[
5,
23.887097
],
[
6,
27.550000
],
[
7,
30.419355
],
[
8,
29.677419
]
],
"hoverAnimation": true,
"label": {
"show": false,
"margin": 8
},
"logBase": 10,
"seriesLayoutBy": "column",
"lineStyle": {
"normal": {
"width": 4,
"shadowColor": "#696969",
"shadowBlur": 10,
"shadowOffsetY": 10,
"shadowOffsetX": 10
}
},
"areaStyle": {
"opacity": 0
},
"zlevel": 0,
"z": 0,
"rippleEffect": {
"show": true,
"brushType": "stroke",
"scale": 2.5,
"period": 4
}
},
{
"type": "line",
"name": "惠州",
"connectNulls": false,
"xAxisIndex": 0,
"symbolSize": 5,
"showSymbol": true,
"smooth": true,
"clip": true,
"step": false,
"data": [
[
1,
17.290323
],
[
2,
14.035714
],
[
3,
21.677419
],
[
4,
22.750000
],
[
5,
24.774194
],
[
6,
28.050000
],
[
7,
29.306452
],
[
8,
28.177419
]
],
"hoverAnimation": true,
"label": {
"show": false,
"margin": 8
},
"logBase": 10,
"seriesLayoutBy": "column",
"lineStyle": {
"normal": {
"width": 4,
"shadowColor": "#696969",
"shadowBlur": 10,
"shadowOffsetY": 10,
"shadowOffsetX": 10
}
},
"areaStyle": {
"opacity": 0
},
"zlevel": 0,
"z": 0,
"rippleEffect": {
"show": true,
"brushType": "stroke",
"scale": 2.5,
"period": 4
}
},
{
"type": "line",
"name": "深圳",
"connectNulls": false,
"xAxisIndex": 0,
"symbolSize": 5,
"showSymbol": true,
"smooth": true,
"clip": true,
"step": false,
"data": [
[
1,
17.580645
],
[
2,
14.232143
],
[
3,
21.596774
],
[
4,
23.466667
],
[
5,
25.064516
],
[
6,
28.166667
],
[
7,
30.016129
],
[
8,
29.145161
]
],
"hoverAnimation": true,
"label": {
"show": false,
"margin": 8
},
"logBase": 10,
"seriesLayoutBy": "column",
"lineStyle": {
"normal": {
"width": 4,
"shadowColor": "#696969",
"shadowBlur": 10,
"shadowOffsetY": 10,
"shadowOffsetX": 10
}
},
"areaStyle": {
"opacity": 0
},
"zlevel": 0,
"z": 0,
"rippleEffect": {
"show": true,
"brushType": "stroke",
"scale": 2.5,
"period": 4
}
}
],
"xAxis": [
{
"type": "category",
"show": true,
"scale": false,
"nameLocation": "end",
"nameGap": 15,
"gridIndex": 0,
"axisLine": {
"show": true,
"onZero": true,
"onZeroAxisIndex": 0,
"lineStyle": {
"show": true,
"width": 2,
"opacity": 1,
"curveness": 0,
"type": "solid",
"color": "#DB7093"
}
},
"axisLabel": {
"show": true,
"color": "red",
"margin": 8,
"fontSize": 14
},
"inverse": false,
"offset": 0,
"splitNumber": 5,
"boundaryGap": false,
"minInterval": 0,
"splitLine": {
"show": true,
"lineStyle": {
"show": true,
"width": 1,
"opacity": 1,
"curveness": 0,
"type": "solid"
}
},
"data": [
1,
2,
3,
4,
5,
6,
7,
8,
9,
10,
11,
12
]
}
],
"yAxis": [
{
"name": "平均温度",
"show": true,
"scale": true,
"nameLocation": "end",
"nameGap": 15,
"nameTextStyle": {
"color": "#5470c6",
"fontWeight": "bold",
"fontSize": 16
},
"gridIndex": 0,
"axisLine": {
"show": true,
"onZero": true,
"onZeroAxisIndex": 0,
"lineStyle": {
"show": true,
"width": 2,
"opacity": 1,
"curveness": 0,
"type": "solid",
"color": "#5470c6"
}
},
"axisLabel": {
"show": true,
"color": "#5470c6",
"margin": 8,
"fontSize": 13
},
"inverse": false,
"offset": 0,
"splitNumber": 5,
"min": 18,
"max": 39,
"minInterval": 0,
"splitLine": {
"show": true,
"lineStyle": {
"show": true,
"width": 1,
"opacity": 1,
"curveness": 0,
"type": "dashed"
}
}
}
],
"title": [
{
"show": true,
"text": "广州河源惠州深圳2022年每月平均温度发生变化的趋势",
"target": "blank",
"subtarget": "blank",
"left": "center",
"top": "2%",
"padding": 5,
"itemGap": 10,
"textAlign": "auto",
"textVerticalAlign": "auto",
"triggerEvent": false,
"textStyle": {
"color": "#DC143C",
"fontSize": 20
}
}
],
"tooltip": {
"show": true,
"trigger": "axis",
"triggerOn": "mousemove|click",
"axisPointer": {
"type": "cross"
},
"showContent": true,
"alwaysShowContent": false,
"showDelay": 0,
"hideDelay": 100,
"enterable": false,
"confine": false,
"appendToBody": false,
"transitionDuration": 0.4,
"textStyle": {
"color": "#000"
},
"backgroundColor": "rgba(245, 245, 245, 0.8)",
"borderColor": "#ccc",
"borderWidth": 1,
"padding": 5,
"order": "seriesAsc"
},
"color": [
"#5470c6",
"#91cc75",
"#fac858",
"#ee6666",
"#73c0de",
"#3ba272",
"#fc8452",
"#9a60b4",
"#ea7ccc"
]
},
{
"backgroundColor": new echarts.graphic.LinearGradient(0, 0, 0, 1, [{offset: 0, color: '#c86589'}, {offset: 1, color: '#06a7ff'}], false),
"series": [
{
"type": "line",
"name": "广州",
"connectNulls": false,
"xAxisIndex": 0,
"symbolSize": 5,
"showSymbol": true,
"smooth": true,
"clip": true,
"step": false,
"data": [
[
1,
15.709677
],
[
2,
12.232143
],
[
3,
21.177419
],
[
4,
22.533333
],
[
5,
24.370968
],
[
6,
28.000000
],
[
7,
30.354839
],
[
8,
29.000000
],
[
9,
28.866667
]
],
"hoverAnimation": true,
"label": {
"show": false,
"margin": 8
},
"logBase": 10,
"seriesLayoutBy": "column",
"lineStyle": {
"normal": {
"width": 4,
"shadowColor": "#696969",
"shadowBlur": 10,
"shadowOffsetY": 10,
"shadowOffsetX": 10
}
},
"areaStyle": {
"opacity": 0
},
"zlevel": 0,
"z": 0,
"rippleEffect": {
"show": true,
"brushType": "stroke",
"scale": 2.5,
"period": 4
}
},
{
"type": "line",
"name": "河源",
"connectNulls": false,
"xAxisIndex": 0,
"symbolSize": 5,
"showSymbol": true,
"smooth": true,
"clip": true,
"step": false,
"data": [
[
1,
15.080645
],
[
2,
11.607143
],
[
3,
21.096774
],
[
4,
22.300000
],
[
5,
23.887097
],
[
6,
27.550000
],
[
7,
30.419355
],
[
8,
29.677419
],
[
9,
29.216667
]
],
"hoverAnimation": true,
"label": {
"show": false,
"margin": 8
},
"logBase": 10,
"seriesLayoutBy": "column",
"lineStyle": {
"normal": {
"width": 4,
"shadowColor": "#696969",
"shadowBlur": 10,
"shadowOffsetY": 10,
"shadowOffsetX": 10
}
},
"areaStyle": {
"opacity": 0
},
"zlevel": 0,
"z": 0,
"rippleEffect": {
"show": true,
"brushType": "stroke",
"scale": 2.5,
"period": 4
}
},
{
"type": "line",
"name": "惠州",
"connectNulls": false,
"xAxisIndex": 0,
"symbolSize": 5,
"showSymbol": true,
"smooth": true,
"clip": true,
"step": false,
"data": [
[
1,
17.290323
],
[
2,
14.035714
],
[
3,
21.677419
],
[
4,
22.750000
],
[
5,
24.774194
],
[
6,
28.050000
],
[
7,
29.306452
],
[
8,
28.177419
],
[
9,
28.416667
]
],
"hoverAnimation": true,
"label": {
"show": false,
"margin": 8
},
"logBase": 10,
"seriesLayoutBy": "column",
"lineStyle": {
"normal": {
"width": 4,
"shadowColor": "#696969",
"shadowBlur": 10,
"shadowOffsetY": 10,
"shadowOffsetX": 10
}
},
"areaStyle": {
"opacity": 0
},
"zlevel": 0,
"z": 0,
"rippleEffect": {
"show": true,
"brushType": "stroke",
"scale": 2.5,
"period": 4
}
},
{
"type": "line",
"name": "深圳",
"connectNulls": false,
"xAxisIndex": 0,
"symbolSize": 5,
"showSymbol": true,
"smooth": true,
"clip": true,
"step": false,
"data": [
[
1,
17.580645
],
[
2,
14.232143
],
[
3,
21.596774
],
[
4,
23.466667
],
[
5,
25.064516
],
[
6,
28.166667
],
[
7,
30.016129
],
[
8,
29.145161
],
[
9,
29.400000
]
],
"hoverAnimation": true,
"label": {
"show": false,
"margin": 8
},
"logBase": 10,
"seriesLayoutBy": "column",
"lineStyle": {
"normal": {
"width": 4,
"shadowColor": "#696969",
"shadowBlur": 10,
"shadowOffsetY": 10,
"shadowOffsetX": 10
}
},
"areaStyle": {
"opacity": 0
},
"zlevel": 0,
"z": 0,
"rippleEffect": {
"show": true,
"brushType": "stroke",
"scale": 2.5,
"period": 4
}
},
],
"xAxis": [
{
"type": "category",
"show": true,
"scale": false,
"nameLocation": "end",
"nameGap": 15,
"gridIndex": 0,
"axisLine": {
"show": true,
"onZero": true,
"onZeroAxisIndex": 0,
"lineStyle": {
"show": true,
"width": 2,
"opacity": 1,
"curveness": 0,
"type": "solid",
"color": "#DB7093"
}
},
"axisLabel": {
"show": true,
"color": "red",
"margin": 8,
"fontSize": 14
},
"inverse": false,
"offset": 0,
"splitNumber": 5,
"boundaryGap": false,
"minInterval": 0,
"splitLine": {
"show": true,
"lineStyle": {
"show": true,
"width": 1,
"opacity": 1,
"curveness": 0,
"type": "solid"
}
},
"data": [
1,
2,
3,
4,
5,
6,
7,
8,
9,
10,
11,
12
]
}
],
"yAxis": [
{
"name": "平均温度",
"show": true,
"scale": true,
"nameLocation": "end",
"nameGap": 15,
"nameTextStyle": {
"color": "#5470c6",
"fontWeight": "bold",
"fontSize": 16
},
"gridIndex": 0,
"axisLine": {
"show": true,
"onZero": true,
"onZeroAxisIndex": 0,
"lineStyle": {
"show": true,
"width": 2,
"opacity": 1,
"curveness": 0,
"type": "solid",
"color": "#5470c6"
}
},
"axisLabel": {
"show": true,
"color": "#5470c6",
"margin": 8,
"fontSize": 13
},
"inverse": false,
"offset": 0,
"splitNumber": 5,
"min": 17,
"max": 38,
"minInterval": 0,
"splitLine": {
"show": true,
"lineStyle": {
"show": true,
"width": 1,
"opacity": 1,
"curveness": 0,
"type": "dashed"
}
}
}
],
"title": [
{
"show": true,
"text": "广州河源惠州深圳2022年每月平均温度发生变化的趋势",
"target": "blank",
"subtarget": "blank",
"left": "center",
"top": "2%",
"padding": 5,
"itemGap": 10,
"textAlign": "auto",
"textVerticalAlign": "auto",
"triggerEvent": false,
"textStyle": {
"color": "#DC143C",
"fontSize": 20
}
}
],
"tooltip": {
"show": true,
"trigger": "axis",
"triggerOn": "mousemove|click",
"axisPointer": {
"type": "cross"
},
"showContent": true,
"alwaysShowContent": false,
"showDelay": 0,
"hideDelay": 100,
"enterable": false,
"confine": false,
"appendToBody": false,
"transitionDuration": 0.4,
"textStyle": {
"color": "#000"
},
"backgroundColor": "rgba(245, 245, 245, 0.8)",
"borderColor": "#ccc",
"borderWidth": 1,
"padding": 5,
"order": "seriesAsc"
},
"color": [
"#5470c6",
"#91cc75",
"#fac858",
"#ee6666",
"#73c0de",
"#3ba272",
"#fc8452",
"#9a60b4",
"#ea7ccc"
]
},
{
"backgroundColor": new echarts.graphic.LinearGradient(0, 0, 0, 1, [{offset: 0, color: '#c86589'}, {offset: 1, color: '#06a7ff'}], false),
"series": [
{
"type": "line",
"name": "广州",
"connectNulls": false,
"xAxisIndex": 0,
"symbolSize": 5,
"showSymbol": true,
"smooth": true,
"clip": true,
"step": false,
"data": [
[
1,
15.709677
],
[
2,
12.232143
],
[
3,
21.177419
],
[
4,
22.533333
],
[
5,
24.370968
],
[
6,
28.000000
],
[
7,
30.354839
],
[
8,
29.000000
],
[
9,
28.866667
],
[
10,
24.903226
]
],
"hoverAnimation": true,
"label": {
"show": false,
"margin": 8
},
"logBase": 10,
"seriesLayoutBy": "column",
"lineStyle": {
"normal": {
"width": 4,
"shadowColor": "#696969",
"shadowBlur": 10,
"shadowOffsetY": 10,
"shadowOffsetX": 10
}
},
"areaStyle": {
"opacity": 0
},
"zlevel": 0,
"z": 0,
"rippleEffect": {
"show": true,
"brushType": "stroke",
"scale": 2.5,
"period": 4
}
},
{
"type": "line",
"name": "河源",
"connectNulls": false,
"xAxisIndex": 0,
"symbolSize": 5,
"showSymbol": true,
"smooth": true,
"clip": true,
"step": false,
"data": [
[
1,
15.080645
],
[
2,
11.607143
],
[
3,
21.096774
],
[
4,
22.300000
],
[
5,
23.887097
],
[
6,
27.550000
],
[
7,
30.419355
],
[
8,
29.677419
],
[
9,
29.216667
],
[
10,
24.983871
]
],
"hoverAnimation": true,
"label": {
"show": false,
"margin": 8
},
"logBase": 10,
"seriesLayoutBy": "column",
"lineStyle": {
"normal": {
"width": 4,
"shadowColor": "#696969",
"shadowBlur": 10,
"shadowOffsetY": 10,
"shadowOffsetX": 10
}
},
"areaStyle": {
"opacity": 0
},
"zlevel": 0,
"z": 0,
"rippleEffect": {
"show": true,
"brushType": "stroke",
"scale": 2.5,
"period": 4
}
},
{
"type": "line",
"name": "惠州",
"connectNulls": false,
"xAxisIndex": 0,
"symbolSize": 5,
"showSymbol": true,
"smooth": true,
"clip": true,
"step": false,
"data": [
[
1,
17.290323
],
[
2,
14.035714
],
[
3,
21.677419
],
[
4,
22.750000
],
[
5,
24.774194
],
[
6,
28.050000
],
[
7,
29.306452
],
[
8,
28.177419
],
[
9,
28.416667
],
[
10,
24.870968
]
],
"hoverAnimation": true,
"label": {
"show": false,
"margin": 8
},
"logBase": 10,
"seriesLayoutBy": "column",
"lineStyle": {
"normal": {
"width": 4,
"shadowColor": "#696969",
"shadowBlur": 10,
"shadowOffsetY": 10,
"shadowOffsetX": 10
}
},
"areaStyle": {
"opacity": 0
},
"zlevel": 0,
"z": 0,
"rippleEffect": {
"show": true,
"brushType": "stroke",
"scale": 2.5,
"period": 4
}
},
{
"type": "line",
"name": "深圳",
"connectNulls": false,
"xAxisIndex": 0,
"symbolSize": 5,
"showSymbol": true,
"smooth": true,
"clip": true,
"step": false,
"data": [
[
1,
17.580645
],
[
2,
14.232143
],
[
3,
21.596774
],
[
4,
23.466667
],
[
5,
25.064516
],
[
6,
28.166667
],
[
7,
30.016129
],
[
8,
29.145161
],
[
9,
289.400000
],
[
10,
25.725806
]
],
"hoverAnimation": true,
"label": {
"show": false,
"margin": 8
},
"logBase": 10,
"seriesLayoutBy": "column",
"lineStyle": {
"normal": {
"width": 4,
"shadowColor": "#696969",
"shadowBlur": 10,
"shadowOffsetY": 10,
"shadowOffsetX": 10
}
},
"areaStyle": {
"opacity": 0
},
"zlevel": 0,
"z": 0,
"rippleEffect": {
"show": true,
"brushType": "stroke",
"scale": 2.5,
"period": 4
}
},
],
"xAxis": [
{
"type": "category",
"show": true,
"scale": false,
"nameLocation": "end",
"nameGap": 15,
"gridIndex": 0,
"axisLine": {
"show": true,
"onZero": true,
"onZeroAxisIndex": 0,
"lineStyle": {
"show": true,
"width": 2,
"opacity": 1,
"curveness": 0,
"type": "solid",
"color": "#DB7093"
}
},
"axisLabel": {
"show": true,
"color": "red",
"margin": 8,
"fontSize": 14
},
"inverse": false,
"offset": 0,
"splitNumber": 5,
"boundaryGap": false,
"minInterval": 0,
"splitLine": {
"show": true,
"lineStyle": {
"show": true,
"width": 1,
"opacity": 1,
"curveness": 0,
"type": "solid"
}
},
"data": [
1,
2,
3,
4,
5,
6,
7,
8,
9,
10,
11,
12
]
}
],
"yAxis": [
{
"name": "平均温度",
"show": true,
"scale": true,
"nameLocation": "end",
"nameGap": 15,
"nameTextStyle": {
"color": "#5470c6",
"fontWeight": "bold",
"fontSize": 16
},
"gridIndex": 0,
"axisLine": {
"show": true,
"onZero": true,
"onZeroAxisIndex": 0,
"lineStyle": {
"show": true,
"width": 2,
"opacity": 1,
"curveness": 0,
"type": "solid",
"color": "#5470c6"
}
},
"axisLabel": {
"show": true,
"color": "#5470c6",
"margin": 8,
"fontSize": 13
},
"inverse": false,
"offset": 0,
"splitNumber": 5,
"min": 14,
"max": 34,
"minInterval": 0,
"splitLine": {
"show": true,
"lineStyle": {
"show": true,
"width": 1,
"opacity": 1,
"curveness": 0,
"type": "dashed"
}
}
}
],
"title": [
{
"show": true,
"text": "广州河源惠州深圳2022年每月平均温度发生变化的趋势",
"target": "blank",
"subtarget": "blank",
"left": "center",
"top": "2%",
"padding": 5,
"itemGap": 10,
"textAlign": "auto",
"textVerticalAlign": "auto",
"triggerEvent": false,
"textStyle": {
"color": "#DC143C",
"fontSize": 20
}
}
],
"tooltip": {
"show": true,
"trigger": "axis",
"triggerOn": "mousemove|click",
"axisPointer": {
"type": "cross"
},
"showContent": true,
"alwaysShowContent": false,
"showDelay": 0,
"hideDelay": 100,
"enterable": false,
"confine": false,
"appendToBody": false,
"transitionDuration": 0.4,
"textStyle": {
"color": "#000"
},
"backgroundColor": "rgba(245, 245, 245, 0.8)",
"borderColor": "#ccc",
"borderWidth": 1,
"padding": 5,
"order": "seriesAsc"
},
"color": [
"#5470c6",
"#91cc75",
"#fac858",
"#ee6666",
"#73c0de",
"#3ba272",
"#fc8452",
"#9a60b4",
"#ea7ccc"
]
},
{
"backgroundColor": new echarts.graphic.LinearGradient(0, 0, 0, 1, [{offset: 0, color: '#c86589'}, {offset: 1, color: '#06a7ff'}], false),
"series": [
{
"type": "line",
"name": "广州",
"connectNulls": false,
"xAxisIndex": 0,
"symbolSize": 5,
"showSymbol": true,
"smooth": true,
"clip": true,
"step": false,
"data": [
[
1,
15.709677
],
[
2,
12.232143
],
[
3,
21.177419
],
[
4,
22.533333
],
[
5,
24.370968
],
[
6,
28.000000
],
[
7,
30.354839
],
[
8,
29.000000
],
[
9,
28.866667
],
[
10,
24.903226
],
[
11,
21.783333
]
],
"hoverAnimation": true,
"label": {
"show": false,
"margin": 8
},
"logBase": 10,
"seriesLayoutBy": "column",
"lineStyle": {
"normal": {
"width": 4,
"shadowColor": "#696969",
"shadowBlur": 10,
"shadowOffsetY": 10,
"shadowOffsetX": 10
}
},
"areaStyle": {
"opacity": 0
},
"zlevel": 0,
"z": 0,
"rippleEffect": {
"show": true,
"brushType": "stroke",
"scale": 2.5,
"period": 4
}
},
{
"type": "line",
"name": "河源",
"connectNulls": false,
"xAxisIndex": 0,
"symbolSize": 5,
"showSymbol": true,
"smooth": true,
"clip": true,
"step": false,
"data": [
[
1,
15.080645
],
[
2,
11.607143
],
[
3,
21.096774
],
[
4,
22.300000
],
[
5,
23.887097
],
[
6,
27.550000
],
[
7,
30.419355
],
[
8,
29.677419
],
[
9,
29.216667
],
[
10,
24.983871
],
[
11,
21.933333
]
],
"hoverAnimation": true,
"label": {
"show": false,
"margin": 8
},
"logBase": 10,
"seriesLayoutBy": "column",
"lineStyle": {
"normal": {
"width": 4,
"shadowColor": "#696969",
"shadowBlur": 10,
"shadowOffsetY": 10,
"shadowOffsetX": 10
}
},
"areaStyle": {
"opacity": 0
},
"zlevel": 0,
"z": 0,
"rippleEffect": {
"show": true,
"brushType": "stroke",
"scale": 2.5,
"period": 4
}
},
{
"type": "line",
"name": "惠州",
"connectNulls": false,
"xAxisIndex": 0,
"symbolSize": 5,
"showSymbol": true,
"smooth": true,
"clip": true,
"step": false,
"data": [
[
1,
17.290323
],
[
2,
14.035714
],
[
3,
21.677419
],
[
4,
22.750000
],
[
5,
24.774194
],
[
6,
28.050000
],
[
7,
29.306452
],
[
8,
28.177419
],
[
9,
28.416667
],
[
10,
24.870968
],
[
11,
22.783333
]
],
"hoverAnimation": true,
"label": {
"show": false,
"margin": 8
},
"logBase": 10,
"seriesLayoutBy": "column",
"lineStyle": {
"normal": {
"width": 4,
"shadowColor": "#696969",
"shadowBlur": 10,
"shadowOffsetY": 10,
"shadowOffsetX": 10
}
},
"areaStyle": {
"opacity": 0
},
"zlevel": 0,
"z": 0,
"rippleEffect": {
"show": true,
"brushType": "stroke",
"scale": 2.5,
"period": 4
}
},
{
"type": "line",
"name": "深圳",
"connectNulls": false,
"xAxisIndex": 0,
"symbolSize": 5,
"showSymbol": true,
"smooth": true,
"clip": true,
"step": false,
"data": [
[
1,
17.580645
],
[
2,
14.232143
],
[
3,
21.596774
],
[
4,
23.466667
],
[
5,
25.064516
],
[
6,
28.166667
],
[
7,
30.016129
],
[
8,
29.145161
],
[
9,
29.400000
],
[
10,
25.725806
],
[
11,
22.966667
]
],
"hoverAnimation": true,
"label": {
"show": false,
"margin": 8
},
"logBase": 10,
"seriesLayoutBy": "column",
"lineStyle": {
"normal": {
"width": 4,
"shadowColor": "#696969",
"shadowBlur": 10,
"shadowOffsetY": 10,
"shadowOffsetX": 10
}
},
"areaStyle": {
"opacity": 0
},
"zlevel": 0,
"z": 0,
"rippleEffect": {
"show": true,
"brushType": "stroke",
"scale": 2.5,
"period": 4
}
}
],
"xAxis": [
{
"type": "category",
"show": true,
"scale": false,
"nameLocation": "end",
"nameGap": 15,
"gridIndex": 0,
"axisLine": {
"show": true,
"onZero": true,
"onZeroAxisIndex": 0,
"lineStyle": {
"show": true,
"width": 2,
"opacity": 1,
"curveness": 0,
"type": "solid",
"color": "#DB7093"
}
},
"axisLabel": {
"show": true,
"color": "red",
"margin": 8,
"fontSize": 14
},
"inverse": false,
"offset": 0,
"splitNumber": 5,
"boundaryGap": false,
"minInterval": 0,
"splitLine": {
"show": true,
"lineStyle": {
"show": true,
"width": 1,
"opacity": 1,
"curveness": 0,
"type": "solid"
}
},
"data": [
1,
2,
3,
4,
5,
6,
7,
8,
9,
10,
11,
12
]
}
],
"yAxis": [
{
"name": "平均温度",
"show": true,
"scale": true,
"nameLocation": "end",
"nameGap": 15,
"nameTextStyle": {
"color": "#5470c6",
"fontWeight": "bold",
"fontSize": 16
},
"gridIndex": 0,
"axisLine": {
"show": true,
"onZero": true,
"onZeroAxisIndex": 0,
"lineStyle": {
"show": true,
"width": 2,
"opacity": 1,
"curveness": 0,
"type": "solid",
"color": "#5470c6"
}
},
"axisLabel": {
"show": true,
"color": "#5470c6",
"margin": 8,
"fontSize": 13
},
"inverse": false,
"offset": 0,
"splitNumber": 5,
"min": 11,
"max": 33,
"minInterval": 0,
"splitLine": {
"show": true,
"lineStyle": {
"show": true,
"width": 1,
"opacity": 1,
"curveness": 0,
"type": "dashed"
}
}
}
],
"title": [
{
"show": true,
"text": "广州河源惠州深圳2022年每月平均温度发生变化的趋势",
"target": "blank",
"subtarget": "blank",
"left": "center",
"top": "2%",
"padding": 5,
"itemGap": 10,
"textAlign": "auto",
"textVerticalAlign": "auto",
"triggerEvent": false,
"textStyle": {
"color": "#DC143C",
"fontSize": 20
}
}
],
"tooltip": {
"show": true,
"trigger": "axis",
"triggerOn": "mousemove|click",
"axisPointer": {
"type": "cross"
},
"showContent": true,
"alwaysShowContent": false,
"showDelay": 0,
"hideDelay": 100,
"enterable": false,
"confine": false,
"appendToBody": false,
"transitionDuration": 0.4,
"textStyle": {
"color": "#000"
},
"backgroundColor": "rgba(245, 245, 245, 0.8)",
"borderColor": "#ccc",
"borderWidth": 1,
"padding": 5,
"order": "seriesAsc"
},
"color": [
"#5470c6",
"#91cc75",
"#fac858",
"#ee6666",
"#73c0de",
"#3ba272",
"#fc8452",
"#9a60b4",
"#ea7ccc"
]
},
{
"backgroundColor": new echarts.graphic.LinearGradient(0, 0, 0, 1, [{offset: 0, color: '#c86589'}, {offset: 1, color: '#06a7ff'}], false),
"series": [
{
"type": "line",
"name": "广州",
"connectNulls": false,
"xAxisIndex": 0,
"symbolSize": 5,
"showSymbol": true,
"smooth": true,
"clip": true,
"step": false,
"data": [
[
1,
15.709677
],
[
2,
12.232143
],
[
3,
21.177419
],
[
4,
22.533333
],
[
5,
24.370968
],
[
6,
28.000000
],
[
7,
30.354839
],
[
8,
29.000000
],
[
9,
28.866667
],
[
10,
24.903226
],
[
11,
21.783333
],
[
12,
13.403226
]
],
"hoverAnimation": true,
"label": {
"show": false,
"margin": 8
},
"logBase": 10,
"seriesLayoutBy": "column",
"lineStyle": {
"normal": {
"width": 4,
"shadowColor": "#696969",
"shadowBlur": 10,
"shadowOffsetY": 10,
"shadowOffsetX": 10
}
},
"areaStyle": {
"opacity": 0
},
"zlevel": 0,
"z": 0,
"rippleEffect": {
"show": true,
"brushType": "stroke",
"scale": 2.5,
"period": 4
}
},
{
"type": "line",
"name": "河源",
"connectNulls": false,
"xAxisIndex": 0,
"symbolSize": 5,
"showSymbol": true,
"smooth": true,
"clip": true,
"step": false,
"data": [
[
1,
15.080645
],
[
2,
11.607143
],
[
3,
21.096774
],
[
4,
22.300000
],
[
5,
23.887097
],
[
6,
27.550000
],
[
7,
30.419355
],
[
8,
29.677419
],
[
9,
29.216667
],
[
10,
24.983871
],
[
11,
21.933333
],
[
12,
12.096774
]
],
"hoverAnimation": true,
"label": {
"show": false,
"margin": 8
},
"logBase": 10,
"seriesLayoutBy": "column",
"lineStyle": {
"normal": {
"width": 4,
"shadowColor": "#696969",
"shadowBlur": 10,
"shadowOffsetY": 10,
"shadowOffsetX": 10
}
},
"areaStyle": {
"opacity": 0
},
"zlevel": 0,
"z": 0,
"rippleEffect": {
"show": true,
"brushType": "stroke",
"scale": 2.5,
"period": 4
}
},
{
"type": "line",
"name": "惠州",
"connectNulls": false,
"xAxisIndex": 0,
"symbolSize": 5,
"showSymbol": true,
"smooth": true,
"clip": true,
"step": false,
"data": [
[
1,
17.290323
],
[
2,
14.035714
],
[
3,
21.677419
],
[
4,
22.750000
],
[
5,
24.774194
],
[
6,
28.050000
],
[
7,
29.306452
],
[
8,
28.177419
],
[
9,
28.416667
],
[
10,
24.870968
],
[
11,
22.783333
],
[
12,
14.967742
]
],
"hoverAnimation": true,
"label": {
"show": false,
"margin": 8
},
"logBase": 10,
"seriesLayoutBy": "column",
"lineStyle": {
"normal": {
"width": 4,
"shadowColor": "#696969",
"shadowBlur": 10,
"shadowOffsetY": 10,
"shadowOffsetX": 10
}
},
"areaStyle": {
"opacity": 0
},
"zlevel": 0,
"z": 0,
"rippleEffect": {
"show": true,
"brushType": "stroke",
"scale": 2.5,
"period": 4
}
},
{
"type": "line",
"name": "深圳",
"connectNulls": false,
"xAxisIndex": 0,
"symbolSize": 5,
"showSymbol": true,
"smooth": true,
"clip": true,
"step": false,
"data": [
[
1,
17.580645
],
[
2,
14.232143
],
[
3,
21.596774
],
[
4,
23.466667
],
[
5,
25.064516
],
[
6,
28.166667
],
[
7,
30.016129
],
[
8,
29.145161
],
[
9,
29.400000
],
[
10,
25.725806
],
[
11,
22.966667
],
[
12,
14.870968
]
],
"hoverAnimation": true,
"label": {
"show": false,
"margin": 8
},
"logBase": 10,
"seriesLayoutBy": "column",
"lineStyle": {
"normal": {
"width": 4,
"shadowColor": "#696969",
"shadowBlur": 10,
"shadowOffsetY": 10,
"shadowOffsetX": 10
}
},
"areaStyle": {
"opacity": 0
},
"zlevel": 0,
"z": 0,
"rippleEffect": {
"show": true,
"brushType": "stroke",
"scale": 2.5,
"period": 4
}
},
],
"xAxis": [
{
"type": "category",
"show": true,
"scale": false,
"nameLocation": "end",
"nameGap": 15,
"gridIndex": 0,
"axisLine": {
"show": true,
"onZero": true,
"onZeroAxisIndex": 0,
"lineStyle": {
"show": true,
"width": 2,
"opacity": 1,
"curveness": 0,
"type": "solid",
"color": "#DB7093"
}
},
"axisLabel": {
"show": true,
"color": "red",
"margin": 8,
"fontSize": 14
},
"inverse": false,
"offset": 0,
"splitNumber": 5,
"boundaryGap": false,
"minInterval": 0,
"splitLine": {
"show": true,
"lineStyle": {
"show": true,
"width": 1,
"opacity": 1,
"curveness": 0,
"type": "solid"
}
},
"data": [
1,
2,
3,
4,
5,
6,
7,
8,
9,
10,
11,
12
]
}
],
"yAxis": [
{
"name": "平均温度",
"show": true,
"scale": true,
"nameLocation": "end",
"nameGap": 15,
"nameTextStyle": {
"color": "#5470c6",
"fontWeight": "bold",
"fontSize": 16
},
"gridIndex": 0,
"axisLine": {
"show": true,
"onZero": true,
"onZeroAxisIndex": 0,
"lineStyle": {
"show": true,
"width": 2,
"opacity": 1,
"curveness": 0,
"type": "solid",
"color": "#5470c6"
}
},
"axisLabel": {
"show": true,
"color": "#5470c6",
"margin": 8,
"fontSize": 13
},
"inverse": false,
"offset": 0,
"splitNumber": 5,
"min": 3,
"max": 25,
"minInterval": 0,
"splitLine": {
"show": true,
"lineStyle": {
"show": true,
"width": 1,
"opacity": 1,
"curveness": 0,
"type": "dashed"
}
}
}
],
"title": [
{
"show": true,
"text": "广州河源惠州深圳2022年每月平均温度发生变化的趋势",
"target": "blank",
"subtarget": "blank",
"left": "center",
"top": "2%",
"padding": 5,
"itemGap": 10,
"textAlign": "auto",
"textVerticalAlign": "auto",
"triggerEvent": false,
"textStyle": {
"color": "#DC143C",
"fontSize": 20
}
}
],
"tooltip": {
"show": true,
"trigger": "axis",
"triggerOn": "mousemove|click",
"axisPointer": {
"type": "cross"
},
"showContent": true,
"alwaysShowContent": false,
"showDelay": 0,
"hideDelay": 100,
"enterable": false,
"confine": false,
"appendToBody": false,
"transitionDuration": 0.4,
"textStyle": {
"color": "#000"
},
"backgroundColor": "rgba(245, 245, 245, 0.8)",
"borderColor": "#ccc",
"borderWidth": 1,
"padding": 5,
"order": "seriesAsc"
},
"color": [
"#5470c6",
"#91cc75",
"#fac858",
"#ee6666",
"#73c0de",
"#3ba272",
"#fc8452",
"#9a60b4",
"#ea7ccc"
]
}
]
};
chart_05381e07884b4ca4a31f555d2e24d39e.setOption(option_05381e07884b4ca4a31f555d2e24d39e);
</script>
<br/> <div id="8a7398d8a2e046d998a8c6eabebb483a" class="chart-container" style="width:900px; height:500px; "></div>
<script>
var chart_8a7398d8a2e046d998a8c6eabebb483a = echarts.init(
document.getElementById('8a7398d8a2e046d998a8c6eabebb483a'), 'white', {renderer: 'canvas'});
var option_8a7398d8a2e046d998a8c6eabebb483a = {
"animation": true,
"animationThreshold": 2000,
"animationDuration": 1000,
"animationEasing": "cubicOut",
"animationDelay": 0,
"animationDurationUpdate": 300,
"animationEasingUpdate": "cubicOut",
"animationDelayUpdate": 0,
"aria": {
"enabled": false
},
"color": [
"#5470c6",
"#91cc75",
"#fac858",
"#ee6666",
"#73c0de",
"#3ba272",
"#fc8452",
"#9a60b4",
"#ea7ccc"
],
"series": [
{
"type": "bar",
"name": "平均温度",
"legendHoverLink": true,
"data": [
120,
110,
134,
120
],
"realtimeSort": false,
"showBackground": false,
"stackStrategy": "samesign",
"cursor": "pointer",
"barMinHeight": 0,
"barCategoryGap": "20%",
"barGap": "30%",
"large": false,
"largeThreshold": 400,
"seriesLayoutBy": "column",
"datasetIndex": 0,
"clip": true,
"zlevel": 0,
"z": 2,
"label": {
"show": true,
"position": "top",
"margin": 8
},
"rippleEffect": {
"show": true,
"brushType": "stroke",
"scale": 2.5,
"period": 4
}
}
],
"legend": [
{
"data": [
"天数"
],
"selected": {},
"show": true,
"padding": 5,
"itemGap": 10,
"itemWidth": 25,
"itemHeight": 14,
"backgroundColor": "transparent",
"borderColor": "#ccc",
"borderWidth": 1,
"borderRadius": 0,
"pageButtonItemGap": 5,
"pageButtonPosition": "end",
"pageFormatter": "{current}/{total}",
"pageIconColor": "#2f4554",
"pageIconInactiveColor": "#aaa",
"pageIconSize": 15,
"animationDurationUpdate": 800,
"selector": false,
"selectorPosition": "auto",
"selectorItemGap": 7,
"selectorButtonGap": 10
}
],
"tooltip": {
"show": true,
"trigger": "item",
"triggerOn": "mousemove|click",
"axisPointer": {
"type": "line"
},
"showContent": true,
"alwaysShowContent": false,
"showDelay": 0,
"hideDelay": 100,
"enterable": false,
"confine": false,
"appendToBody": false,
"transitionDuration": 0.4,
"textStyle": {
"fontSize": 14
},
"borderWidth": 0,
"padding": 5,
"order": "seriesAsc"
},
"xAxis": [
{
"show": true,
"scale": false,
"nameLocation": "end",
"nameGap": 15,
"gridIndex": 0,
"inverse": false,
"offset": 0,
"splitNumber": 5,
"minInterval": 0,
"splitLine": {
"show": true,
"lineStyle": {
"show": true,
"width": 1,
"opacity": 1,
"curveness": 0,
"type": "solid"
}
},
"data": [
"广州",
"河源",
"惠州",
"深圳"
]
}
],
"yAxis": [
{
"show": true,
"scale": false,
"nameLocation": "end",
"nameGap": 15,
"gridIndex": 0,
"inverse": false,
"offset": 0,
"splitNumber": 5,
"minInterval": 0,
"splitLine": {
"show": true,
"lineStyle": {
"show": true,
"width": 1,
"opacity": 1,
"curveness": 0,
"type": "solid"
}
}
}
],
"title": [
{
"show": true,
"text": "广州河源惠州深圳2022年平均气温为18-25℃的天数",
"target": "blank",
"subtarget": "blank",
"padding": 5,
"itemGap": 10,
"textAlign": "auto",
"textVerticalAlign": "auto",
"triggerEvent": false
}
]
};
chart_8a7398d8a2e046d998a8c6eabebb483a.setOption(option_8a7398d8a2e046d998a8c6eabebb483a);
</script>
<br/> </div>
<script>
$('#c48b9e2d9b7440e1b2f458d54f3b383c').resizable().draggable().css('border-style', 'dashed').css('border-width', '1px');$("#c48b9e2d9b7440e1b2f458d54f3b383c>div:nth-child(1)").width("100%").height("100%");
new ResizeSensor(jQuery('#c48b9e2d9b7440e1b2f458d54f3b383c'), function() { chart_c48b9e2d9b7440e1b2f458d54f3b383c.resize()});
$('#88ddd5d9c5594bf597661b16ae91e0e4').resizable().draggable().css('border-style', 'dashed').css('border-width', '1px');$("#88ddd5d9c5594bf597661b16ae91e0e4>div:nth-child(1)").width("100%").height("100%");
new ResizeSensor(jQuery('#88ddd5d9c5594bf597661b16ae91e0e4'), function() { chart_88ddd5d9c5594bf597661b16ae91e0e4.resize()});
$('#8d11665b4f43436cbb0b2ed6ae6b27f9').resizable().draggable().css('border-style', 'dashed').css('border-width', '1px');$("#8d11665b4f43436cbb0b2ed6ae6b27f9>div:nth-child(1)").width("100%").height("100%");
new ResizeSensor(jQuery('#8d11665b4f43436cbb0b2ed6ae6b27f9'), function() { chart_8d11665b4f43436cbb0b2ed6ae6b27f9.resize()});
$('#05381e07884b4ca4a31f555d2e24d39e').resizable().draggable().css('border-style', 'dashed').css('border-width', '1px');$("#05381e07884b4ca4a31f555d2e24d39e>div:nth-child(1)").width("100%").height("100%");
new ResizeSensor(jQuery('#05381e07884b4ca4a31f555d2e24d39e'), function() { chart_05381e07884b4ca4a31f555d2e24d39e.resize()});
$('#8a7398d8a2e046d998a8c6eabebb483a').resizable().draggable().css('border-style', 'dashed').css('border-width', '1px');$("#8a7398d8a2e046d998a8c6eabebb483a>div:nth-child(1)").width("100%").height("100%");
new ResizeSensor(jQuery('#8a7398d8a2e046d998a8c6eabebb483a'), function() { chart_8a7398d8a2e046d998a8c6eabebb483a.resize()});
var charts_id = ['c48b9e2d9b7440e1b2f458d54f3b383c','88ddd5d9c5594bf597661b16ae91e0e4','8d11665b4f43436cbb0b2ed6ae6b27f9','05381e07884b4ca4a31f555d2e24d39e','8a7398d8a2e046d998a8c6eabebb483a'];
function downloadCfg () {
const fileName = 'chart_config.json'
let downLink = document.createElement('a')
downLink.download = fileName
let result = []
for(let i=0; i<charts_id.length; i++) {
chart = $('#'+charts_id[i])
result.push({
cid: charts_id[i],
width: chart.css("width"),
height: chart.css("height"),
top: chart.offset().top + "px",
left: chart.offset().left + "px"
})
}
let blob = new Blob([JSON.stringify(result)])
downLink.href = URL.createObjectURL(blob)
document.body.appendChild(downLink)
downLink.click()
document.body.removeChild(downLink)
}
</script>
</body>
</html>

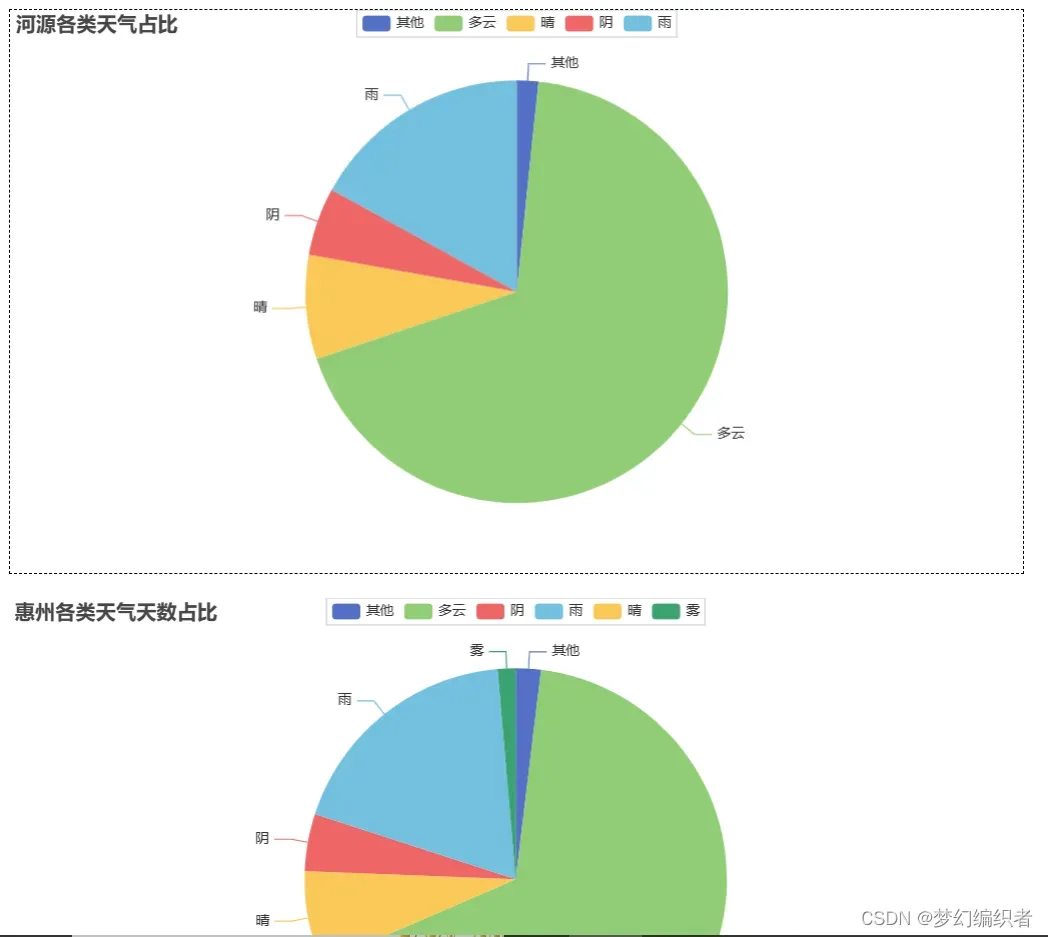
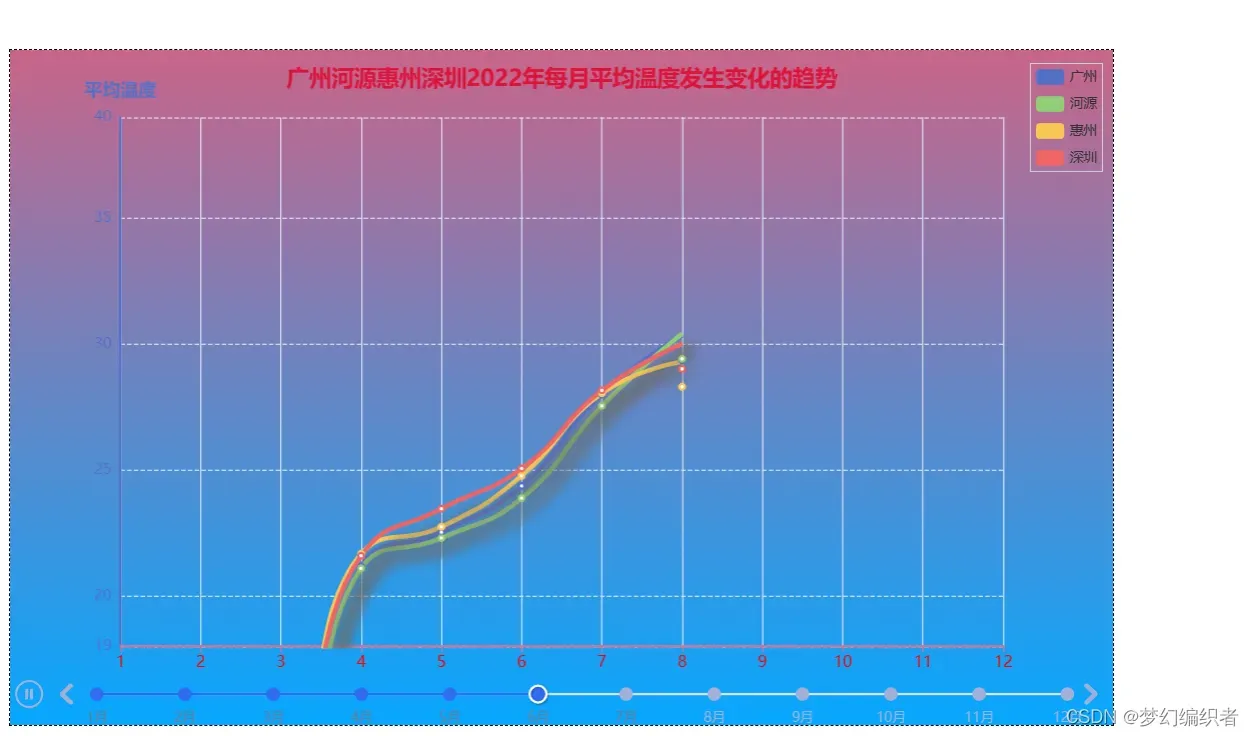
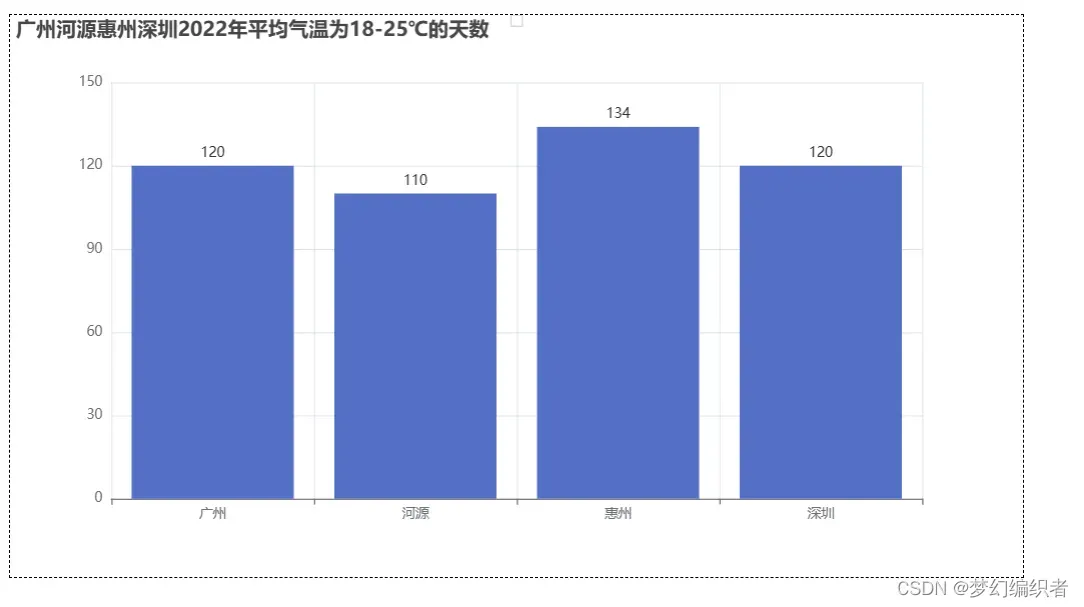
博主写代码来之不易
关注博主下篇更精彩
一键三连!!!
一键三连!!!
感谢一键三连!

文章出处登录后可见!
已经登录?立即刷新