昨晚太晚代码还没有跑完,恰巧又遇到PSO-LSTM的准确率没办法复原,惨兮兮/(ㄒoㄒ)/,具体内容今天来补上
文本情感分析
一、情感分析简介
对人们对产品、服务、组织、个人、问题、事件、话题及其属性的观点、情 感、情绪、评价和态度的计算研究。文本情感分析(Sentiment Analysis)是自然语言处理(NLP)方法中常见的应用,也是一个有趣的基本任务,尤其是以提炼文本情绪内容为目的的分类。它是对带有情感色彩的主观性文本进行分析、处理、归纳和推理的过程。
本文将介绍情感分析中的情感极性(倾向)分析。所谓情感极性分析,指的是对文本进行褒义、贬义、中性的判断。在大多应用场景下,只分为两类。例如对于“喜爱”和“厌恶”这两个词,就属于不同的情感倾向。
本文将详细介绍如何进行文本数据预处理,并使用深度学习模型中的LSTM模型来实现文本的情感分析。
二、文本介绍及语料分析
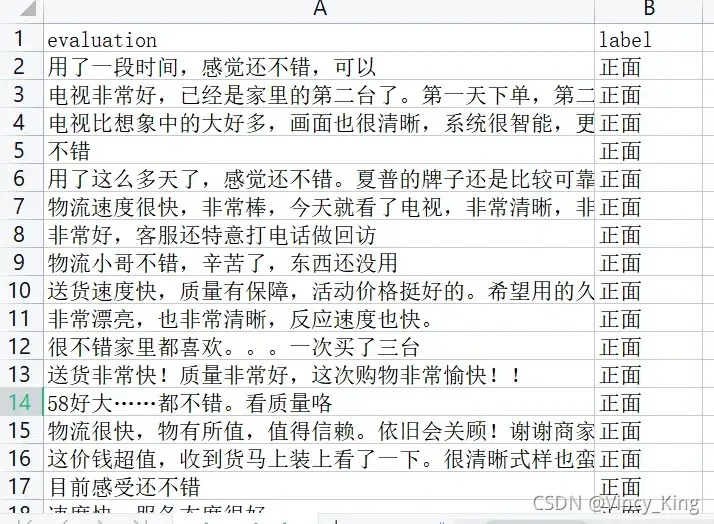
本项目以某电商网站中某个商品的评论作为语料(corpus.csv),点击下载数据集,该数据集一共有4310条评论数据,文本的情感分为两类:“正面”和“反面”,该数据集的前几行如下:
三、数据集分析
- 数据集中的情感分布
- 数据集中的评论句子长度分布
以下代码为统计数据集中的情感分布以及评论句子长度分布
import pandas as pd
import matplotlib.pyplot as plt
from matplotlib import font_manager
from itertools import accumulate
# 设置matplotlib绘图时的字体
my_font=font_manager.FontProperties(fname="C:\Windows\Fonts\simhei.ttf")
# 统计句子长度及长度出现的频数
df=pd.read_csv('data/data_single.csv')
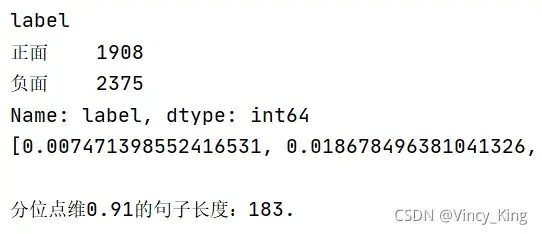
print(df.groupby('label')['label'].count())
df['length']=df['evaluation'].apply(lambda x:len(x))
len_df=df.groupby('length').count()
sent_length=len_df.index.tolist()
sent_freq=len_df['evaluation'].tolist()
# 绘制句子长度及出现频数统计图
plt.bar(sent_length,sent_freq)
plt.title('句子长度及出现频数统计图',fontproperties=my_font)
plt.xlabel('句子长度',fontproperties=my_font)
plt.ylabel('句子长度出现的频数',fontproperties=my_font)
plt.show()
plt.close()
# 绘制句子长度累积分布函数(CDF)
sent_pentage_list=[(count/sum(sent_freq)) for count in accumulate(sent_freq)]
# 绘制CDF
plt.plot(sent_length,sent_pentage_list)
# 寻找分位点为quantile的句子长度
quantile=0.91
print(list(sent_pentage_list))
for length,per in zip(sent_length,sent_pentage_list):
if round(per,2)==quantile:
index=length
break
print('\n分位点维%s的句子长度:%d.'%(quantile,index))
plt.show()
plt.close()
# 绘制句子长度累积分布函数图
plt.plot(sent_length,sent_pentage_list)
plt.hlines(quantile,0,index,colors='c',linestyles='dashed')
plt.vlines(index,0,quantile,colors='c',linestyles='dashed')
plt.text(0,quantile,str(quantile))
plt.text(index,0,str(index))
plt.title('句子长度累计分布函数图',fontproperties=my_font)
plt.xlabel('句子长度',fontproperties=my_font)
plt.ylabel('句子长度累积频率',fontproperties=my_font)
plt.show()
plt.close()
输出结果如下:
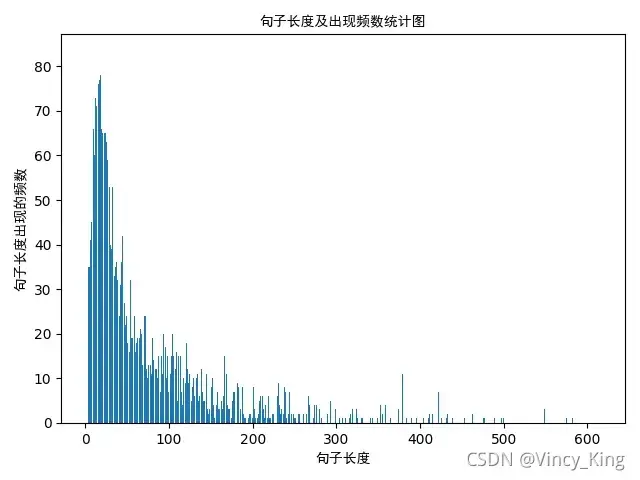
句子长度及出现频数统计图如下:
句子长度累积分布函数图如下:
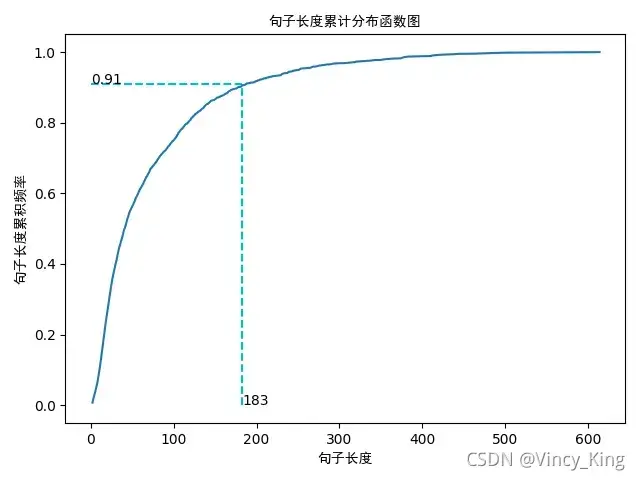
从以上的图片可以看出,大多数样本的句子长度集中在1-200之间,句子长度累计频率取0.91分位点,则长度为183左右。
四、LSTM模型
实现的模型框架如下:
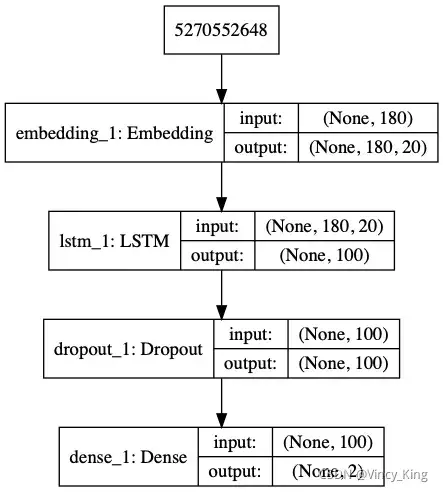
代码如下:
import pickle
import numpy as np
import pandas as pd
from keras.utils import np_utils
from keras.utils.vis_utils import plot_model
from keras.models import Sequential
from keras.preprocessing.sequence import pad_sequences
from keras.layers import LSTM, Dense, Embedding,Dropout
from sklearn.model_selection import train_test_split
from sklearn.metrics import accuracy_score
# load dataset
# ['evaluation'] is feature, ['label'] is label
def load_data(filepath,input_shape=20):
df=pd.read_csv(filepath)
# 标签及词汇表
labels,vocabulary=list(df['label'].unique()),list(df['evaluation'].unique())
# 构造字符级别的特征
string=''
for word in vocabulary:
string+=word
vocabulary=set(string)
# 字典列表
word_dictionary={word:i+1 for i,word in enumerate(vocabulary)}
with open('word_dict.pk','wb') as f:
pickle.dump(word_dictionary,f)
inverse_word_dictionary={i+1:word for i,word in enumerate(vocabulary)}
label_dictionary={label:i for i,label in enumerate(labels)}
with open('label_dict.pk','wb') as f:
pickle.dump(label_dictionary,f)
output_dictionary={i:labels for i,labels in enumerate(labels)}
# 词汇表大小
vocab_size=len(word_dictionary.keys())
# 标签类别数量
label_size=len(label_dictionary.keys())
# 序列填充,按input_shape填充,长度不足的按0补充
x=[[word_dictionary[word] for word in sent] for sent in df['evaluation']]
x=pad_sequences(maxlen=input_shape,sequences=x,padding='post',value=0)
y=[[label_dictionary[sent]] for sent in df['label']]
'''
np_utils.to_categorical用于将标签转化为形如(nb_samples, nb_classes)
的二值序列。
假设num_classes = 10。
如将[1, 2, 3,……4]转化成:
[[0, 1, 0, 0, 0, 0, 0, 0]
[0, 0, 1, 0, 0, 0, 0, 0]
[0, 0, 0, 1, 0, 0, 0, 0]
……
[0, 0, 0, 0, 1, 0, 0, 0]]
'''
y=[np_utils.to_categorical(label,num_classes=label_size) for label in y]
y=np.array([list(_[0]) for _ in y])
return x,y,output_dictionary,vocab_size,label_size,inverse_word_dictionary
# 创建深度学习模型,Embedding + LSTM + Softmax
def create_LSTM(n_units,input_shape,output_dim,filepath):
x,y,output_dictionary,vocab_size,label_size,inverse_word_dictionary=load_data(filepath)
model=Sequential()
model.add(Embedding(input_dim=vocab_size+1,output_dim=output_dim,
input_length=input_shape,mask_zero=True))
model.add(LSTM(n_units,input_shape=(x.shape[0],x.shape[1])))
model.add(Dropout(0.2))
model.add(Dense(label_size,activation='softmax'))
model.compile(loss='categorical_crossentropy',optimizer='adam',metrics=['accuracy'])
'''
error:ImportError: ('You must install pydot (`pip install pydot`) and install graphviz (see instructions at https://graphviz.gitlab.io/download/) ', 'for plot_model/model_to_dot to work.')
版本问题:from keras.utils.vis_utils import plot_model
真正解决方案:https://www.pianshen.com/article/6746984081/
'''
plot_model(model,to_file='./model_lstm.png',show_shapes=True)
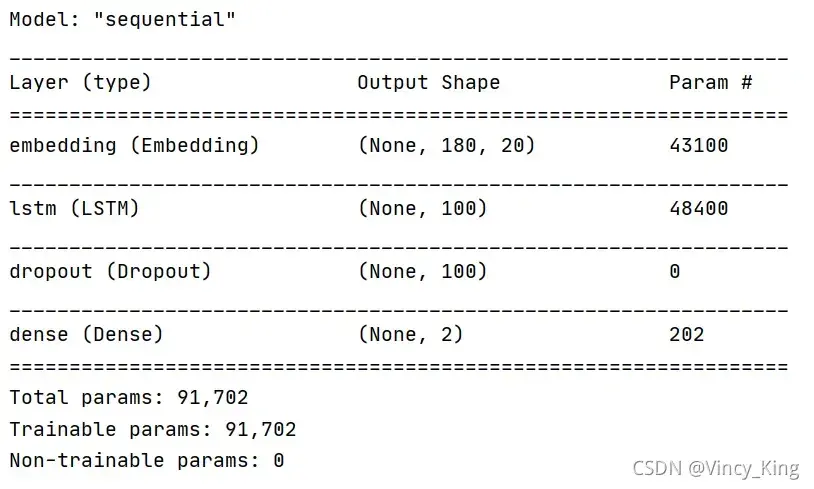
# 输出模型信息
model.summary()
return model
# 模型训练
def model_train(input_shape,filepath,model_save_path):
# 将数据集分为训练集和测试集,占比为9:1
# input_shape=100
x,y,output_dictionary,vocab_size,label_size,inverse_word_dictionary=load_data(filepath,input_shape)
train_x,test_x,train_y,test_y=train_test_split(x,y,test_size=0.1,random_state=42)
# 模型输入参数,需要根据自己需要调整
n_units=100
batch_size=32
epochs=5
output_dim=20
# 模型训练
lstm_model=create_LSTM(n_units,input_shape,output_dim,filepath)
lstm_model.fit(train_x,train_y,epochs=epochs,batch_size=batch_size,verbose=1)
# 模型保存
lstm_model.save(model_save_path)
# 测试条数
N= test_x.shape[0]
predict=[]
label=[]
for start,end in zip(range(0,N,1),range(1,N+1,1)):
print(f'start:{start}, end:{end}')
sentence=[inverse_word_dictionary[i] for i in test_x[start] if i!=0]
y_predict=lstm_model.predict(test_x[start:end])
print('y_predict:',y_predict)
label_predict=output_dictionary[np.argmax(y_predict[0])]
label_true=output_dictionary[np.argmax(test_y[start:end])]
print(f'label_predict:{label_predict}, label_true:{label_true}')
# 输出预测结果
print(''.join(sentence),label_true,label_predict)
predict.append(label_predict)
label.append(label_true)
# 预测准确率
acc=accuracy_score(predict,label)
print('模型在测试集上的准确率:%s'%acc)
if __name__=='__main__':
filepath='data/data_single.csv'
input_shape=180
model_save_path='data/corpus_model.h5'
model_train(input_shape,filepath,model_save_path)
五、重点函数讲解
plot_model
如果代码中输入from keras.utils import plot_model报错的话,可以改成from keras.utils.vis_utils import plot_model。
而我改了之后仍然报错:error:ImportError: (‘You must install pydot (pip install pydot) and install graphviz (see instructions at https://graphviz.gitlab.io/download/) ‘, ‘for plot_model/model_to_dot to work.’)
以下为解决方案:
- (1)pip install pydot_ng
- (2)pip install graphviz,这个建议不要直接pip install,去官网下载,我是下载了以下版本
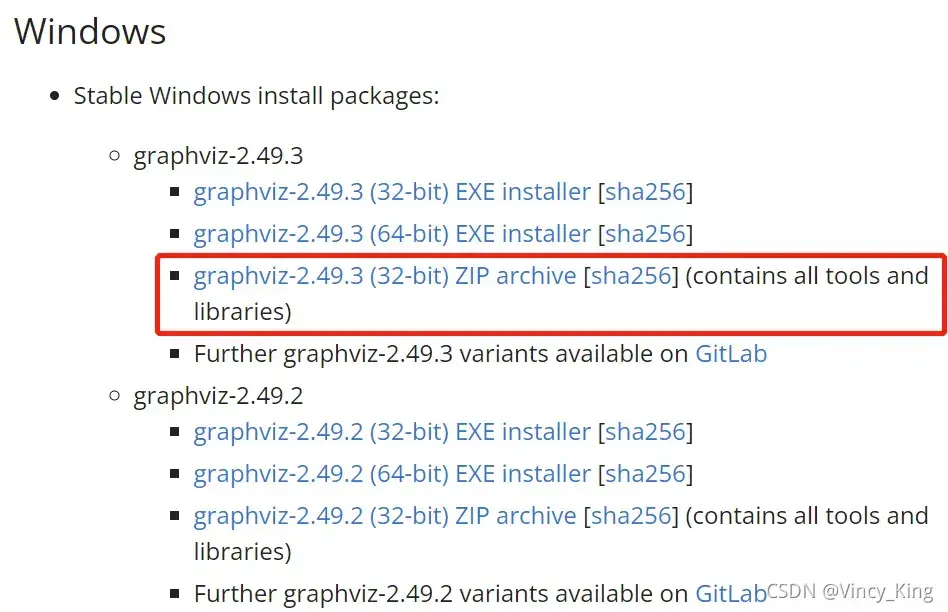
解压后放入对应的anaconda环境的site-package中,然后复制bin的目录。 - (3)修改site-packages\pydot_ng_init_.py中的代码,在Method3 添加:path = r”D:\App\tech\Anaconda3\envs\nlp\Lib\site-packages\Graphviz\bin” //该路径指向刚才复制的路径,如图所示:

np_utils.to_categorical
np_utils.to_categorical用于将标签转化为形如(nb_samples, nb_classes)
的二值序列。
假设num_classes = 10。
如将[1, 2, 3,……4]转化成:
[[0, 1, 0, 0, 0, 0, 0, 0]
[0, 0, 1, 0, 0, 0, 0, 0]
[0, 0, 0, 1, 0, 0, 0, 0]
……
[0, 0, 0, 0, 1, 0, 0, 0]]
model.summary()
通过model.summary()输出模型各层的参数状况,如图所示:
特别感谢
此文章参考了农夫三拳有點疼 博客和错误解决参考链接
文章出处登录后可见!