| 提供的api | 说明 |
|---|---|
| displot | Figure-level interface for drawing distribution plots onto a FacetGrid. 图形级界面,用于在FacetGrid上绘制分布图。 |
| histplot | Plot univariate or bivariate histograms to show distributions of datasets. 绘制单变量或双变量直方图来显示数据集的分布。 |
| kdeplot | Plot univariate or bivariate distributions using kernel density estimation. 使用核密度估计绘制单变量或双变量分布 |
| ecdfplot | Plot empirical cumulative distribution functions.绘制经验累积分布函数。 |
| rugplot | Plot marginal distributions by drawing ticks along the x and y axes. 通过在x和y轴上画刻度来绘制边缘分布。 |
| distplot | DEPRECATED: Flexibly plot a univariate distribution of observations. :灵活地绘制观测数据的单变量分布。 |
displot
语法
seaborn.displot(data=Node,*, x=None, y=None, hue=None, row=None, col=None, weights=None, kind='hist',
rug=False, rug_kws=None, log_scale=None, legend=True, palette=None, hue_order=None, hue_norm=None,
color=None, col_wrap=None, row_order=None, col_order=None, height=5, aspect=1, facet_kws=None, **kwargs)
这个函数提供了几种可视化数据的单变量或双变量分布的方法,包括通过语义映射和跨多个子图分面定义的数据子集。
通过kind参数,选择不同的方法:
- histplot()
- kedplot()
- edfplot()
此外,可以将rugplot()添加到任何类型的图中以显示单个的观察结果。
参数说明
- data是输入的数据集,数据类型可以是pandas.DataFrame对象、numpy.ndarray数组、映射或序列类型等。
- x和y是参数data中的键或向量,指定关系图中x轴和y轴的变量。
- hue也是data中的键或向量,根据hue变量对数据进行分组,并在图中使用不同颜色的元素加以区分。
- hue_order指定色调语义的分类级别的处理和绘图顺序。
- hue_norm可以是设置数据单元规范化范围的一对值,也可以是将数据单元映射到[0,1]区间的对象。 使用意味着数字映射。
- size也是data中的键或向量,根据size变量控制图中点的大小或线条的粗细。
- style也是data中的键或向量,根据style变量对数据进行分组,并在图中使用不同类型的元素加以区分,比如点线、虚线等。
- kind指定要绘制的关系图类型,可选”scatter”(散点图)和”line”(线形图),默认值为”scatter”。
举例
#可以加载anaconda中sns库自己带的一些数据源 进行示例。
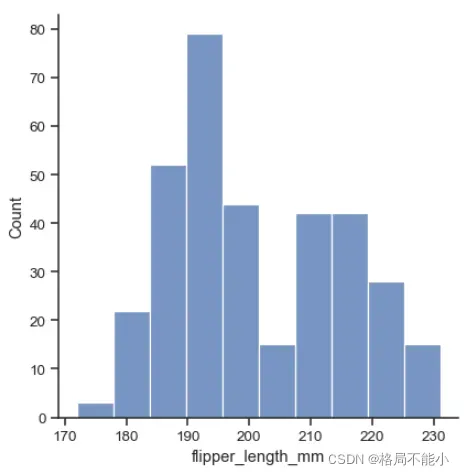
penguins = sns.load_dataset("penguins")
sns.displot(data=penguins, x="flipper_length_mm")
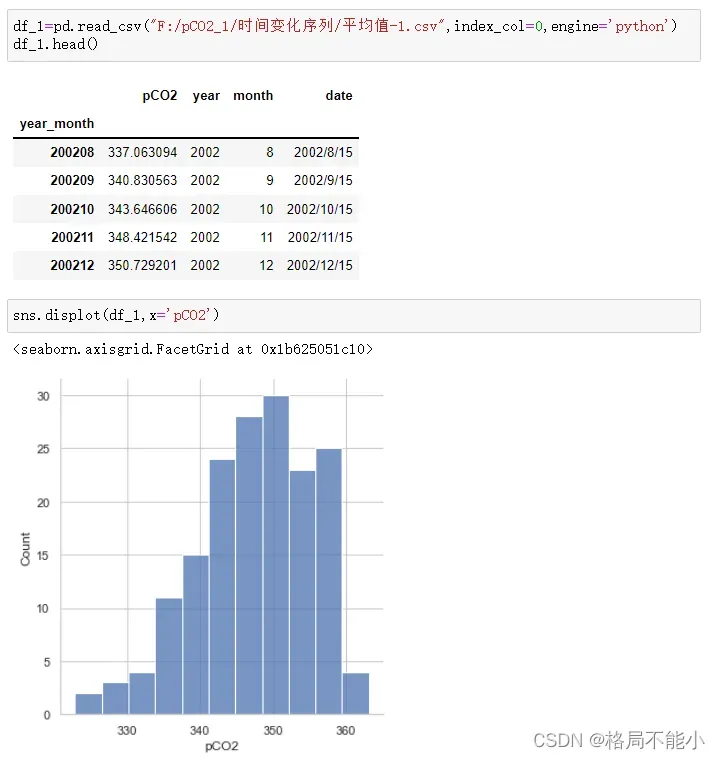
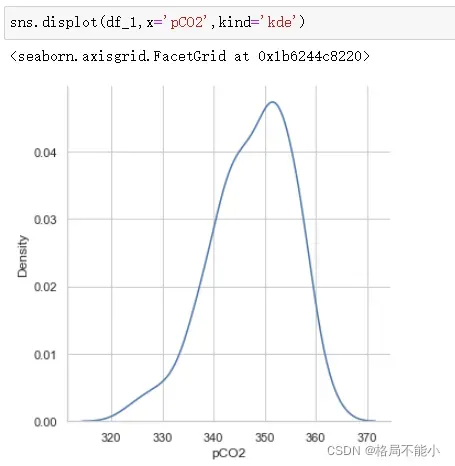
使用kind=‘kde’参数来显示核密度估计,(kernel density estimates);
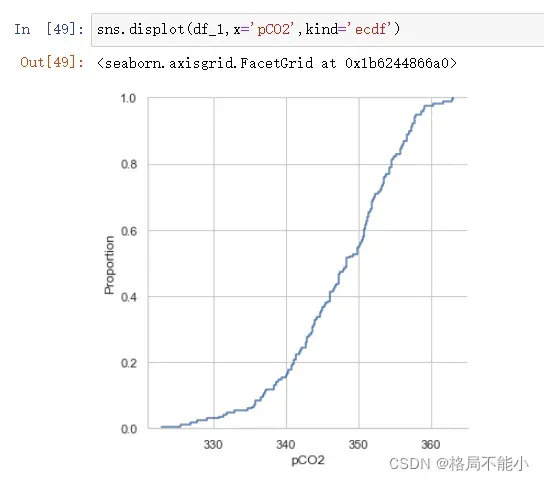
使用kind=’ecdf’参数来显示经验累积分布函数(empirical cumulative distribution functions)
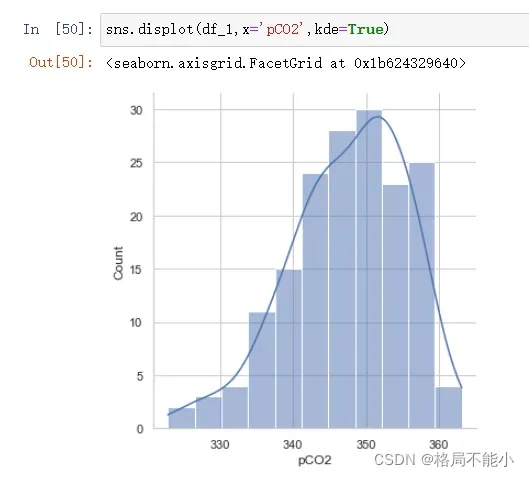
同时也可以在直方图中,显示核密度估计
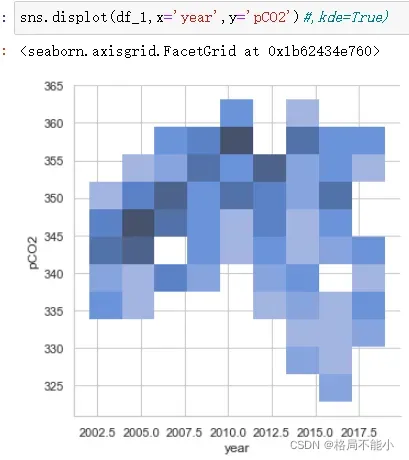
绘制一个二元分析图,将x和y都赋值:
这幅图片里面内容不是很有意义,但是也能看得出pCO2值与year的变化与分布;
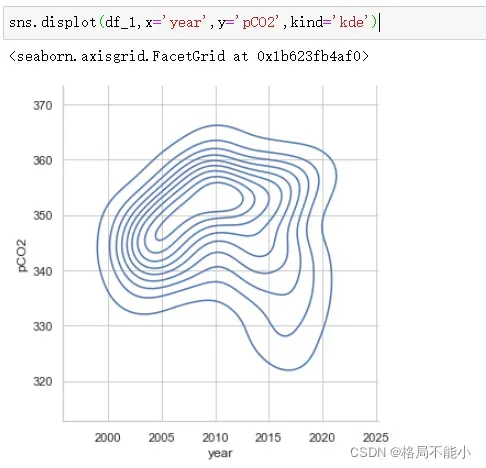
 目前,二元分析图仅适用于直方图和KDEs: 当然也可以使用kdes方式来画二元分析图,可以发现数据的分布情况;
关于其他函数的讲解
还有其他API:histplot,kdeplot。。。读者可以参考下面网址。
这些画图工具能画出来太多的图了,但是基本上用法大家都清楚。
https://seaborn.pydata.org/api.html#categorical-plots
文章出处登录后可见!
已经登录?立即刷新