目录
前言
之前一直使用netCDF处理.nc格式数据,最近因为插值接触到了xarray,了解了一下发现xarray真的很好用的,个人感觉甩了netCDF几条街(个人观点,不喜勿喷)。有兴趣的可以了解一下
xarray官网API,想详细了解的还是得学官网
下面正式开始讲点xarray中常用的语句
一、安装xarray
conda install xarray
二、创建xarray数据
xarray数据主要包含四个内容,官网介绍如下:
-
values: a numpy.ndarray holding the array’s values -
dims: dimension names for each axis (e.g.,('x', 'y', 'z')) -
coords: a dict-like container of arrays (coordinates) that label each point (e.g., 1-dimensional arrays of numbers, datetime objects or strings) -
attrs: dict to hold arbitrary metadata (attributes)官网
官网提供的两个例子:第一个是普通的数据,第二个是气候数据为例,一个数据集,包含了数据主体(Temperature, Precipitation),维度坐标(latitude,longitude)。
第一个例子:
import numpy as np
import xarray as xr

data = np.random.rand(4, 3)
locs = ["IA", "IL", "IN"]
times = pd.date_range("2000-01-01", periods=4)
foo = xr.DataArray(data, coords=[times, locs], dims=["time", "space"])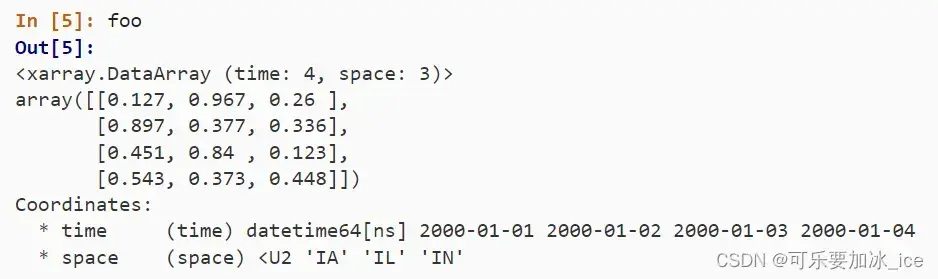
第二个例子:
import numpy as np
import xarray as xr
temp = 15 + 8 * np.random.randn(2, 2, 3)
precip = 10 * np.random.rand(2, 2, 3)
lon = [[-99.83, -99.32], [-99.79, -99.23]]
lat = [[42.25, 42.21], [42.63, 42.59]]
ds = xr.Dataset({'temperature': (['x', 'y', 'time'], temp),
                 'precipitation': (['x', 'y', 'time'], precip)},
                coords={'lon': (['x', 'y'], lon),
                        'lat': (['x', 'y'], lat),
                        'time': pd.date_range('2014-09-06', periods=3),
                        'reference_time': pd.Timestamp('2014-09-05')})
三、读取nc数据
通过函数open_dataset `、open_dataarray将nc数据进行读、to_netcdf写
NcDataERA5 = xr.open_dataset('./example.nc')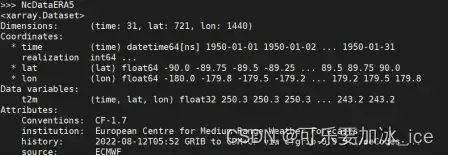
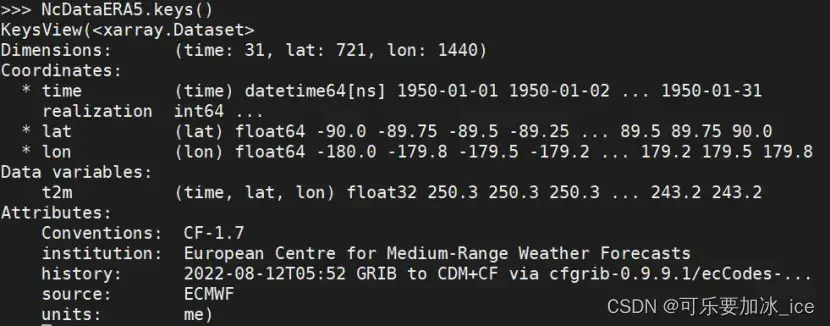
四、看出文件信息
可以直接print或者.key()
五、增加变量属性
一个有用选择是去设置 NcDataERA5.attrs[‘long_name’] 和 NcDataERA5.attrs[‘units’],因为 xarray 在绘图时会自动使用他们来进行标记
NcDataERA5. attrs[‘units’] = ‘meters’
六、修改坐标数值:
T2mERA19500101.coords[‘lon’] = np.arange(0, 359.75, 1)
七、索引和切片
xarray 支持4种索引方式:
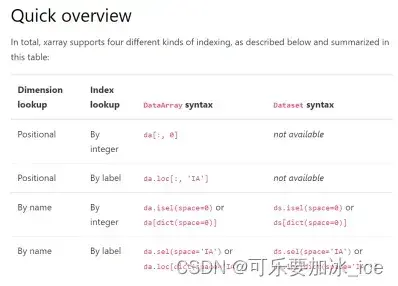
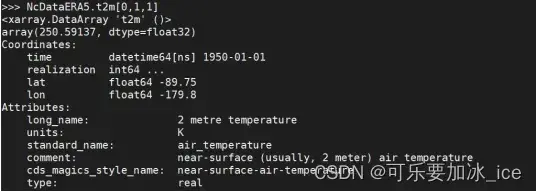
7.1根据位置索引:
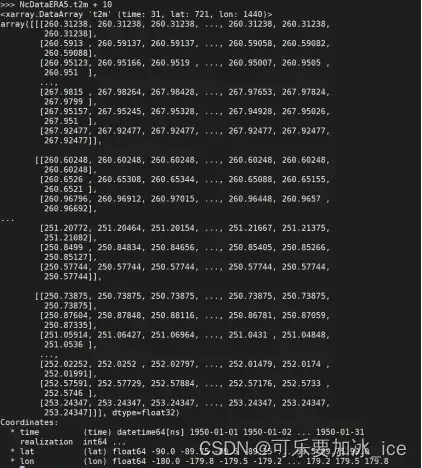
NcDataERA5.t2[0,1,1]
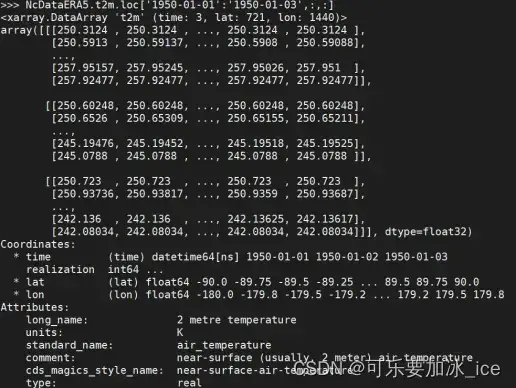
7.2根据位置索引:
NcDataERA5.t2m.loc[‘1950-01-01′:’1950-01-03’,:,:]
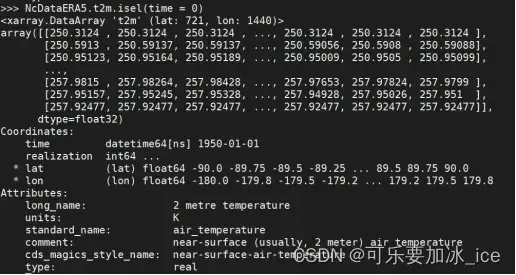
7.3根据维度名索引:
time维度第0个:NcDataERA5.t2m.isel(time = 0)
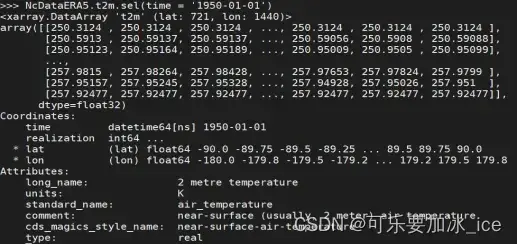
7.4根据维度名索引:
time维度中是’1950-01-01’的数据:
NcDataERA5.t2m.sel(time = ‘1950-01-01’)
7.5 网上一些补充
八、将变量取array格式
NcDataERA5.t2m.values 或者 NcDataERA5.t2m.data
九、计算
9.1 相加
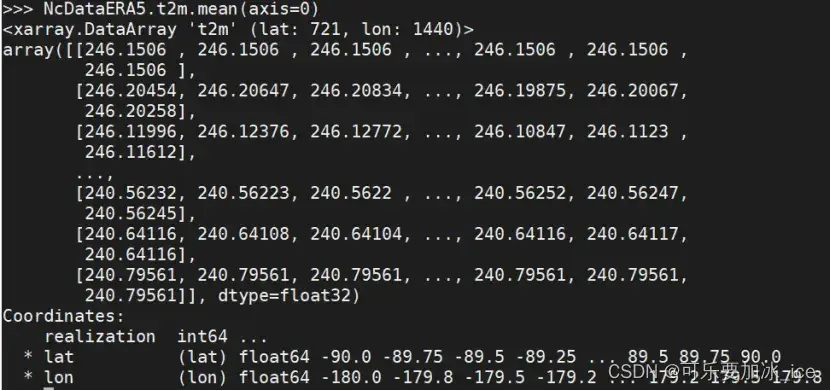
9.2 平均、求和
NcDataERA5.t2m.mean(axis=0) #[time, lat, lon] 在time维度取平均为[lat, lon], NcDataERA5.t2m.mean() #全部维度取平均
类似的还有求和之类NcDataERA5.t2m.sum(axis=0)
还可以利用.groupby()函数将月份作为键(唯一值)来对原数据进行分类,即把各年某个月的数据放在一个组,用这种方法首先要求time维度格式是datetime,即可以使用time.month,time.year
如果time维度不满足格式,则先用pd.to_datetime转一下格式
DataCollect.coords[‘time’] = pd.to_datetime(DataCollect.time)
然后使用DataCollect.groupby(‘time.month’).sum(‘time’):
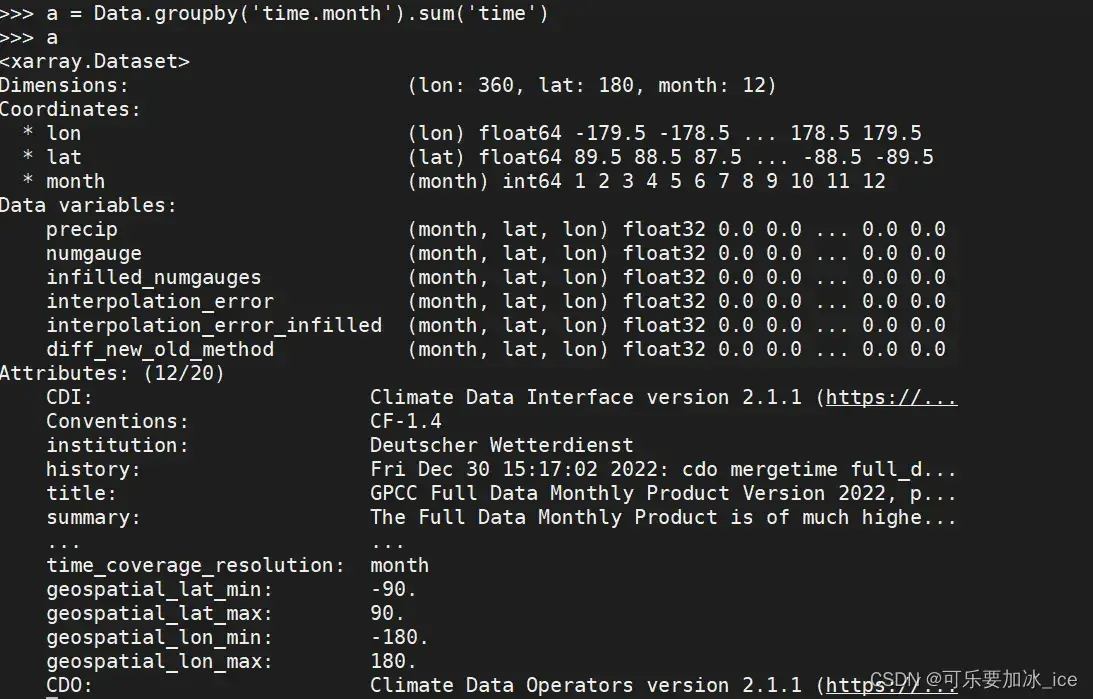
举个例子:GCPP 降水数据 1951.1-2020.12:
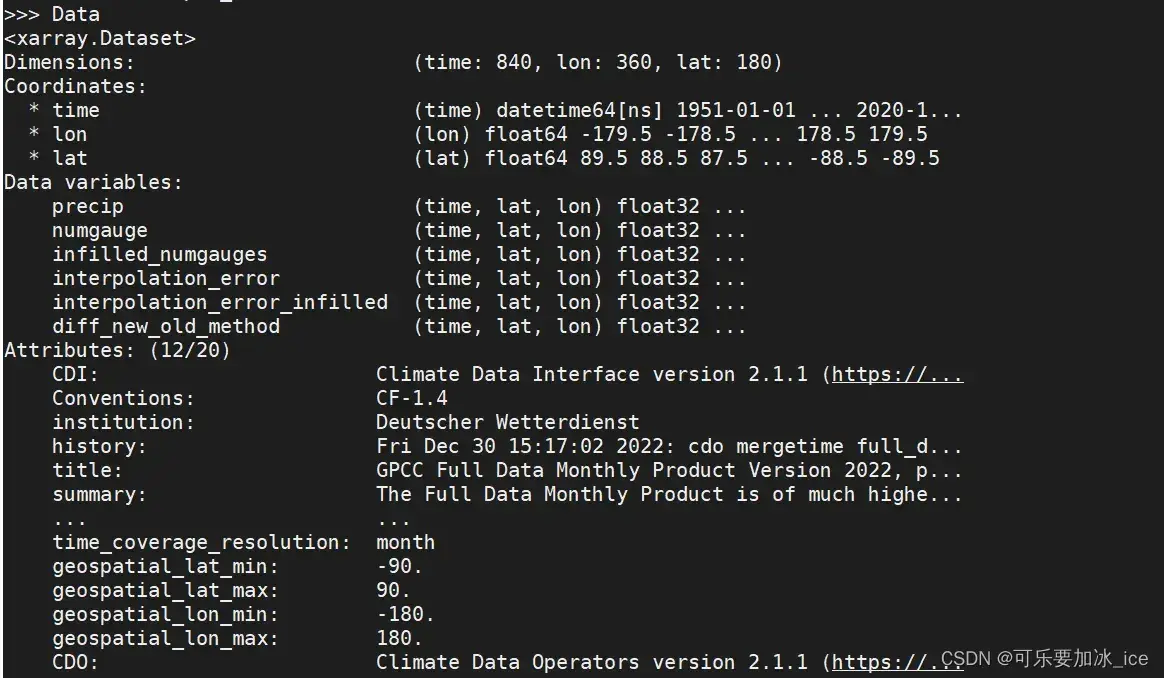
Data.groupby(‘time.month’).sum(‘time’) 之后:
9.3 三角函数、转置
np.sin(NcDataERA5.t2m) 、 NcDataERA5.t2m.T
十、绘图
可以直接.plot()来简单可视化一下,要画漂亮的图还是要自己写代码的
十一、filter_by_attrs:
按要素名字获取某个要素
xarray.Dataset.filter_by_attrs
十二、插值
12.1 将粗分辨率插值到细的分辨率
xarray中插值是真的很方便~入坑第一原因
直接.interp()就行了,简简单单
dsLRlinear2 = ds.ts.interp(lat = LatLR, lon = LonLR, method='linear')
其中,LatLR和LonLR是你想要插值的经纬度数据,1D
method:linear、cubic、nearest可选
12.2 处理xarray中缺测(NaN),将其通过插值补全
对于.nc数据,经常出现的一种情况就是在空间维度上(lats, lons)出现缺测NaN,那通过Xarray读取,该如何通过插值补全这些NaN呢,直接用12.1中.interp是行不通的,因为原数据有测,.interp插值会插值很多缺测出来。解决方法:利用pandas中的.interpolate进行插值
#把xarray.DataArray转成pandas
#DataVariablesEachDay__中有缺测
DataVariablesEachDayPd = DataVariablesEachDay__.to_pandas()
DataVariablesEachDayPd.interpolate(method='linear', limit_direction='both', axis=0, inplace=True)
DataVariablesEachDayPd.interpolate(method='linear', limit_direction='both', axis=1,
                                 inplace=True)
#再将pandas转成xarray.DataArray
DataVariablesEachDay = xr.DataArray(DataVariablesEachDayPd, coords=[LatCESM2, LonCESM2], dims=["lat", "lon"])
十三、Bugs 汇总
1.
found the following matches with the input file in xarray’s IO backends: [‘netcdf4’, ‘h5netcdf’]. But their dependencies may not be installed
这是由于新装的环境只装了xarray,没有安装netcdf4
pip install netcdf4即可
文章出处登录后可见!