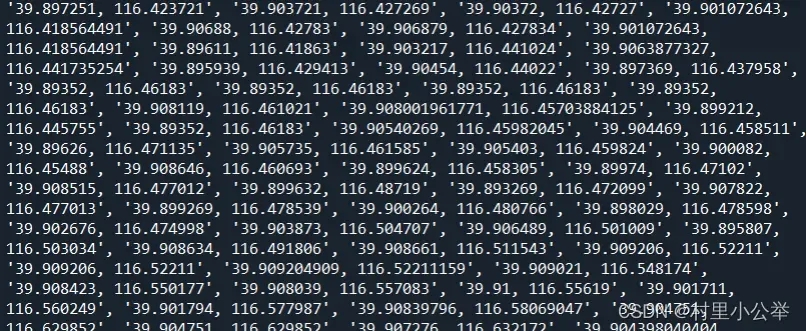
情绪理解是文本处理里最常见任务之一。现提供一个五类情绪字典(由情绪词组成,5个文件,人工标注),实现一个情绪分析工具,并利用该工具对10000条新浪微博进行测试和分析(一行一条微博)。微博数据见课程中心weibo.txt,字典数据见公开数据中的emotion lexicon
(https://doi.org/10.6084/m9.figshare.12163569.v2)。请按要求用函数进行功能封装,并在main中调用测试,鼓励尝试不同方式的可视化。
1. 实现一个函数,对微博数据进行清洗,去除噪声(如url等),过滤停用词。注意分词的
时候应该将情绪词典加入Jieba的自定义词典,以提高这些情绪词的识别能力。
2.实现两个函数,实现一条微博的情绪分析,返其情绪向量或情绪值。目前有两种方法,一是认为一条微博的情绪是混合的,即一共有n个情绪词,如果joy有n1个,则joy的比例是 n1/n;二是认为一条微博的情绪是唯一的,即n个情绪词里,anger的情绪词最多,则该微博的情绪应该为anqrv。注意,这里要求用闭包实现,尤其是要利用闭包实现一次加载情绪词典且局部变量持久化的特点。同时,也要注意考虑一些特别的情况,如无情绪词出现,不同情绪的情绪词出现数目一样等,并予以处理(如定义为无情绪,便于在后面的分析中去除)。
3、微博中包含时间,可以讨论不同时间情绪比例的变化趋势,实现一个函数,可以通过参数来控制并返回对应情绪的时间模式,如joy的小时模式,sadness的周模式等。
4.微博中包含空间,可可以讨论情绪的空间分布,实现一个函数,可以通过参数来控制并返回对应情绪的空间分布,即围绕某个中心点,随着半径增加该情绪所占比例的变化,中心点可默认值可以是城市的中心位置。
5. (附加)讨论字典方法进行情绪理解的优缺点,有无可能进一步扩充字典来提高情绪识别的准确率?
6. (附加)可否对情绪的时间和空间分布进行可视化?(如通过matplotlib绘制曲线,或者用pyecharts(注意版本的兼容性)在地图上标注不同的情绪)
7.(附加)思考情绪时空模式的管理意义?
目录
一、源代码
import jieba
import matplotlib.pyplot as plt
import re
import easygui as g
from pyecharts.charts import Geo
from pyecharts import options as opts
from pyecharts.globals import GeoType
def Emo_list():
'''这是将存储情绪词的文件路径变成列表'''
path1 = "D:/学习文件/大三上/现代程序设计/第二次作业/emotion_lexicon/anger.txt"
path2 = "D:/学习文件/大三上/现代程序设计/第二次作业/emotion_lexicon/disgust.txt"
path3 = "D:/学习文件/大三上/现代程序设计/第二次作业/emotion_lexicon/fear.txt"
path4 = "D:/学习文件/大三上/现代程序设计/第二次作业/emotion_lexicon/joy.txt"
path5 = "D:/学习文件/大三上/现代程序设计/第二次作业/emotion_lexicon/sadness.txt"
emotion_path = [path1,path2,path3,path4,path5]
return emotion_path
def add_word(emotion_path):
'''这是将情绪词加入jieba库,增加分词的可信力'''
for i in emotion_path:
jieba.load_userdict(i)
def Read_txt():
'''读入微博评论,按行存入列表'''
with open("D:\学习文件\大三上\现代程序设计\第二次作业\weibo1.txt",'r',encoding='utf-8') as f:
comments = f.read().splitlines()
return comments
def Clean_txt(comments):
'''这是对微博评论进行清洗,去除一些无意义的数据'''
#path是提前定义的,清洗后评论文件存放的地址
path = "D:/学习文件/大三上/现代程序设计/第二次作业/after_clean3.txt"
for com in comments: #对评论列表进行遍历
com = re.sub(r"(回复)?(//)?\s*@\S*?\s*(:| |$)", " ", com) # 去除正文中的@和回复/转发中的用户名
com = re.sub(r"\[\S+\]", "", com) # 去除表情符号
# com = re.sub(r"#\S+#", "", com) # 保留话题内容
URL_REGEX = re.compile(
r'(?i)\b((?:https?://|www\d{0,3}[.]|[a-z0-9.\-]+[.][a-z]{2,4}/)(?:[^\s()<>]+|\(([^\s()<>]+|(\([^\s()<>]+\)))*\))+(?:\(([^\s()<>]+|(\([^\s()<>]+\)))*\)|[^\s`!()\[\]{};:\'".,<>?«»“”‘’]))',re.IGNORECASE)
com = re.sub(URL_REGEX, "", com) # 去除网址
com = com.replace("我在:", "") # 去除无意义的词语
com = com.replace("我在这里:","")
com = re.sub(r"\s+", " ", com) # 合并正文中过多的空格
#将每一行清洗后评论写入path路径
after_clean = open(path,'a',encoding='utf-8')
after_clean.write(com+'\n')
return path
def Label_comment(path,emotion_path):
'''提取出每条评论的情绪、时间、地点。其中使用了闭包函数'''
emotions_list = [] #一个二维列表
for i in range(5):
with open(emotion_path[i],'r',encoding='utf-8') as f:
x= f.read().splitlines() #按行分词将文件变成列表
emotions_list.append(x)
#Cut()为内嵌函数
def Cut():
nonlocal emotions_list #将之前生成了情绪列表传入
nonlocal path #将清洗好的评论文件路径传入
#按path路径读入清洗后的评论文件
with open(path,'r',encoding='utf-8') as f:
comments = f.read().splitlines()
location = [] #存放经纬度列表
time = [] #存放时间的列表
emotion = [] #存放情绪的列表
for com in comments: #对评论进行遍历
emo_dict = {'anger':0,'disgust':0,'fear':0,'joy':0 ,'sadness':0} #对每条评论创建一个初始情绪字典
t = com[-30:] #时间为一条评论的后30个字符
a = com.index(']') #对‘]’进行定位
l = com[1:a] #l为储存经纬度
time.append(t) #往时间列表中加入t
location.append(l) #往经纬度列表中加入l
sentence = com[a+1:-30] #为评论的正文
#print(sentence)
words = jieba.lcut(sentence) #用jieba库进行分词
#依次对其在不同情绪字典中进行判断
for word in words:
if word in emotions_list[0]:
emo_dict['anger'] += 1
elif word in emotions_list[1]:
emo_dict['disgust'] += 1
elif word in emotions_list[2]:
emo_dict['fear'] += 1
elif word in emotions_list[3]:
emo_dict['joy'] += 1
elif word in emotions_list[4]:
emo_dict['sadness'] += 1
else:
pass
#找出字典中对应最大的值,所对应的键,作为该条评论情绪标签
emotion.append(max(emo_dict,key = emo_dict.get))
return emotion,location,time
return Cut
def time_plot(emotion,time):
'''通过参数来控制并返回对应情绪的时间模式,其中我们要选择情绪标签和时间周期两个参数'''
#使用easygui库来实现Gui的可视化参数选择
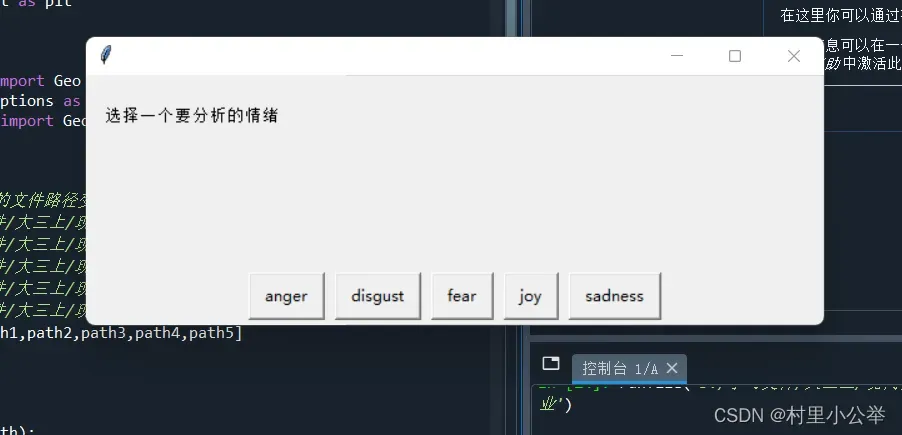
emo = g.buttonbox("选择一个要分析的情绪",choices = ('anger','disgust','fear','joy','sadness'))
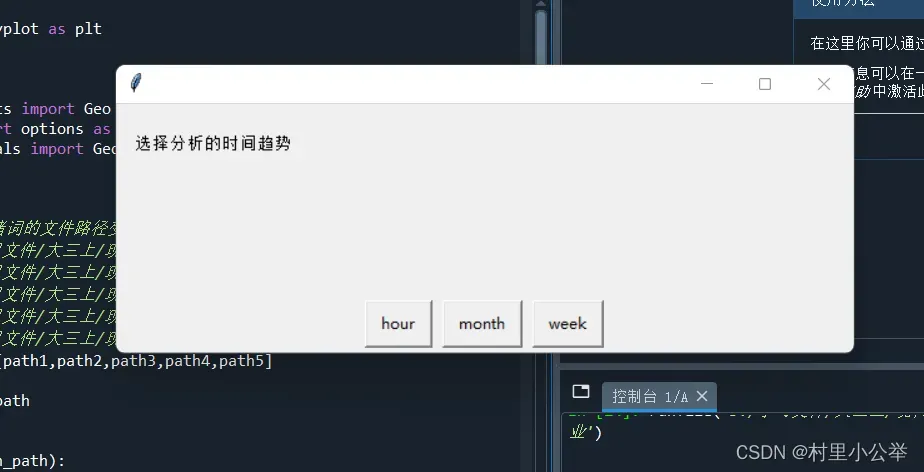
trend = g.buttonbox('选择分析的时间趋势',choices = ('hour','month','week'))
n = len(emotion) #n = len(emotion) = len(location) = len(time)
#对time中的数据进行进一步的切割
weeks = [i[0:3] for i in time]
months = [i[4:7] for i in time]
hours = [i[11:13] for i in time]
#创建星期字典
week_dict = {'Mon':0,'Tue':0,'Wed':0,'Thu':0,'Fri':0,'Sat':0,'Sun':0}
#创建月份字典
month = ['Jan','Feb','Mar','Apr','May','Jun','Jul','Aug','Sep','Oct','Nov','Dec']
month_dict = {}
month_dict = month_dict.fromkeys(month,0)
#创建小时字典
hour_dic = ['{:0>2d}'.format(i) for i in range(1,25)] #format的使用是为了两位对齐
hour_dict = {}
hour_dict = hour_dict.fromkeys(hour_dic,0)
#根据所选trend参数来绘制不同的图形
if trend == 'hour':
for i in range(n):
if emo == emotion[i] and hours[i] in hour_dic: #emo为所选情绪参数
hour_dict[hours[i]] += 1
#由情绪字典绘图
x = list(hour_dict.values())
y = list(hour_dict.keys())
plt.plot(y,x)
plt.xlabel("hours")#横坐标名字
plt.ylabel("times")#纵坐标名字
plt.legend(loc = "best")#图例
elif trend == 'month':
for i in range(n):
if emo == emotion[i] and months[i] in ['Jan','Feb','Mar','Apr','May','Jun','Jul','Aug','Sep','Oct','Nov','Dec']: #emo为所选参数
month_dict[months[i]] += 1
#由情绪字典绘图
x = list(month_dict.values())
y = list(month_dict.keys())
plt.plot(y,x)
plt.xlabel("months")#横坐标名字
plt.ylabel("times")#纵坐标名字
plt.legend(loc = "best")#图例
else:
for i in range(n):
if emo == emotion[i] and weeks[i] in ['Mon','Tue','Wed','Thu','Fri','Sat','Sun']: #emo为所选参数
month_dict[weeks[i]] +=1
#由情绪字典绘图
x = list(week_dict.values())
y = list(week_dict.keys())
plt.plot(y,x)
plt.xlabel("weeks")#横坐标名字
plt.ylabel("times")#纵坐标名字
plt.legend(loc = "best")#图例
def Distance(location,emotion,limit):
'''这是显示距离中心距离内的情绪占比图'''
certen = [39.90,116.38] #定义北京天安门为中心
#初始定义一个情绪字典
emo_dict = {'anger':0,'disgust':0,'fear':0,'joy':0,'sadness':0}
n = len(location) #n = len(emotion) = len(location) = len(time)
for i in range(n):
a,b = location[i].split(',')
a = eval(a);b = eval(b) #a是维度,b是经度
distance = ((a-certen[0])**2+(b-certen[1])**2)**0.5 #计算两点的直线距离
if limit >= distance: #距离需要小于等于限制值
emo_dict[emotion[i]] += 1
#由情绪字典绘制饼图
label = list(emo_dict.keys())
size = list(emo_dict.values())
plt.pie(size,labels=label,shadow=True)
def test_geo(emotion,location):
'''在北京地图对情绪的空间分布进行可视化'''
emo = {'sadness':5,'joy':15,'fear':25,'disgust':35,'anger':45}
g = Geo()
data_pair = []
g.add_schema(maptype='北京')
for k in range(len(emotion)):
a,b = location[k].split(',')
a = eval(a);b = eval(b)
data_pair.append((emotion[k]+str(k),emo[emotion[k]]))
#print(type(address_list[k]))
g.add_coordinate(emotion[k]+str(k),b,a)
# 定义坐标对应的名称,添加到坐标库中 add_coordinate(name, lng, lat)
# 将数据添加到地图上
#print(data_pair)
g.add('', data_pair, type_=GeoType.EFFECT_SCATTER, symbol_size=5)
# 设置样式
g.set_series_opts(label_opts=opts.LabelOpts(is_show=False))
# 自定义分段 color 可以用取色器取色
pieces = [
{'min': 1, 'max': 10, 'label': 'sadness', 'color': '#3700A4'},
{'min': 10, 'max': 20, 'label': 'joy', 'color': '#81AE9F'},
{'min': 20, 'max': 30, 'label': 'fear', 'color': '#E2C568'},
{'min': 30, 'max': 40, 'label': 'disgust', 'color': '#FCF84D'},
{'min': 40, 'max': 50, 'label': 'anger', 'color': '#DD0200'}
]
# is_piecewise 是否自定义分段, 变为true 才能生效
g.set_global_opts(
visualmap_opts=opts.VisualMapOpts(is_piecewise=True, pieces=pieces),
title_opts=opts.TitleOpts(title="北京市-情绪分布地图"),
)
return g
def main():
emotion_path = Emo_list()
add_word(emotion_path) #给jieba库加词
comments = Read_txt()
path = Clean_txt(comments)
#下面两行为闭包函数的调用
f1 = Label_comment(path, emotion_path)
emotion,location,time = f1()
#time_plot(emotion,time)
limit = 1
#limit = eval(input("请输入限制距离大小:"))
Distance(location,emotion,limit)
#pyechars绘制北京地图
test_geo(emotion,location)
g.render('beijing.html') # 渲染成html, 可用浏览器直接打开
if __name__ == '__main__':
main()
二、功能实现
1.评论清洗

可以看到清洗之后的评论,少了很多url,还有⼀些重复⽤语。
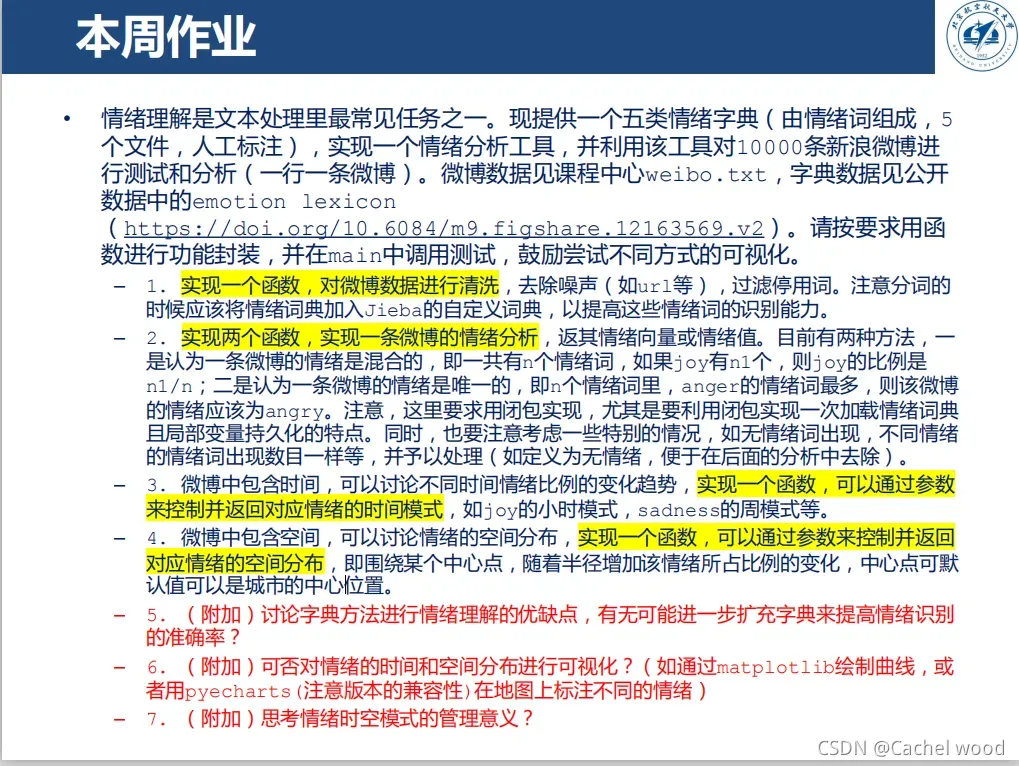
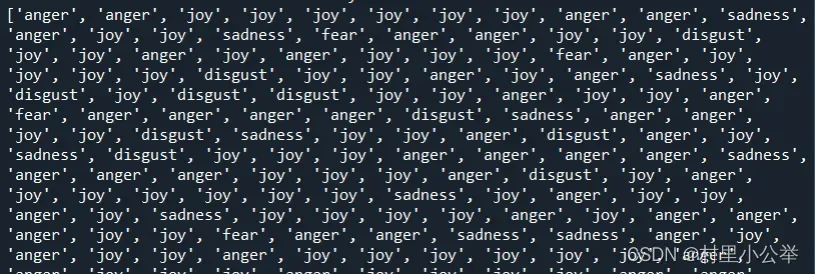
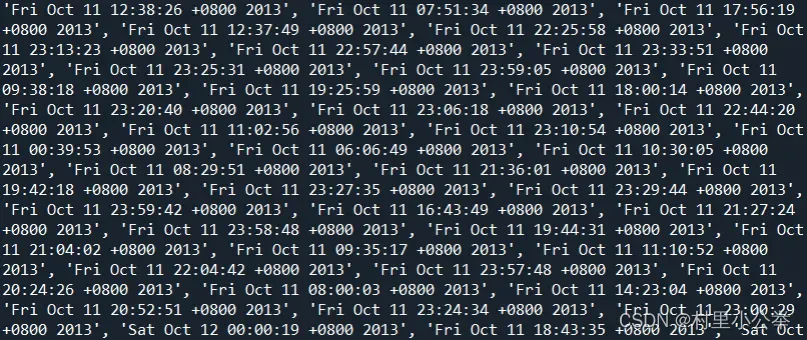
2.对每条评论的情绪、地理位置、时间进⾏标准
 情绪列表
情绪列表
时间列表
地点列表(经纬度)
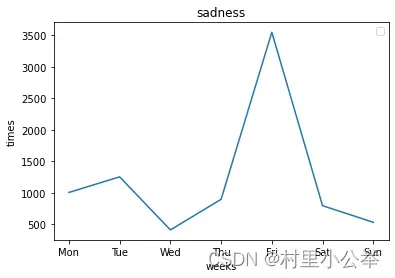
3.情绪的时间模式
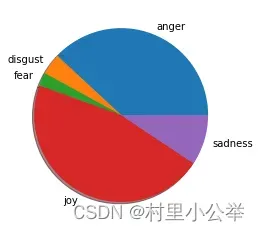
4.围绕中⼼点的情绪⽐例
5.在北京地图上进⾏情绪点的可视化
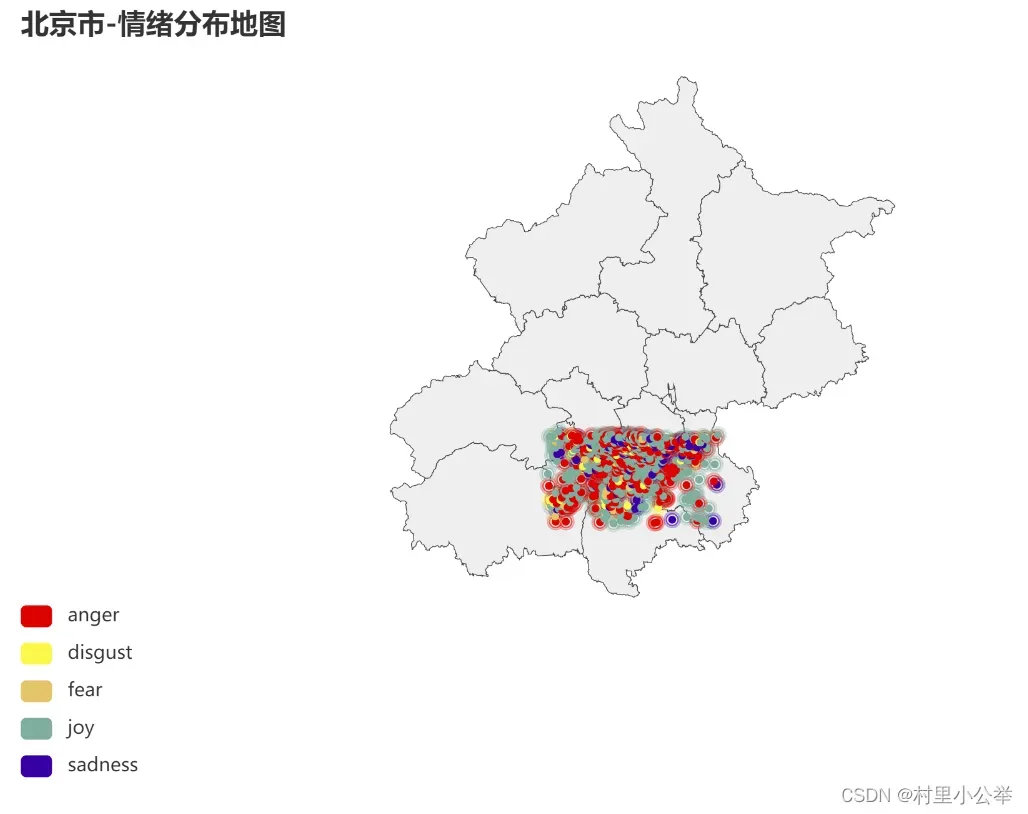
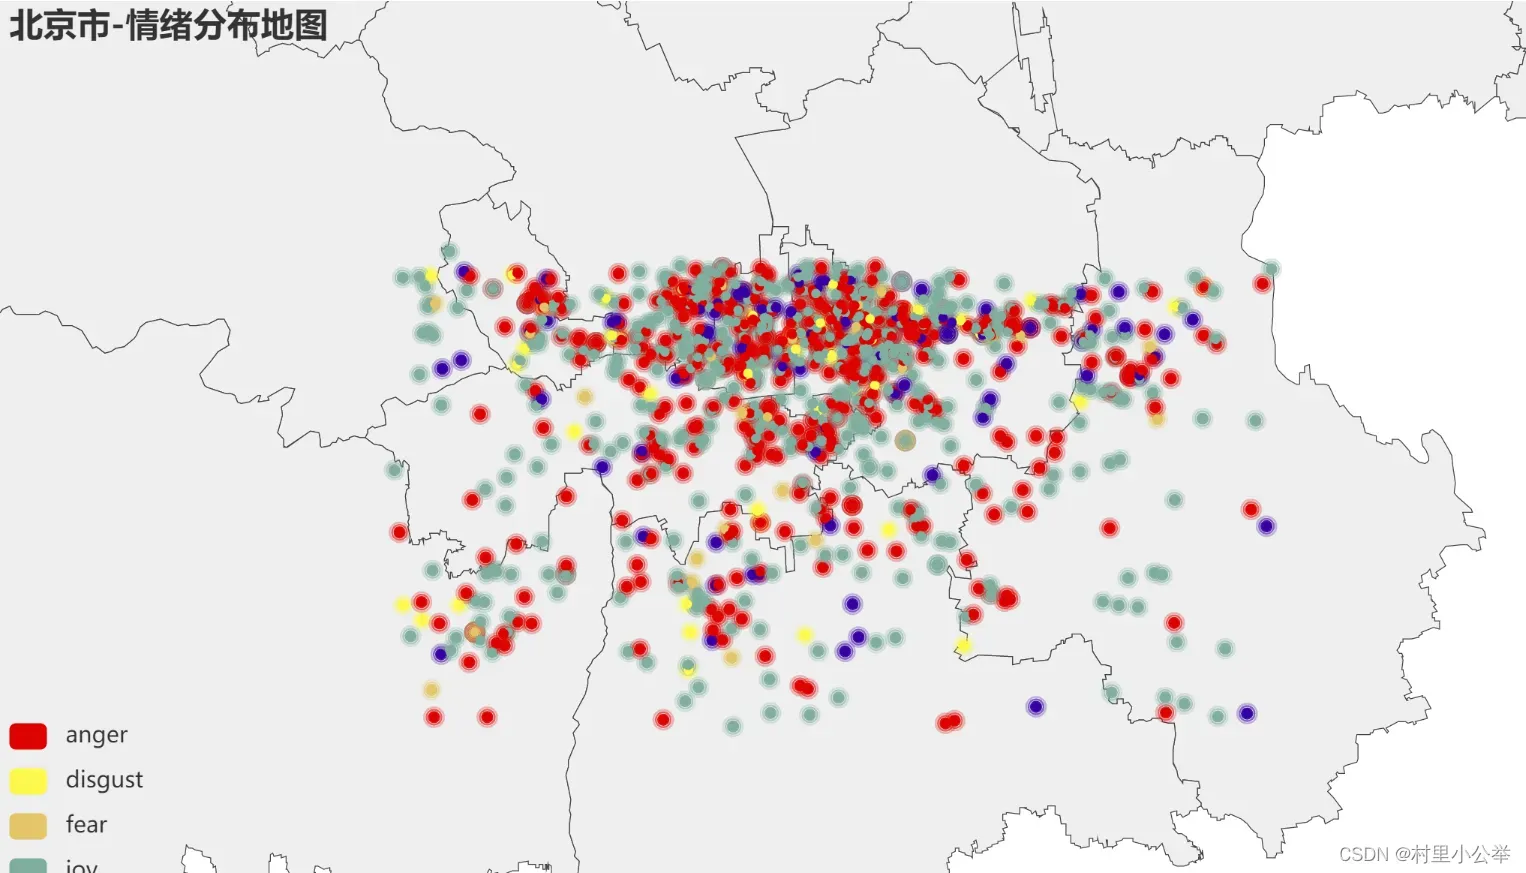
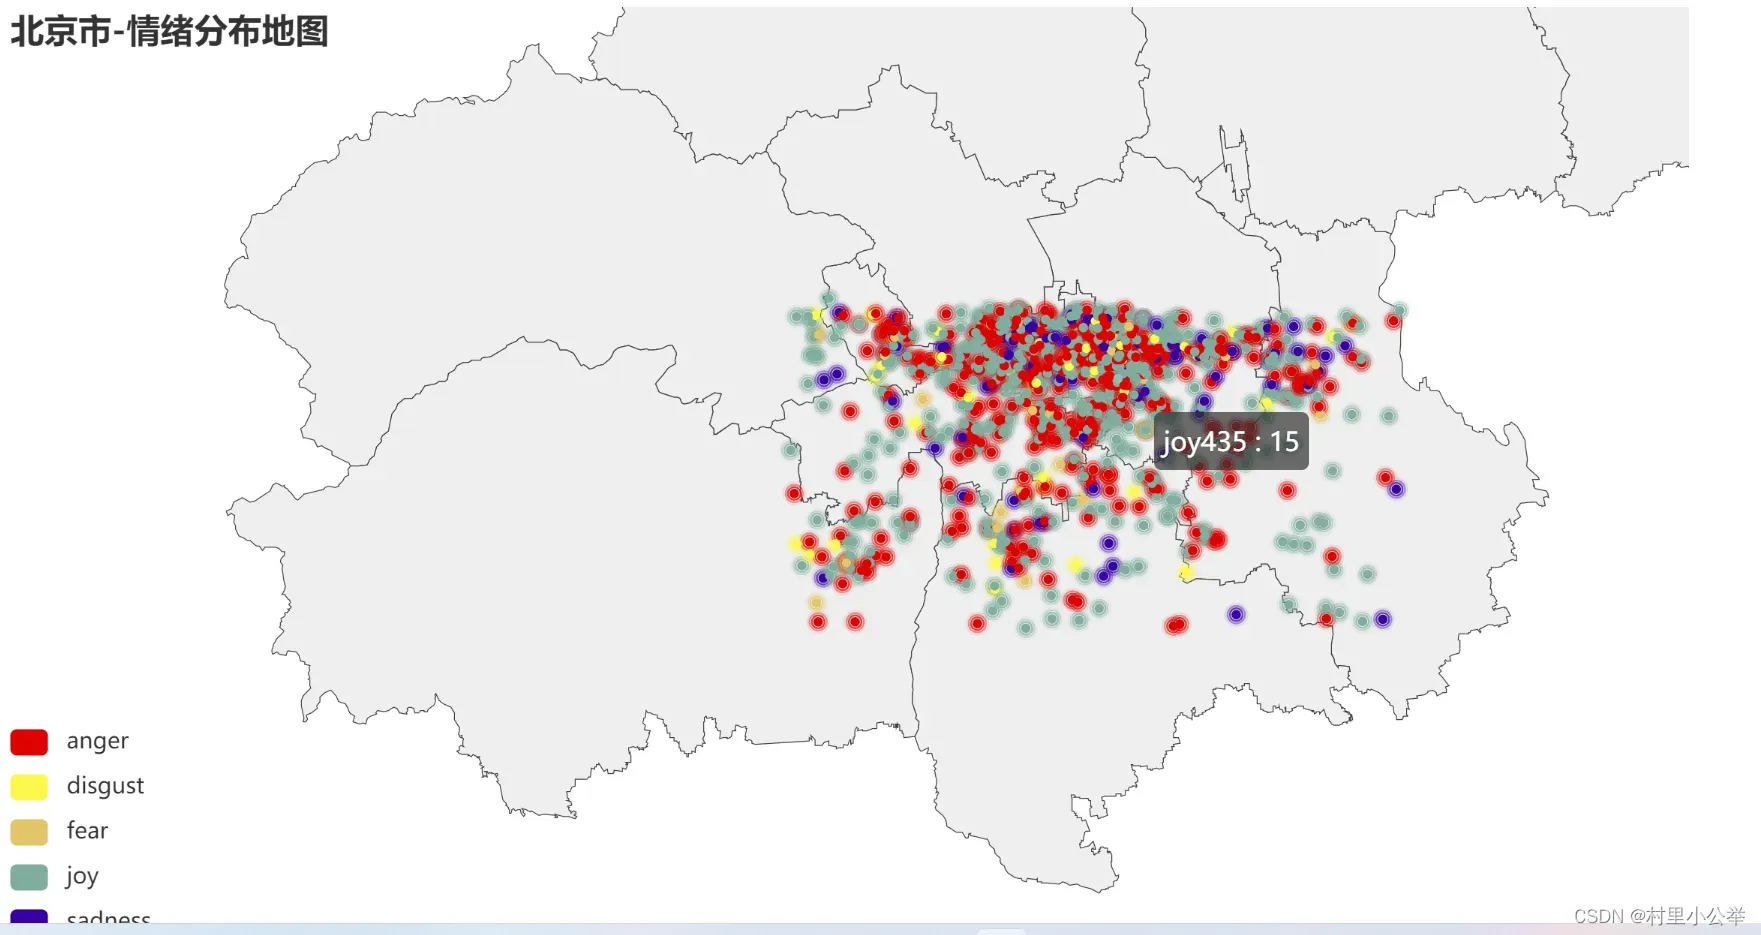
我们发现,该微博数据集数据主要分布在北京的主城区
三、⼀些思考
1.字典⽅法进⾏情绪理解的优缺点
感觉单纯⽤分词对⼀句话进⾏分类会显得很单薄,中国⼈说话可能很委婉。同时,还有⼀些⼈正话反说,这会导致极⼤的误差
2.情绪时空模式的管理意义
四、参考⽂章
文章出处登录后可见!