GPS点位的修改是一个比较麻烦的过程,需要来回采集点位和修改程序,给调试工作带来了一定的工作量。下面这种方法可以在一定程度上方便GPS参数的修改与调试,先说一下实现的效果,可以绘制出GPS轨迹图、一键输出GPS点位程序、拖拽修改GPS点位、修改不同航段点的数量,主要是基于Python和第三方库设计出的一种方案,可以参考一下,用到的其实都是Python里面一些比较基础的知识,希望对大家能有所帮助。
下面附上使用方法和源程序。
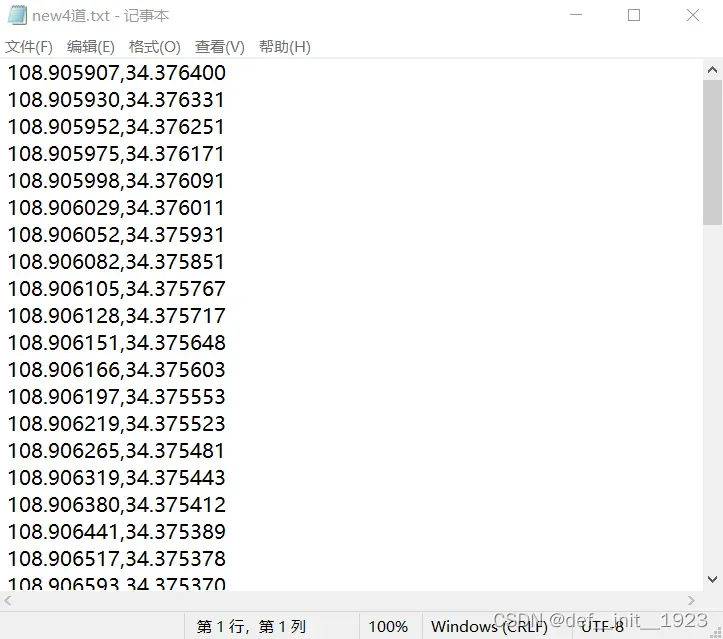
首先,采集一圈GPS点位信息,通过串口输出保存到txt文件中,该txt文件将要作为配置文件使用。数据存储方式为,第一列是经度,第二列是纬度,每个点单独置于一行。大概采30-40个点位即可,采的越多轨迹拟合地越精确。
读取文件的话使用到了下面的程序。
# ---------------读取函数----------------------
def read_point(file_name):
    # 数据存放
    data = []

    with open(file_name, "r") as f:
        for line in f.readlines():
            line = line.strip('\n')
            line = line.strip()
            data.append(line)

    # 读出经纬度数据
    x = []
    y = []

    for dd in data:
        dt = dd.split(',')
        x.append(float(dt[0]))
        y.append(float(dt[1]))

    return x, y
在读出GPS点位信息后,将要进行数据拟合,使用了下面的程序。
# --------------------拟合曲线函数----------------------------
def make_curve(x, y):
# list转numpy
use_x = np.array(x)
use_y = np.array(y)
# 去掉重复的点
okay = np.where(np.abs(np.diff(use_x)) + np.abs(np.diff(use_y)) > 0)
use_xx = np.r_[use_x[okay], use_x[-1], use_x[0]]
use_yy = np.r_[use_y[okay], use_y[-1], use_y[0]]
tck, u = interpolate.splprep([use_xx, use_yy], s=0)
# evaluate the spline fits for 1000 evenly spaced distance values
xi, yi = interpolate.splev(np.linspace(0, 1, 1000), tck)
# 返回最终插补的点,这里搞了1000个,可以根据需要修改一下
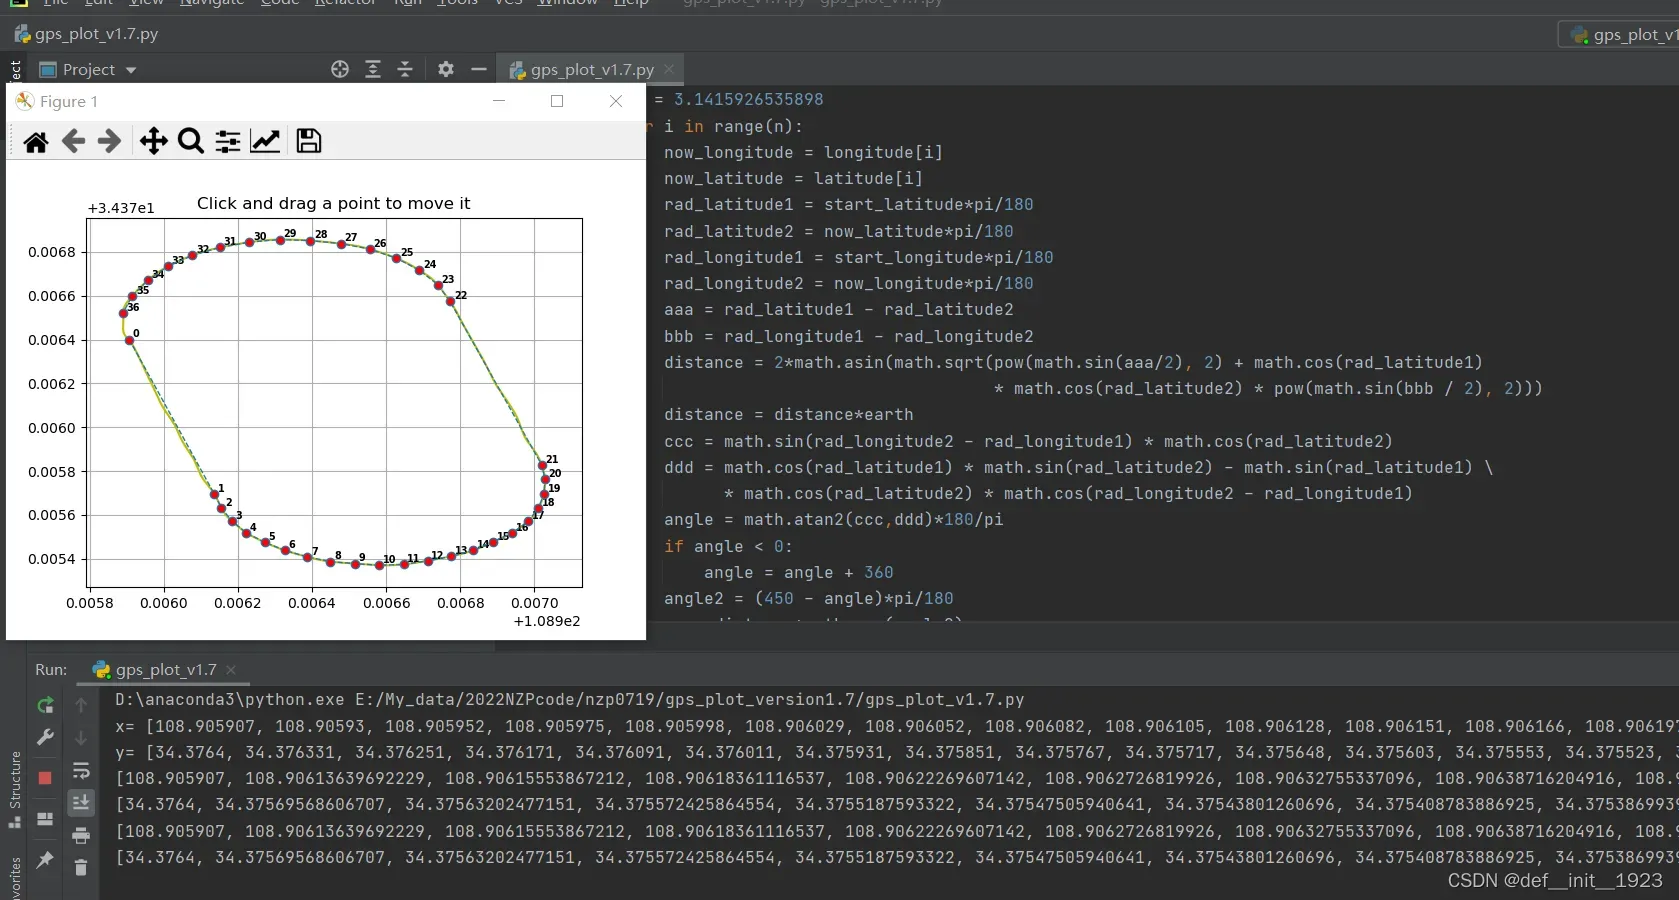
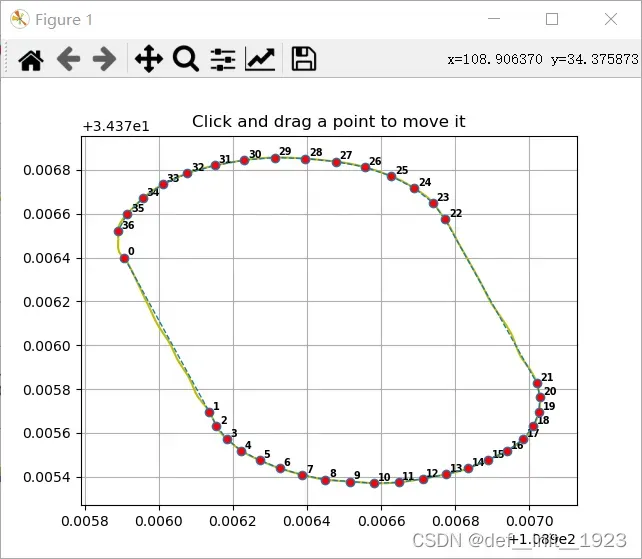
return xi, yi这样就得到了拟合出来的轨迹曲线,一共是1000个点,可以画出来看一下。一开始我们仅仅只是想画出来看看点位也没有采集歪,后来为了方便调试,我们打算设计一种人机交互的方式去拖拽点位,这样调试起来就能更加方便了。主要是参考了这篇文章:https://blog.csdn.net/kyrie001/article/details/90903530
在他的基础上进行了修改,修改后的程序如下。
# ----------------动态图的类------------------------
class Point_Move:
showverts = True
offset = 0.00001 # 距离偏差设置
def __init__(self, gpsx, gpsy, ox, oy):
# 创建figure(绘制面板)、创建图表(axes)
self.fig, self.ax = plt.subplots()
# 设置标题
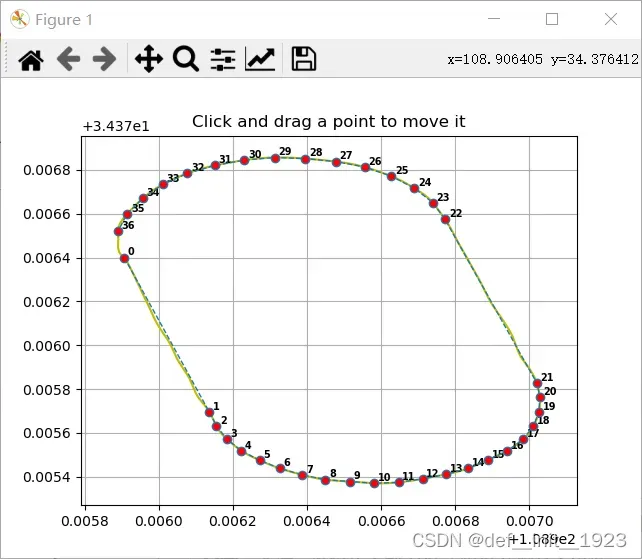
self.ax.set_title('Click and drag a point to move it')
# 设置坐标轴范围
self.ax.set_xlim((min(gpsx)-0.0001, max(gpsx)+0.0001))
self.ax.set_ylim((min(gpsy)-0.0001, max(gpsy)+0.0001))
self.ax.plot(ox, oy, '-y')
# 设置初始值
self.x = gpsx
self.y = gpsy
# 绘制2D的动画line
self.line = Line2D(self.x, self.y, linewidth=1, ls="--",
marker='o', markerfacecolor='r',
animated=True)
self.ax.add_line(self.line)
# 标志值设为none
self._ind = None
# 设置画布,方便后续画布响应事件
canvas = self.fig.canvas
canvas.mpl_connect('draw_event', self.draw_callback)
canvas.mpl_connect('button_press_event', self.button_press_callback)
canvas.mpl_connect('button_release_event', self.button_release_callback)
canvas.mpl_connect('motion_notify_event', self.motion_notify_callback)
self.canvas = canvas
plt.grid()
for i in range(len(self.x)):
plt.text(self.x[i] + 0.00001, self.y[i] + 0.00001, str(i), weight="bold", color="k", fontsize=7)
plt.show()
''
''
' -------------------动作一:界面重新绘制------------------------------- '
# 界面重新绘制:draw_event
def draw_callback(self, event):
self.background = self.canvas.copy_from_bbox(self.ax.bbox)
self.ax.draw_artist(self.line)
self.canvas.blit(self.ax.bbox)
''
''
# -------------------函数:识别按下的点----------------------------------
def get_ind_under_point(self, event):
'get the index of the vertex under point if within epsilon tolerance'
# 在公差允许的范围内,求出鼠标点下顶点坐标的数值
# x1,y1 and x2,y2对应当前点坐标
xt, yt = np.array(self.x), np.array(self.y) # xt = [x1 , x2 ] yt = [y1 , y2]
d = np.sqrt((xt-event.xdata)**2 + (yt-event.ydata)**2) # 计算鼠标对应点到该点的距离
indseq = np.nonzero(np.equal(d, np.amin(d)))[0] # 找到按下的点并计算点对应的索引
ind = indseq[0] # 把对应点的索引拿出来
# 如果在公差范围内,则返回ind的值
if d[ind] >= self.offset:
ind = None
return ind
''
''
# ---------------动作二:鼠标被按下-----------------------------
# ---------------鼠标被按下,立即计算最近的顶点下标----------------------
def button_press_callback(self, event):
'whenever a mouse button is pressed'
# --------不做处理的情况-----------
if not self.showverts: return
if event.inaxes==None: return
if event.button != 1: return
# --------不做处理的情况-----------
# 把参数传进对象
self._ind = self.get_ind_under_point(event)
print(self._ind)
''
''
# -----------------------动作三:鼠标被释放---------------------------
# ------------------鼠标释放后,清空、重置------------------------
def button_release_callback(self, event):
'whenever a mouse button is released'
# --------不做处理的情况-----------
if not self.showverts: return
if event.button != 1: return
# --------不做处理的情况-----------
self._ind = None # ind恢复None
''
''
# -------------------动作四:鼠标移动----------------------------
# ----------------鼠标移动的事件-------------------
def motion_notify_callback(self, event):
'on mouse movement'
# --------不做处理的情况-----------
if not self.showverts: return
if self._ind is None: return
if event.inaxes is None: return
if event.button != 1: return
# --------不做处理的情况-----------
# 更新数据
x, y = event.xdata, event.ydata
self.x[self._ind] = x
self.y[self._ind] = y
# 根据更新的数值,重新绘制图形
self.line = Line2D(self.x, self.y, linewidth=1, ls="--",
marker='o', markerfacecolor='r',
animated=True)
self.ax.add_line(self.line)
# 恢复背景
self.canvas.restore_region(self.background)
self.ax.draw_artist(self.line)
self.canvas.blit(self.ax.bbox)
# 按NEU坐标系显示
def myplot_NEU(outx, outy, xi, yi):
neux, neuy = gps_LLAtoNEU(outx, outy, outx[0], outy[0])
neuxi, neuyi = gps_LLAtoNEU(xi, yi, outx[0], outy[0])
fig2, ax2 = plt.subplots()
for i in range(len(neux)):
ii = i + 1
ax2.plot(neux[i], neuy[i], 'or')
if i < len(neux):
ax2.text(neux[i] + 0.00001, neuy[i] + 0.00001, str(i), weight="bold", color="k", fontsize=7)
ax2.plot(neuxi, neuyi, '-y')
ax2.plot(neux, neuy, '--r')
plt.show()在上述程序中,把GPS信号从LLA转为NEU用到的程序如下,仿照逐飞函数库写的,内容原理全部一致。
# ---------------经纬度转平面坐标系(LLA--->NEU)------------------------
def gps_LLAtoNEU(a, b, sa, sb):
longitude = a
latitude = b
start_longitude = sa
start_latitude = sb
c = []
d = []
n = len(a)
earth = 6378137 # 地球半径,单位:m
pi = 3.1415926535898
for i in range(n):
now_longitude = longitude[i]
now_latitude = latitude[i]
rad_latitude1 = start_latitude*pi/180
rad_latitude2 = now_latitude*pi/180
rad_longitude1 = start_longitude*pi/180
rad_longitude2 = now_longitude*pi/180
aaa = rad_latitude1 - rad_latitude2
bbb = rad_longitude1 - rad_longitude2
distance = 2*math.asin(math.sqrt(pow(math.sin(aaa/2), 2) + math.cos(rad_latitude1)
* math.cos(rad_latitude2) * pow(math.sin(bbb / 2), 2)))
distance = distance*earth
ccc = math.sin(rad_longitude2 - rad_longitude1) * math.cos(rad_latitude2)
ddd = math.cos(rad_latitude1) * math.sin(rad_latitude2) - math.sin(rad_latitude1) \
* math.cos(rad_latitude2) * math.cos(rad_longitude2 - rad_longitude1)
angle = math.atan2(ccc,ddd)*180/pi
if angle < 0:
angle = angle + 360
angle2 = (450 - angle)*pi/180
px = distance*math.cos(angle2)
py = distance*math.sin(angle2)
c.append(px)
d.append(py)
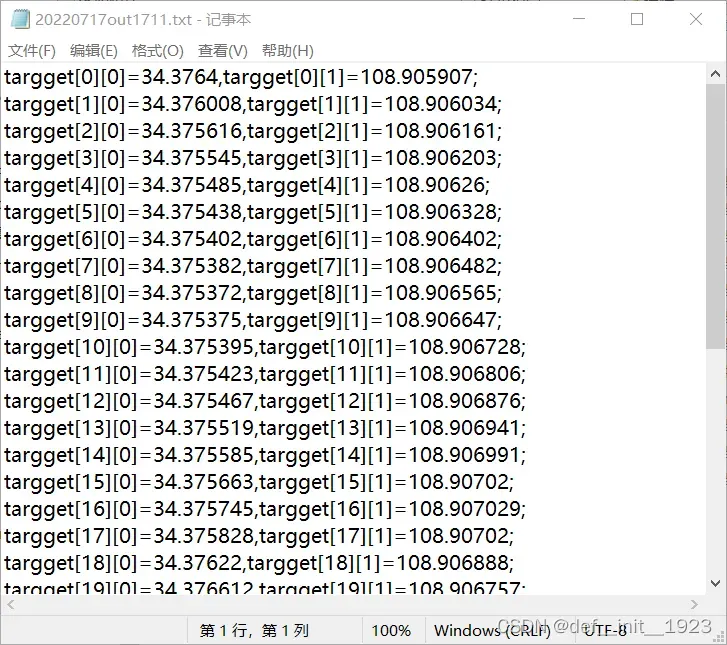
return c, d最后为了方便程序的修改,我还设置了程序输出函数,主要是把程序生成存储到txt文档中,然后修改程序时只需复制一下即可,不用一个一个打字修改,用到的程序如下。
# ---------------生成程序函数-------------------------
def make_code(x, y, your_name):
# -----------save---txt--------------
# 输出限制在小数点后6位
for i in range(len(x)):
x[i] = round(x[i], 6)
y[i] = round(y[i], 6)
n = len(x)
mystr = ''
for i in range(n):
mystr = mystr + 'targget' + '[' + str(i) + ']' + '[0]'
mystr = mystr + '=' + str(y[i]) + ','
mystr = mystr + 'targget' + '[' + str(i) + ']' + '[1]'
mystr = mystr + '=' + str(x[i]) + ';' + '\n'
# print(mystr)
# 看是否需要加点
# for i in range(4):
# mystr = mystr + 'targget' + '[' + str(i+n) + ']' + '[0]'
# mystr = mystr + '=' + str(y[i]) + ','
# mystr = mystr + 'targget' + '[' + str(i+n) + ']' + '[1]'
# mystr = mystr + '=' + str(x[i]) + ';' + '\n'
with open(your_name, "w") as g:
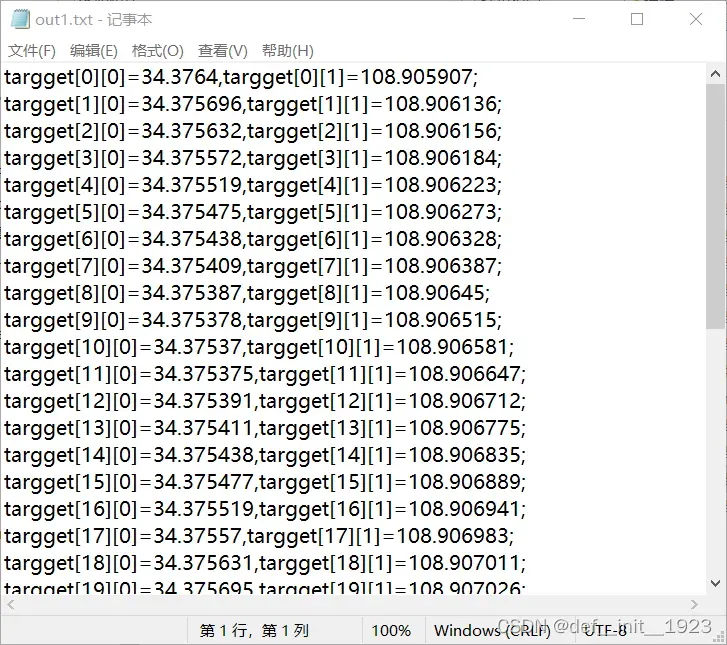
g.write(mystr)输出的txt文档程序内容如下,可根据自己的需求修改输出内容,下面是我们组输出的程序。
相信通过上面的介绍,大家已经对程序的大体框架有了一个清楚的认知。为了方便调试,同时做了一套UI界面,一开始本来想通过PyQt来设计UI界面,但是在尝试把PyQt和matplotlib融合起来时遇到了较多的问题,为了节省时间,故采用easygui来简单做了下UI,以后如果有精力可能会尝试融合一下。
下面附上全部源码,有些地方写的不好,仅供参考。当时设计的时候没有做的更加完善,主要精力还是在调车上面,程序可以修改和完善的地方其实还有很多,如果感兴趣的话可以多添加一些功能,做一些更精美的UI界面,进一步方便调试。其实写完整个程序还是能收获不少知识的,希望有大佬能分享一下自己的看法,一起交流一下。源码下面还会有程序的使用方法讲解。
# -------------------------------
# GPS system
# author:yzh
# version:1.5
# time:2022-7-18
# 2022智能车大赛极速越野组
# 长安大学铺铜人队
# -------------------------------
# ------------------导入库--------------------
import matplotlib.pyplot as plt
from matplotlib.lines import Line2D
from matplotlib.artist import Artist
from matplotlib.patches import Polygon
from scipy import interpolate
import numpy as np
import math
import easygui as g
import sys
import os
# ----------------------------My_function-----------------------------------------------
# ---------------读取函数----------------------
def read_point(file_name):
# 数据存放
data = []
with open(file_name, "r") as f:
for line in f.readlines():
line = line.strip('\n')
line = line.strip()
data.append(line)
# 读出经纬度数据
x = []
y = []
for dd in data:
dt = dd.split(',')
x.append(float(dt[0]))
y.append(float(dt[1]))
return x, y
# ---------------生成程序函数-------------------------
def make_code(x, y, your_name):
# -----------save---txt--------------
# 输出限制在小数点后6位
for i in range(len(x)):
x[i] = round(x[i], 6)
y[i] = round(y[i], 6)
n = len(x)
mystr = ''
for i in range(n):
mystr = mystr + 'targget' + '[' + str(i) + ']' + '[0]'
mystr = mystr + '=' + str(y[i]) + ','
mystr = mystr + 'targget' + '[' + str(i) + ']' + '[1]'
mystr = mystr + '=' + str(x[i]) + ';' + '\n'
# print(mystr)
# 看是否需要加点
# for i in range(4):
# mystr = mystr + 'targget' + '[' + str(i+n) + ']' + '[0]'
# mystr = mystr + '=' + str(y[i]) + ','
# mystr = mystr + 'targget' + '[' + str(i+n) + ']' + '[1]'
# mystr = mystr + '=' + str(x[i]) + ';' + '\n'
with open(your_name, "w") as g:
g.write(mystr)
# ---------------经纬度转平面坐标系(LLA--->NEU)------------------------
def gps_LLAtoNEU(a, b, sa, sb):
longitude = a
latitude = b
start_longitude = sa
start_latitude = sb
c = []
d = []
n = len(a)
earth = 6378137 # 地球半径,单位:m
pi = 3.1415926535898
for i in range(n):
now_longitude = longitude[i]
now_latitude = latitude[i]
rad_latitude1 = start_latitude*pi/180
rad_latitude2 = now_latitude*pi/180
rad_longitude1 = start_longitude*pi/180
rad_longitude2 = now_longitude*pi/180
aaa = rad_latitude1 - rad_latitude2
bbb = rad_longitude1 - rad_longitude2
distance = 2*math.asin(math.sqrt(pow(math.sin(aaa/2), 2) + math.cos(rad_latitude1)
* math.cos(rad_latitude2) * pow(math.sin(bbb / 2), 2)))
distance = distance*earth
ccc = math.sin(rad_longitude2 - rad_longitude1) * math.cos(rad_latitude2)
ddd = math.cos(rad_latitude1) * math.sin(rad_latitude2) - math.sin(rad_latitude1) \
* math.cos(rad_latitude2) * math.cos(rad_longitude2 - rad_longitude1)
angle = math.atan2(ccc,ddd)*180/pi
if angle < 0:
angle = angle + 360
angle2 = (450 - angle)*pi/180
px = distance*math.cos(angle2)
py = distance*math.sin(angle2)
c.append(px)
d.append(py)
return c, d
# --------------------拟合曲线函数----------------------------
def make_curve(x, y):
# list转numpy
use_x = np.array(x)
use_y = np.array(y)
# 去掉重复的点
okay = np.where(np.abs(np.diff(use_x)) + np.abs(np.diff(use_y)) > 0)
use_xx = np.r_[use_x[okay], use_x[-1], use_x[0]]
use_yy = np.r_[use_y[okay], use_y[-1], use_y[0]]
tck, u = interpolate.splprep([use_xx, use_yy], s=0)
# evaluate the spline fits for 1000 evenly spaced distance values
xi, yi = interpolate.splev(np.linspace(0, 1, 1000), tck)
# 返回最终插补的点,这里搞了1000个,可以根据需要修改一下
return xi, yi
# ----------------动态图的类------------------------
class Point_Move:
showverts = True
offset = 0.00001 # 距离偏差设置
def __init__(self, gpsx, gpsy, ox, oy):
# 创建figure(绘制面板)、创建图表(axes)
self.fig, self.ax = plt.subplots()
# 设置标题
self.ax.set_title('Click and drag a point to move it')
# 设置坐标轴范围
self.ax.set_xlim((min(gpsx)-0.0001, max(gpsx)+0.0001))
self.ax.set_ylim((min(gpsy)-0.0001, max(gpsy)+0.0001))
self.ax.plot(ox, oy, '-y')
# 设置初始值
self.x = gpsx
self.y = gpsy
# 绘制2D的动画line
self.line = Line2D(self.x, self.y, linewidth=1, ls="--",
marker='o', markerfacecolor='r',
animated=True)
self.ax.add_line(self.line)
# 标志值设为none
self._ind = None
# 设置画布,方便后续画布响应事件
canvas = self.fig.canvas
canvas.mpl_connect('draw_event', self.draw_callback)
canvas.mpl_connect('button_press_event', self.button_press_callback)
canvas.mpl_connect('button_release_event', self.button_release_callback)
canvas.mpl_connect('motion_notify_event', self.motion_notify_callback)
self.canvas = canvas
plt.grid()
for i in range(len(self.x)):
plt.text(self.x[i] + 0.00001, self.y[i] + 0.00001, str(i), weight="bold", color="k", fontsize=7)
plt.show()
''
''
' -------------------动作一:界面重新绘制------------------------------- '
# 界面重新绘制:draw_event
def draw_callback(self, event):
self.background = self.canvas.copy_from_bbox(self.ax.bbox)
self.ax.draw_artist(self.line)
self.canvas.blit(self.ax.bbox)
''
''
# -------------------函数:识别按下的点----------------------------------
def get_ind_under_point(self, event):
'get the index of the vertex under point if within epsilon tolerance'
# 在公差允许的范围内,求出鼠标点下顶点坐标的数值
# x1,y1 and x2,y2对应当前点坐标
xt, yt = np.array(self.x), np.array(self.y) # xt = [x1 , x2 ] yt = [y1 , y2]
d = np.sqrt((xt-event.xdata)**2 + (yt-event.ydata)**2) # 计算鼠标对应点到该点的距离
indseq = np.nonzero(np.equal(d, np.amin(d)))[0] # 找到按下的点并计算点对应的索引
ind = indseq[0] # 把对应点的索引拿出来
# 如果在公差范围内,则返回ind的值
if d[ind] >= self.offset:
ind = None
return ind
''
''
# ---------------动作二:鼠标被按下-----------------------------
# ---------------鼠标被按下,立即计算最近的顶点下标----------------------
def button_press_callback(self, event):
'whenever a mouse button is pressed'
# --------不做处理的情况-----------
if not self.showverts: return
if event.inaxes==None: return
if event.button != 1: return
# --------不做处理的情况-----------
# 把参数传进对象
self._ind = self.get_ind_under_point(event)
print(self._ind)
''
''
# -----------------------动作三:鼠标被释放---------------------------
# ------------------鼠标释放后,清空、重置------------------------
def button_release_callback(self, event):
'whenever a mouse button is released'
# --------不做处理的情况-----------
if not self.showverts: return
if event.button != 1: return
# --------不做处理的情况-----------
self._ind = None # ind恢复None
''
''
# -------------------动作四:鼠标移动----------------------------
# ----------------鼠标移动的事件-------------------
def motion_notify_callback(self, event):
'on mouse movement'
# --------不做处理的情况-----------
if not self.showverts: return
if self._ind is None: return
if event.inaxes is None: return
if event.button != 1: return
# --------不做处理的情况-----------
# 更新数据
x, y = event.xdata, event.ydata
self.x[self._ind] = x
self.y[self._ind] = y
# 根据更新的数值,重新绘制图形
self.line = Line2D(self.x, self.y, linewidth=1, ls="--",
marker='o', markerfacecolor='r',
animated=True)
self.ax.add_line(self.line)
# 恢复背景
self.canvas.restore_region(self.background)
self.ax.draw_artist(self.line)
self.canvas.blit(self.ax.bbox)
# 按NEU坐标系显示
def myplot_NEU(outx, outy, xi, yi):
neux, neuy = gps_LLAtoNEU(outx, outy, outx[0], outy[0])
neuxi, neuyi = gps_LLAtoNEU(xi, yi, outx[0], outy[0])
fig2, ax2 = plt.subplots()
for i in range(len(neux)):
ii = i + 1
ax2.plot(neux[i], neuy[i], 'or')
if i < len(neux):
ax2.text(neux[i] + 0.00001, neuy[i] + 0.00001, str(i), weight="bold", color="k", fontsize=7)
ax2.plot(neuxi, neuyi, '-y')
ax2.plot(neux, neuy, '--r')
plt.show()
# ----------------------------My_function-----------------------------------------------
if __name__ == "__main__":
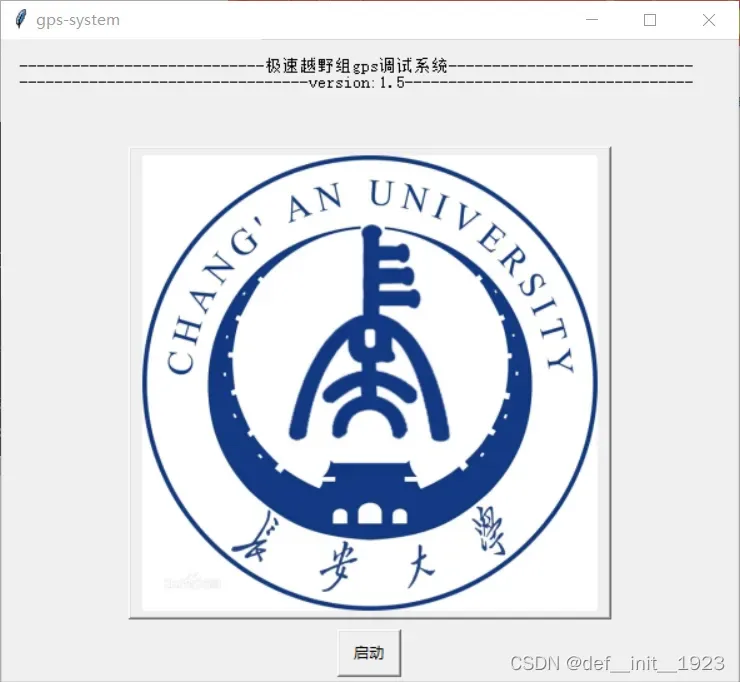
# ---------------欢迎界面----------------
g.msgbox("----------------------------极速越野组gps调试系统----------------------------\n"
"---------------------------------version:1.5---------------------------------",
'gps-system',
'启动', 'CHDlogo.jpg')
# ------------打开启动文件--------------------
setname = ''
while (os.path.exists(setname+'.txt') != True):
setname = g.enterbox("请输入采取的gps文件:", 'gps-system', 'new4道')
if setname == None:
setname = ''
else:
if os.path.exists(setname+'.txt') != True:
g.msgbox("请确定你的路径下是否有该配置文件!!!", "gps-system")
# 读点
x, y = read_point(setname + ".txt")
print("x=", x)
print("y=", y)
xi, yi = make_curve(x, y)
outname = None
# ------------------自定义:分段,然后均匀地取点-------------------------------
outx = []
outy = []
outx.append(x[0])
outy.append(y[0])
for i in range(1000):
ii = i + 1
if ii <= 180:
if ii % 180 == 0:
outx.append(xi[i])
outy.append(yi[i])
if ii > 180 and ii <= 510:
if (ii - 180) % 16 == 0:
outx.append(xi[i])
outy.append(yi[i])
if ii > 510 and ii <= 690:
if (ii - 510) % 180 == 0:
outx.append(xi[i])
outy.append(yi[i])
if ii > 690 and ii <= 1000:
if (ii - 690) % 20 == 0:
outx.append(xi[i])
outy.append(yi[i])
print(outx)
print(outy)
outx.pop()
outy.pop()
# 预留部分(手动修改区)
# -----------1------------------
# dx = outx[2] - outx[0]
# dy = outy[2] - outy[0]
# outx[1] = outx[0] + dx / 2
# outy[1] = outy[0] + dy / 2
# dx = outx[19] - outx[17]
# dy = outy[19] - outy[17]
# outx[18] = outx[17] + dx / 2
# outy[18] = outy[17] + dy / 2
# outx[] =
# outx[] =
# outx[] =
# 修改前自己先查看一下点的分布情况,不行直接停止程序再改
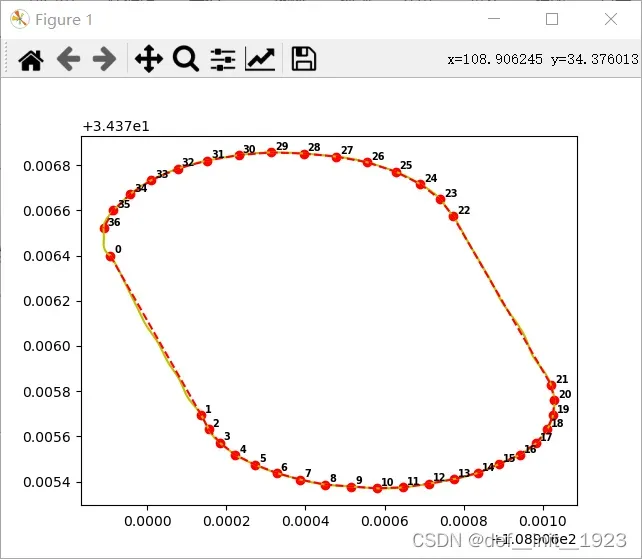
fig1, ax1 = plt.subplots()
for i in range(len(outx)):
ii = i + 1
ax1.plot(outx[i], outy[i], 'or')
if i < len(outx):
ax1.text(outx[i] + 0.00001, outy[i] + 0.00001, str(i), weight="bold", color="k", fontsize=7)
ax1.plot(xi, yi, '-y')
ax1.plot(outx, outy, '--r')
plt.show()
# NEU坐标系下查看
# myplot_NEU(outx, outy, xi, yi)
# --------------------------取点完成------------------------------
# 删除最后的起点
# outx.pop()
# outy.pop()
print(outx)
print(outy)
# 这里复制一份留着复位使用
routx = outx.copy()
routy = outy.copy()
# 调用可调plot类
mygps = Point_Move(outx, outy, xi, yi)
finalx = mygps.x
finaly = mygps.y
# print(finalx)
# print(finaly)
# print(id(outx))
# print(id(mygps.x))
# print(id(finalx))
# print(id(routx))
while True:
msg ="请选择你的操作"
title = "gps-system"
choices = ["输出代码", "继续调整轨迹", "轨迹复位", "NEU坐标系下查看点", "退出系统"]
choice = g.choicebox(msg, title, choices)
if choice == '输出代码':
# g.msgbox("你的选择是: " + str(choice), "gps-system")
outname = g.enterbox("请输入生成文件名:", 'gps-system', 'out1')
if outname != None:
make_code(finalx, finaly, outname + '.txt')
g.msgbox('成功生成代码,请在当前文件夹下查看', "gps-system")
if choice == '继续调整轨迹':
# g.msgbox("你的选择是: " + str(choice), "gps-system")
mygps.__init__(outx, outy, xi, yi)
if choice == '轨迹复位':
# g.msgbox("你的选择是: " + str(choice), "gps-system")
outx = routx.copy()
outy = routy.copy()
mygps.__init__(outx, outy, xi, yi)
if choice == '退出系统':
msg = "退出系统吗?"
title = "gps-system"
# 弹出一个Continue/Cancel对话框
if g.ccbox(msg, title, ('继续操作', '退出')):
pass # 如果继续操作
else:
sys.exit(0) # 如果退出
if choice == 'NEU坐标系下查看点':
myplot_NEU(outx, outy, xi, yi)
最后我们来看一下整体的操作流程。
1.运行程序
弹出初始窗口,点击启动。
2.输入你的配置文件名称(无需输入.txt,只输入前面的名称就行)
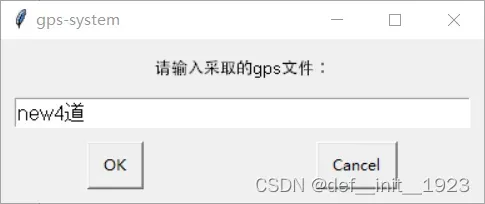
3.图像初始绘制,先看看配置文件有没有问题,没有问题点击关闭进行下一步。
4.弹出交互界面,可以拖拽点位进行修改。
5.拖拽完成后点击关闭,出现此弹窗,用来选择下一步操作。
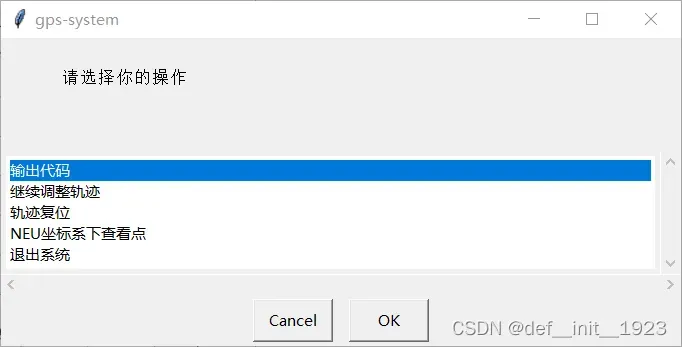
一共有五个选择,输出代码、继续调整轨迹、轨迹复位、NEU坐标系下查看点、退出系统。
点击输出代码,出现此弹窗。输入输出txt的文件名称。(无需输入.txt,只输入前面的名称就行)
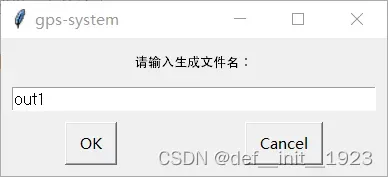
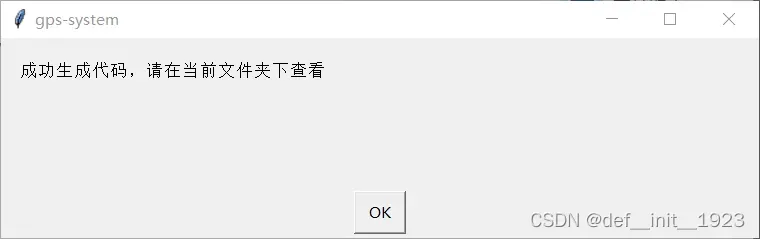
点击OK,成功生成代码,在当前文件夹下可以查看。
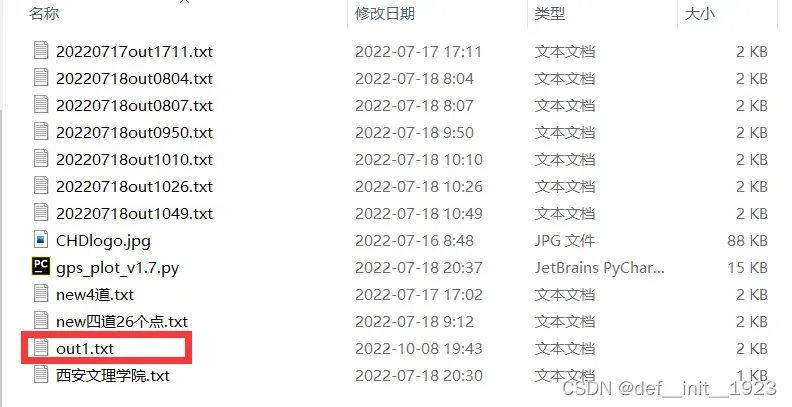
程序出现在txt文档中。
点击继续调整轨迹,交互窗口会再次出现,可以进行进一步调整。(之前的操作都会被保留)

点击轨迹复位可以清除之前的操作,然后再弹出交互窗口进行修改。
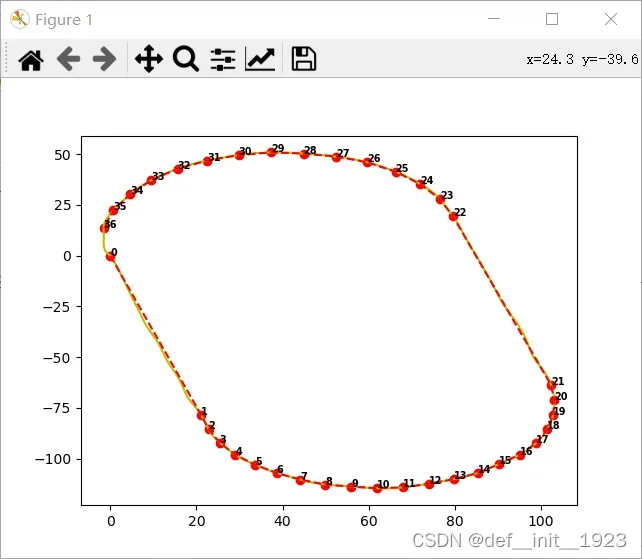
点击在NEU坐标系下查看点,就生成预览图,主要是看下距离合不合适,这个不是交互的。。。
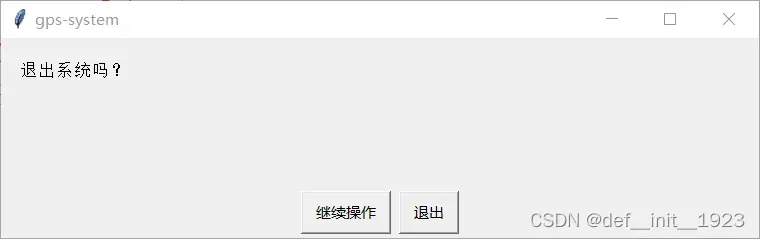
点击退出系统,再点击退出即可,如果误触可以点击继续操作。
—————————请接着看完,比较关键的地方——————————————
在不同的航段你可能想设置不同数量的点,程序中有这么一段代码。
    # ------------------自定义:分段,然后均匀地取点-------------------------------
    outx = []
    outy = []

    outx.append(x[0])
    outy.append(y[0])
    for i in range(1000):
        ii = i + 1
        if ii <= 180:
            if ii % 180 == 0:
                outx.append(xi[i])
                outy.append(yi[i])
        if ii > 180 and ii <= 510:
            if (ii - 180) % 16 == 0:
                outx.append(xi[i])
                outy.append(yi[i])
        if ii > 510 and ii <= 690:
            if (ii - 510) % 180 == 0:
                outx.append(xi[i])
                outy.append(yi[i])
        if ii > 690 and ii <= 1000:
            if (ii - 690) % 20 == 0:
                outx.append(xi[i])
                outy.append(yi[i])
主要是通过自己的修改来给不同的航段取不同数量的点,我们发现直线段取较少的点即可,弯道段取较多的点可以让转弯时轨迹更加的平滑。这部分通过自己的需求进行修改,需要懂一些Python的基础知识。
以上就是这个方案的全部内容了,希望能够帮助到大家,谢谢。。。。。。。
文章出处登录后可见!