相关资料:
- 原文
- 原文解析
- mxnet版本的数据分析
- mxnet版本的代码解读
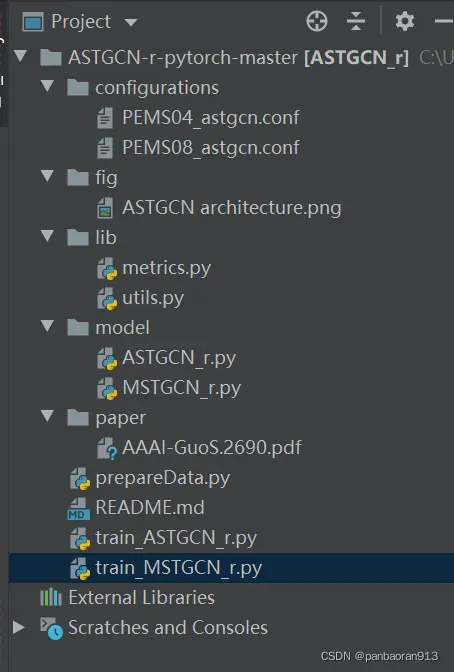
一、目录
二、configparser和argparse
不了解的和遇见参数 读取报错的:见博文《【configparser】参数读取》 和 《【argparse】参数配置》
configurations
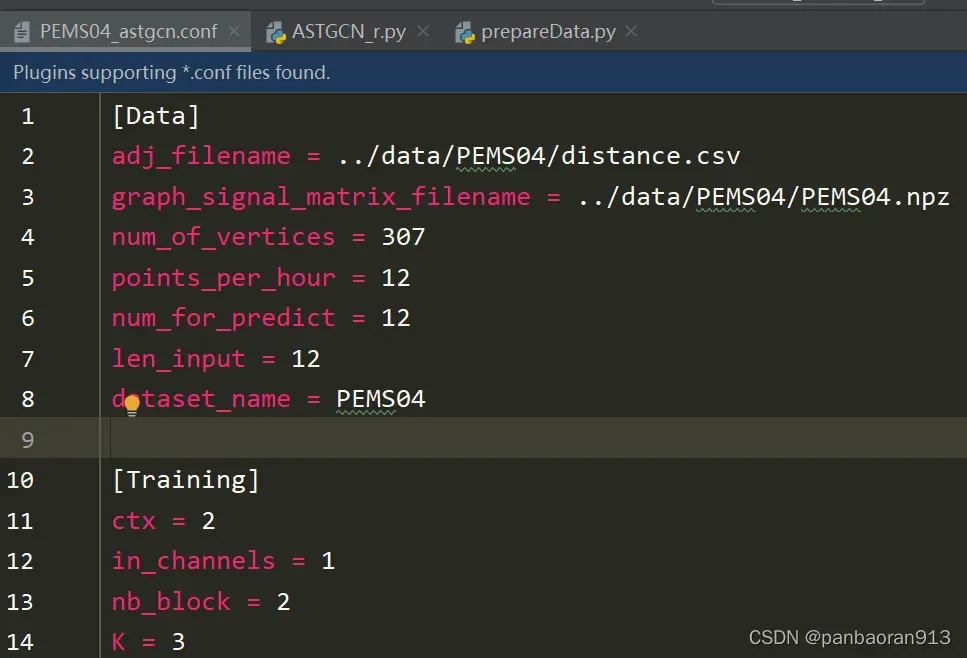
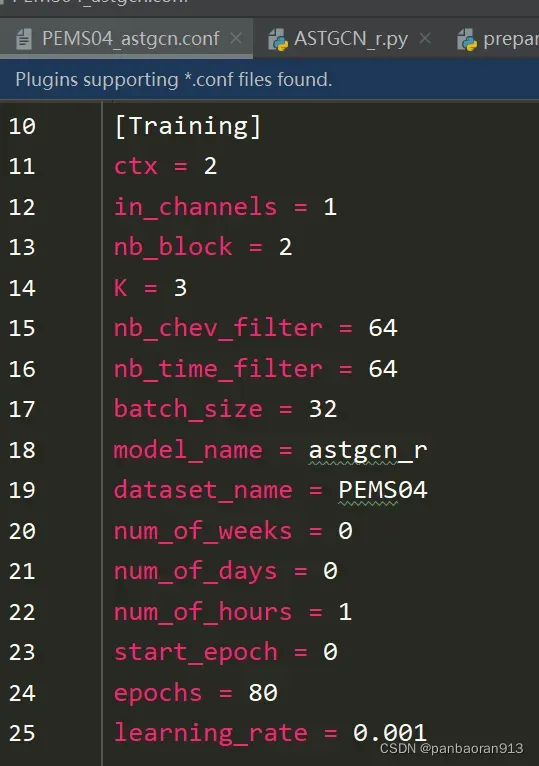
PEMS04_astgcn.conf的内容展示
三、prepareData.py文件
该文件是进行参数读取和数据预处理的.
导入库
import os
import numpy as np
import argparse
import configparser
3.1 参数读入
- argparse的使用方法(见链接)
- configparser的使用方法(见链接)
- 代码
# prepare dataset
parser = argparse.ArgumentParser()
parser.add_argument("--config", default='configurations/PEMS08_astgcn.conf', type=str,
                    help="configuration file path")
args = parser.parse_args()
config = configparser.ConfigParser()
print('Read configuration file: %s' % (args.config))
config.read(args.config)
data_config = config['Data']
training_config = config['Training']

adj_filename = data_config['adj_filename']
graph_signal_matrix_filename = data_config['graph_signal_matrix_filename']

## id_filename如果在config["Date"]中有这个变量,则读取,否则设为None
if config.has_option('Data', 'id_filename'):
    id_filename = data_config['id_filename']
else:
    id_filename = None


num_of_vertices = int(data_config['num_of_vertices'])
points_per_hour = int(data_config['points_per_hour'])
num_for_predict = int(data_config['num_for_predict'])
len_input = int(data_config['len_input'])
dataset_name = data_config['dataset_name']
num_of_weeks = int(training_config['num_of_weeks'])
num_of_days = int(training_config['num_of_days'])
num_of_hours = int(training_config['num_of_hours'])
3.2 变量解析
- 应用到模型中的变量对照表
| 代码变量 | 含义解析 | 原文变量 | 举例 |
|---|---|---|---|
| num_of_vertices | 网络中顶点个数 | 170 | |
| points_per_hour | 每个小时中观察的时间点个数 | 12 | |
| num_for_predict | 预测未来多少个时间点结果 | 12 | |
| len_input | 12 | ||
| num_of_weeks | 0 | ||
| num_of_days | 0 | ||
| num_of_hours | 1 |
- 应用到模型控制的变量对照表
| 代码变量 | 默认值 | 含义解析 | 作用 |
|---|---|---|---|
| args.config | 有 | 文件路径 | 用于读取模型参数的路径 |
| config | configparser实例化并读取参数后 | 里面包含了两个节,节中包含大量变量 | |
| data_config | config[“Data”] | 表示config中节[“Data”] (里面包含众多变量) | |
| training_config | config[“Training”] | 表示config中节[“Training”] (里面包含众多变量) | |
| adj_file | 文件路径 | 用于读取邻接矩阵 | |
| graph_signal_matrix_filename | 文件路径 | 用于读取图信号矩阵 | |
| dataset_name | 数据集名称 |
四、函数read_and_generate_dataset
- 读取数据的代码
all_data = read_and_generate_dataset(graph_signal_matrix_filename, 0, 0, num_of_hours, num_for_predict, points_per_hour=points_per_hour, save=True)
- 函数定义
def read_and_generate_dataset(graph_signal_matrix_filename,
num_of_weeks, num_of_days,
num_of_hours, num_for_predict,
points_per_hour=12, save=False):
'''
Parameters
----------
graph_signal_matrix_filename: str, path of graph signal matrix file
num_of_weeks, num_of_days, num_of_hours: int
num_for_predict: int
points_per_hour: int, default 12, depends on data
Returns
----------
feature: np.ndarray,
shape is (num_of_samples, num_of_depend * points_per_hour,
num_of_vertices, num_of_features)
target: np.ndarray,
shape is (num_of_samples, num_of_vertices, num_for_predict)
'''
#######数据读入#####见注释1######
data_seq = np.load(graph_signal_matrix_filename)['data'] # (sequence_length, num_of_vertices, num_of_features)
# 当PEMS08时,=(17856, 170, 3)
#######构造滑动窗口######见注释2###########
all_samples = []
for idx in range(data_seq.shape[0]):
sample = get_sample_indices(data_seq, num_of_weeks, num_of_days,
num_of_hours, idx, num_for_predict,
points_per_hour)
### 这里的idx对应的label_start_idx
if ((sample[0] is None) and (sample[1] is None) and (sample[2] is None)):
continue
week_sample, day_sample, hour_sample, target = sample
sample = [] # [(week_sample),(day_sample),(hour_sample),target,time_sample]
if num_of_weeks > 0:
week_sample = np.expand_dims(week_sample, axis=0).transpose((0, 2, 3, 1)) # (1,N,F,T)
sample.append(week_sample)
if num_of_days > 0:
day_sample = np.expand_dims(day_sample, axis=0).transpose((0, 2, 3, 1)) # (1,N,F,T)
sample.append(day_sample)
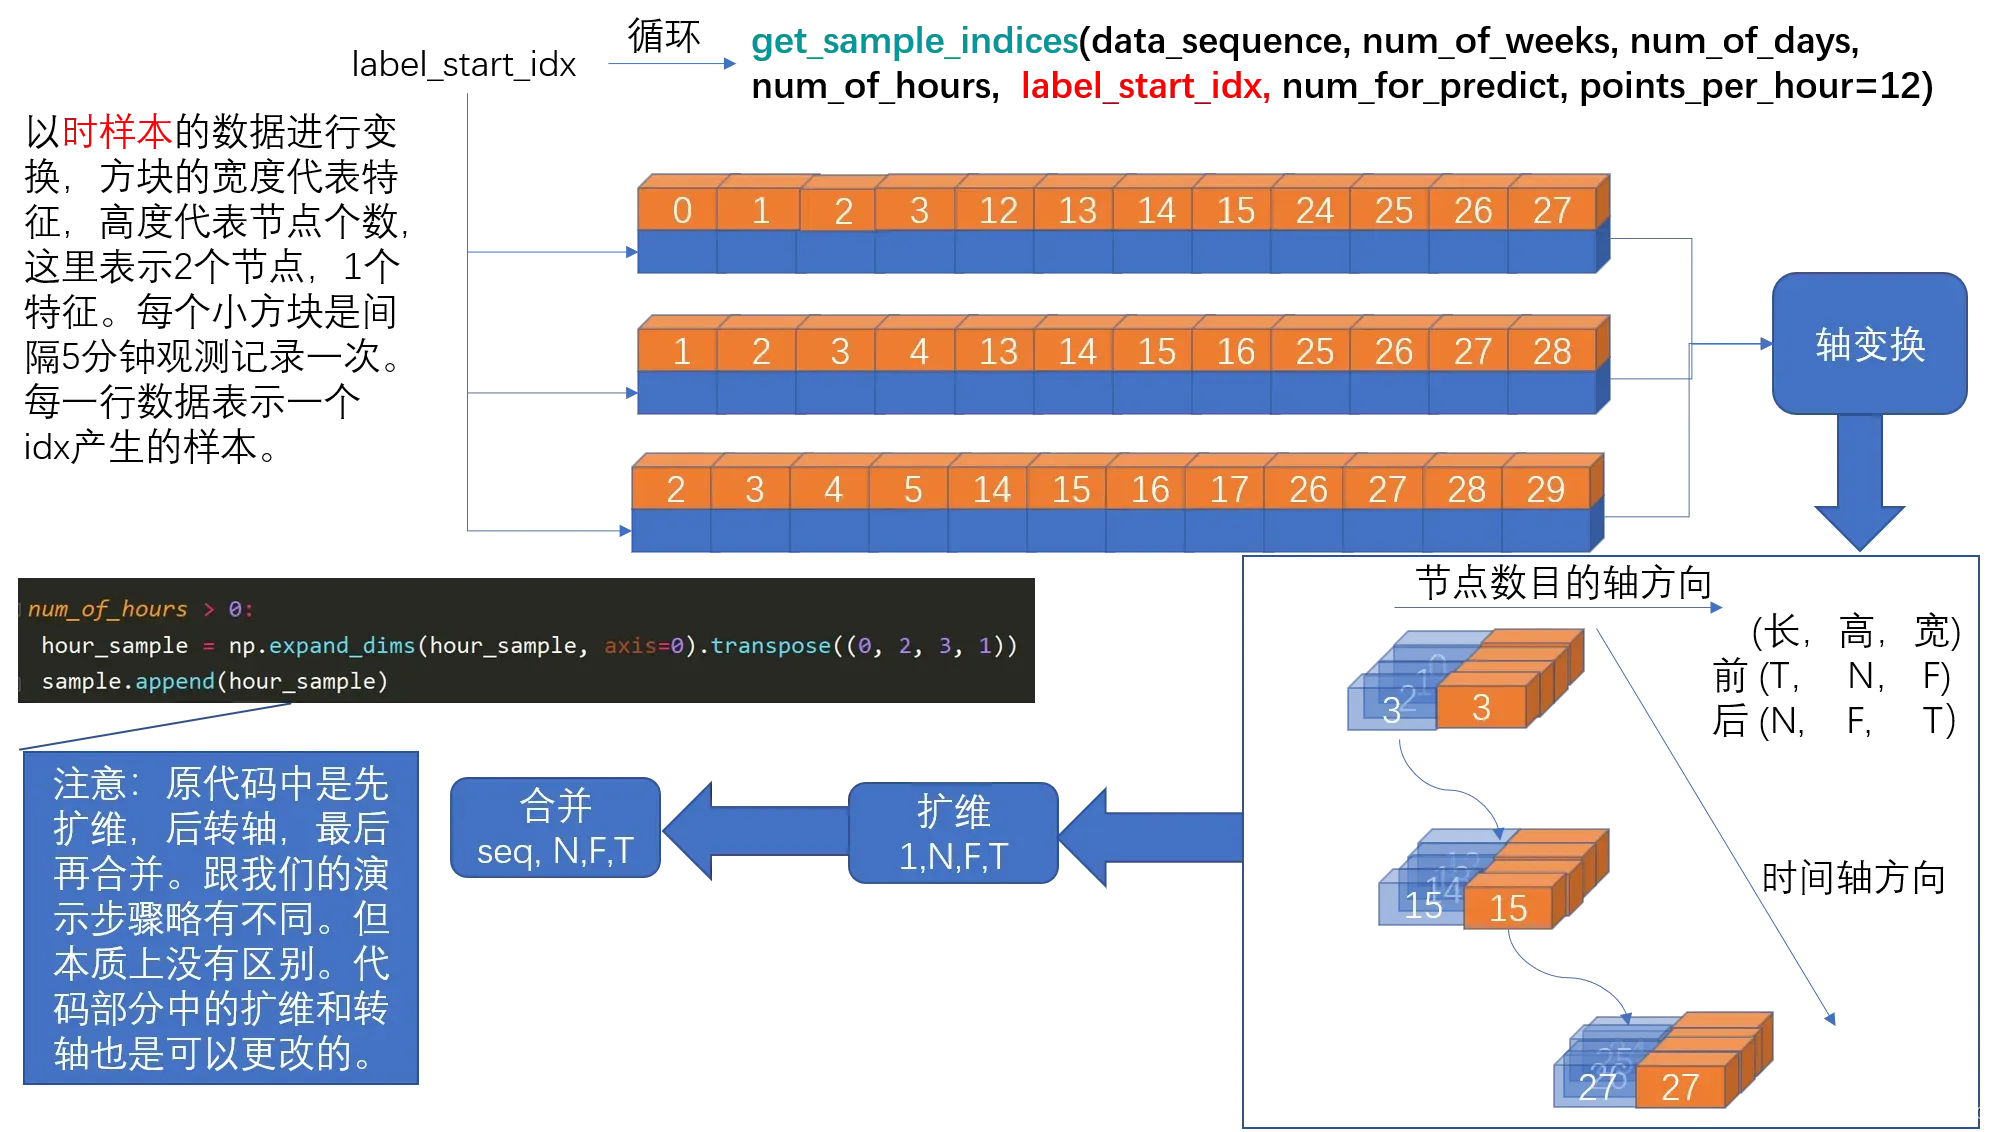
if num_of_hours > 0:
hour_sample = np.expand_dims(hour_sample, axis=0).transpose((0, 2, 3, 1)) # (1,N,F,T)
sample.append(hour_sample)
target = np.expand_dims(target, axis=0).transpose((0, 2, 3, 1))[:, :, 0, :] # (1,N,T)
sample.append(target)
time_sample = np.expand_dims(np.array([idx]), axis=0) # (1,1)
sample.append(time_sample)
all_samples.append(
sample)
# sampe:[(week_sample),(day_sample),(hour_sample),target,time_sample] = [(1,N,F,Tw),(1,N,F,Td),(1,N,F,Th),(1,N,Tpre),(1,1)]
#####构造train\val\test数据########
split_line1 = int(len(all_samples) * 0.6) # 数据分割线
split_line2 = int(len(all_samples) * 0.8) # 数据分割线
training_set = [np.concatenate(i, axis=0)
for i in zip(*all_samples[:split_line1])] # [(B,N,F,Tw),(B,N,F,Td),(B,N,F,Th),(B,N,Tpre),(B,1)]
validation_set = [np.concatenate(i, axis=0)
for i in zip(*all_samples[split_line1: split_line2])]
testing_set = [np.concatenate(i, axis=0)
for i in zip(*all_samples[split_line2:])]
train_x = np.concatenate(training_set[:-2], axis=-1) # (B,N,F,T')
val_x = np.concatenate(validation_set[:-2], axis=-1)
test_x = np.concatenate(testing_set[:-2], axis=-1)
train_target = training_set[-2] # (B,N,T)
val_target = validation_set[-2]
test_target = testing_set[-2]
train_timestamp = training_set[-1] # (B,1)
val_timestamp = validation_set[-1]
test_timestamp = testing_set[-1]
########数据归一化#######见section7####
(stats, train_x_norm, val_x_norm, test_x_norm) = normalization(train_x, val_x, test_x)
######查看数据类型######
all_data = {
'train': {
'x': train_x_norm,
'target': train_target,
'timestamp': train_timestamp,
},
'val': {
'x': val_x_norm,
'target': val_target,
'timestamp': val_timestamp,
},
'test': {
'x': test_x_norm,
'target': test_target,
'timestamp': test_timestamp,
},
'stats': {
'_mean': stats['_mean'],
'_std': stats['_std'],
}
}
print('train x:', all_data['train']['x'].shape)
print('train target:', all_data['train']['target'].shape)
print('train timestamp:', all_data['train']['timestamp'].shape)
print()
print('val x:', all_data['val']['x'].shape)
print('val target:', all_data['val']['target'].shape)
print('val timestamp:', all_data['val']['timestamp'].shape)
print()
print('test x:', all_data['test']['x'].shape)
print('test target:', all_data['test']['target'].shape)
print('test timestamp:', all_data['test']['timestamp'].shape)
print()
print('train data _mean :', stats['_mean'].shape, stats['_mean'])
print('train data _std :', stats['_std'].shape, stats['_std'])
######数据保存#####
if save:
file = os.path.basename(graph_signal_matrix_filename).split('.')[0]
dirpath = os.path.dirname(graph_signal_matrix_filename)
filename = os.path.join(dirpath, file + '_r' + str(num_of_hours) + '_d' + str(num_of_days) + '_w' + str(num_of_weeks)) + '_astcgn'
print('save file:', filename)
np.savez_compressed(filename,
train_x=all_data['train']['x'], train_target=all_data['train']['target'],
train_timestamp=all_data['train']['timestamp'],
val_x=all_data['val']['x'], val_target=all_data['val']['target'],
val_timestamp=all_data['val']['timestamp'],
test_x=all_data['test']['x'], test_target=all_data['test']['target'],
test_timestamp=all_data['test']['timestamp'],
mean=all_data['stats']['_mean'], std=all_data['stats']['_std']
)
return all_data
函数解析:
注释1:数据读入
np.load(graph_signal_matrix_filename)['data'] :读取data数据
读取的是.npz文件的时候,通常里面至少包含一个array 数组。
1. 查看里面包含几个数组内容的方法:
  data = np.load(graph_signal_matrix_filename)
  print(data.files)
out:['data']
包含一个数组,该数组名为"data"
2. 取出数组的方法
data["data"]
3. data_seq.shape为(17856, 170, 3)当PEMS08的时候,分别表示(序列长度,顶点个数,顶点的特征个数)。提醒:这里的序列长度,其实时按照时间顺序排列的。
注释二:生成滑动窗口
伪代码

读完原理图,可以阅读section 5,section6.
A. 原理图
利用滑动窗口生成新序列的原理图。右侧顶部是一个连续时间的序列,滑动窗口设为4,当窗口每走一步(也可能走unit步后)获得一个“窗口数据”,直到最后一个窗口。将所有的“窗口数据”在axis=0轴合并成为一个新的数据。(见左图)
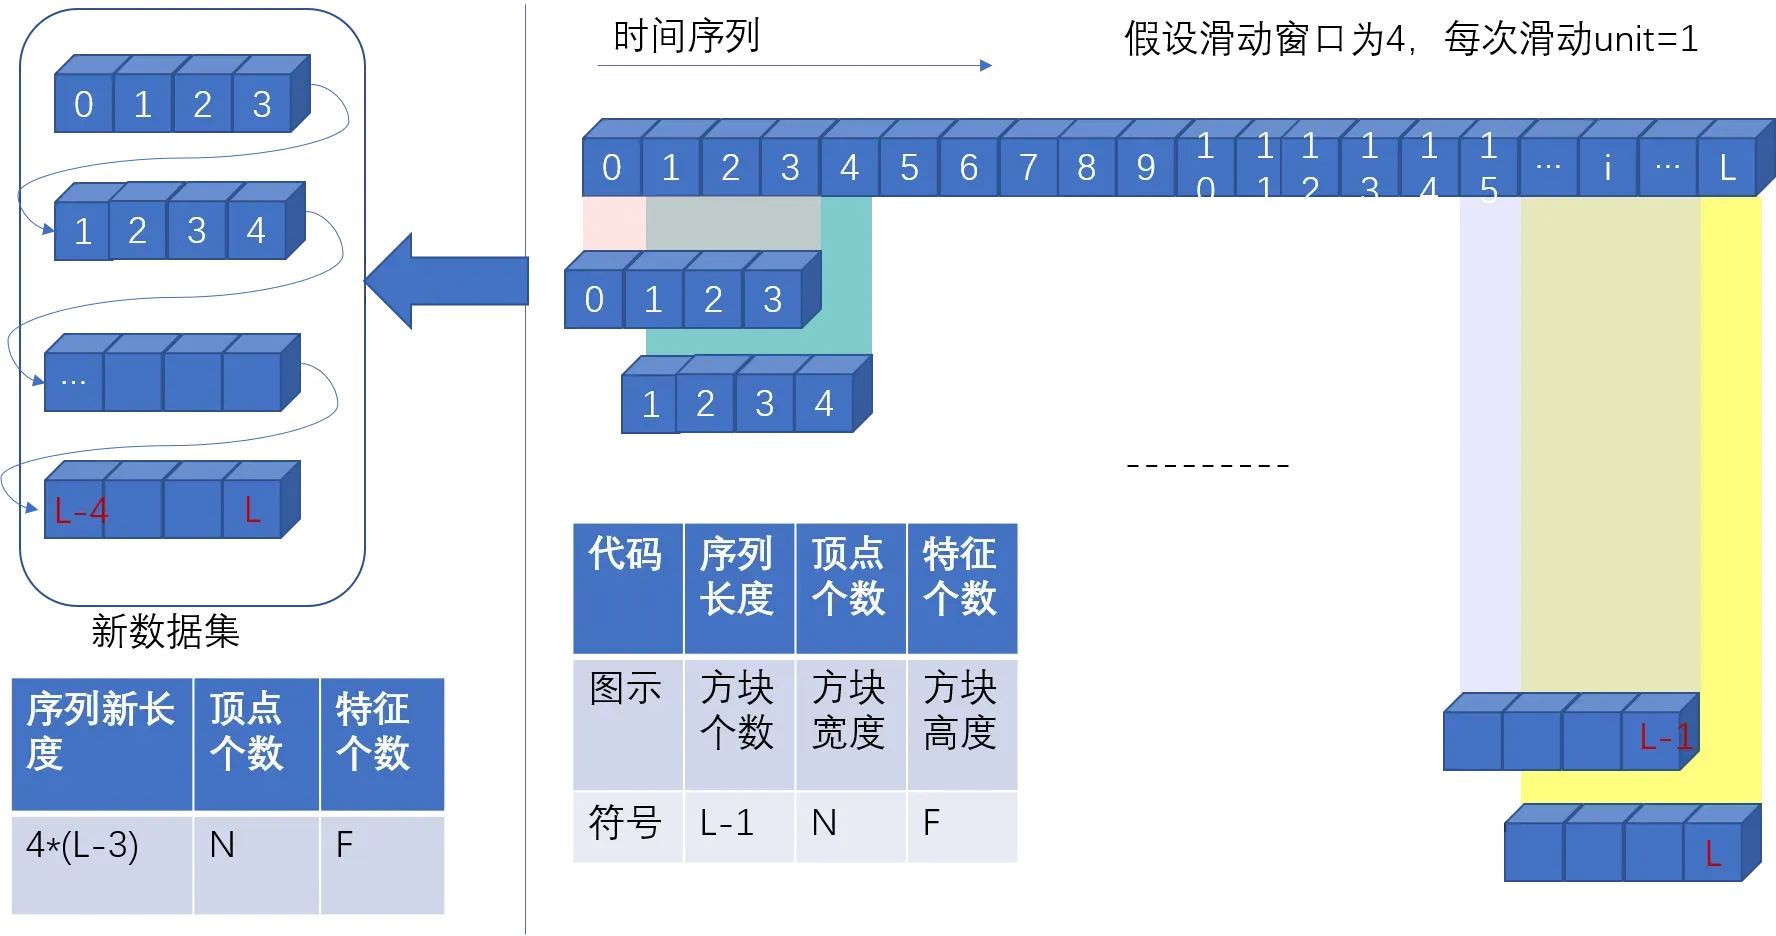
- 调用函数
get_sample_indices获得week,day,hour,target的样本切片,函数解析见section 5. 切片的shape=(序列某长度,顶点个数,特征个数) - 对
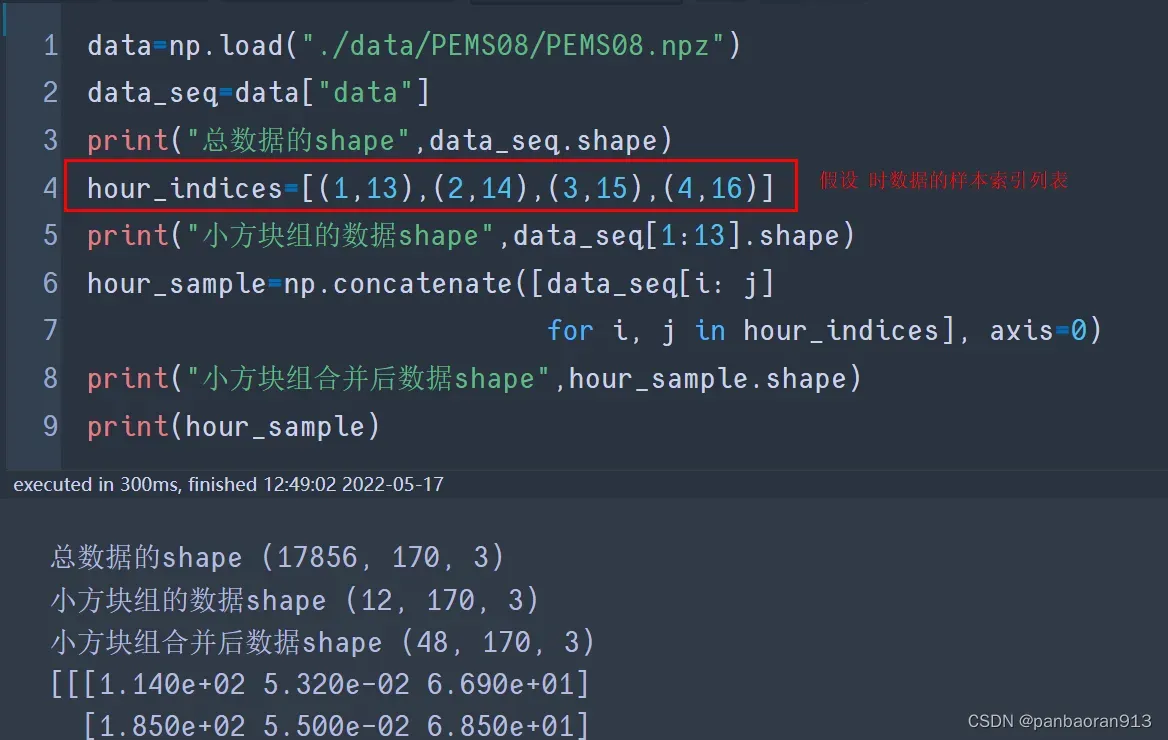
B.数据合成演示图
注释三:构造train\val\test数据
- split_line1
五、 函数get_sample_indices
在本函数中,可以获得周样本数据,日样本数据,时样本数据。在本函数中,首先按照原理图的思想,获得小方块组的索引列表(这一步见section 6 函数search_data),之后再通过 np.concatenate进行数据合并,获得最终的样本。
最终样本的shape=(窗口大小 小方块组的个数,顶点个数,特征个数)
以时样本为例,进行说明
def get_sample_indices(data_sequence, num_of_weeks, num_of_days, num_of_hours,
                       label_start_idx, num_for_predict, points_per_hour=12):
    '''
    Parameters
    ----------
    data_sequence: np.ndarray
                   shape is (sequence_length, num_of_vertices, num_of_features)输入数据,形状为(序列长度,顶点个数,特征个数)
    num_of_weeks, num_of_days, num_of_hours: int
    label_start_idx: int, the first index of predicting target, 预测值开始的那个点==用于训练的数据长度
    num_for_predict: int,
                     the number of points will be predicted for each sample 标签中的滑动窗口大小==预测的数据长度(或说预测几个小方块)
    points_per_hour: int, default 12, number of points per hour每小时分为12个阶段,每间隔5分钟记录一次数据。或着说两个小方块的时间距离为5分钟。
    Returns
    ----------
    week_sample: np.ndarray周样本
                 shape is (num_of_weeks * points_per_hour,
                           num_of_vertices, num_of_features)
    day_sample: np.ndarray日样本
                 shape is (num_of_days * points_per_hour,
                           num_of_vertices, num_of_features)
    hour_sample: np.ndarray时样本
                 shape is (num_of_hours * points_per_hour,
                           num_of_vertices, num_of_features)
    target: np.ndarray 标签样本
            shape is (num_for_predict, num_of_vertices, num_of_features)
    '''
    week_sample, day_sample, hour_sample = None, None, None

### 如果选择的数据长度label_start_idx加上用于预测的长度num_for_predict超过了总的数据长度data_sequence.shape[0],无意义返回None.
    if label_start_idx + num_for_predict > data_sequence.shape[0]:
        return week_sample, day_sample, hour_sample, None
### 获得周数据样本的索引###见section 6#####
    if num_of_weeks > 0:
        week_indices = search_data(data_sequence.shape[0], num_of_weeks,
                                   label_start_idx, num_for_predict,
                                   7 * 24, points_per_hour)
        #### 周样本的unit=7*24=168,滑动窗口的每隔unit取一次数值。
        #### 周样本的索引类似【(1,12),(169,181),...】
        if not week_indices:
            return None, None, None, None
        ##np.concatenate合并数组,默认axis=0
        week_sample = np.concatenate([data_sequence[i: j]
                                      for i, j in week_indices], axis=0)
####获得日样本数据####见section 6####
    if num_of_days > 0:
        day_indices = search_data(data_sequence.shape[0], num_of_days,
                                  label_start_idx, num_for_predict,
                                  24, points_per_hour)
        ####日样本的uint =24,滑动窗口的每隔unit取一次数值。
        ####日样本的索引类似于【(1,13),(25,37),(49,61),...】
        if not day_indices:
            return None, None, None, None

        day_sample = np.concatenate([data_sequence[i: j]
                                     for i, j in day_indices], axis=0)
####获得时样本数据####见section 6####
    if num_of_hours > 0:
        hour_indices = search_data(data_sequence.shape[0], num_of_hours,
                                   label_start_idx, num_for_predict,
                                   1, points_per_hour)
        ####时样本的uint =1,滑动窗口的每隔unit取一次数值。
        ####时样本的索引类似于【(1,13),(2,14),(3,15),....】
        if not hour_indices:
            return None, None, None, None

        hour_sample = np.concatenate([data_sequence[i: j]
                                      for i, j in hour_indices], axis=0)

    target = data_sequence[label_start_idx: label_start_idx + num_for_predict]

    return week_sample, day_sample, hour_sample, target
六、函数search_data
在这个函数中获取每个窗口(滑动生成的)索引的首尾,假设在原理图中获得新数据的shape=(20,4,170,3),表示获得20个窗口,每个窗口的范围为4.也就是如原理图中所展示的具有20个小方块组(4个为一组),该函数返回的是每个小方块组的第一个和最后一个的索引的组合序列。
重要提醒:
- 在原理图中,我们使窗口每次滑动一步,在本函数中我们使窗口每次滑动
points_per_hour * units个步伐. - 在原理图中,我们的窗口大小假设为4(方便作图),在本函数中窗口大小固定为
points_per_hour,在本文中普遍默认为12. - 在原理图中,我们的窗口滑动是沿时间轴的方向移动的,而在本函数中窗口时逆时间轴的方向移动的。当滑动窗口的起始索引start_idx<序列的开始索引0时,滑动停止。
- 在返回索引时,通过逆取值的方式获得从小到大的正序索引
- 返回的是一个索引组的序列。例如【(1,13),(2,14),(3,15),…】或着【(1,13),(25,37),(49,61),…】
def search_data(sequence_length, num_of_depend, label_start_idx,
                num_for_predict, units, points_per_hour):
    '''
    Parameters
    ----------
    sequence_length: int, length of all history data序列的长度
    num_of_depend: int,
    label_start_idx: int, the first index of predicting target
    num_for_predict: int, the number of points will be predicted for each sample
    units: int, week: 7 * 24, day: 24, recent(hour): 1
    points_per_hour: int, number of points per hour, depends on data
    Returns
    ----------
    list[(start_idx, end_idx)]
    '''
 ######每个小时的观测次数应该大于0,则否弹出 值错误
    if points_per_hour < 0:
        raise ValueError("points_per_hour should be greater than 0!")
########被滑动的时间序列>滑动窗口的范围,否则返回 None
    if label_start_idx + num_for_predict > sequence_length:
        return None
######排除上面的意外后,获取每个滑动窗口的索引#########
    x_idx = []
    for i in range(1, num_of_depend + 1):
        start_idx = label_start_idx - points_per_hour * units * i
        end_idx = start_idx + num_for_predict
        if start_idx >= 0:
            x_idx.append((start_idx, end_idx))
        else:
            return None

    if len(x_idx) != num_of_depend:
        return None

    return x_idx[::-1]
七、 函数normalization
对样本train,val,test的数据进行标准化。标准化的方法: 减均值除以标准差。
def normalization(train, val, test):
    '''
    Parameters
    ----------
    train, val, test: np.ndarray (B,N,F,T)
    Returns
    ----------
    stats: dict, two keys: mean and std
    train_norm, val_norm, test_norm: np.ndarray,
                                     shape is the same as original
    '''
    assert train.shape[1:] == val.shape[1:] and val.shape[1:] == test.shape[1:]  # ensure the num of nodes is the same
    mean = train.mean(axis=(0,1,3), keepdims=True)
    std = train.std(axis=(0,1,3), keepdims=True)
    print('mean.shape:',mean.shape)
    print('std.shape:',std.shape)

    def normalize(x):
        return (x - mean) / std

    train_norm = normalize(train)
    val_norm = normalize(val)
    test_norm = normalize(test)

    return {'_mean': mean, '_std': std}, train_norm, val_norm, test_norm
文章出处登录后可见!