目录
1 heartpy介绍
该库提供了处理以下几种信号的方法:来自智能手表和智能手环的常规PPG信号和常规(或含噪)ECG信号,具体可查看文档,文档地址
安装方法:
pip install heartpy
HeartPy V1.2 has landed! The structure of the package has been reworked to be in separate modules now in preparation of the next big update, which will feature many analysis expansions and the first steps towards a GUI for HeartPy. HeartPy has been growing steadily and had reached the point where it became cluttered and unwieldy to keep in a single file. The API remains unchanged.
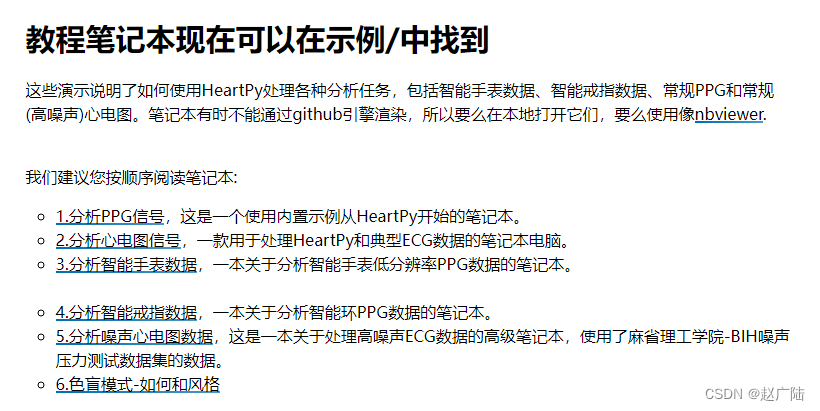
An ‘Examples’ folder has been added to the repo which will be expanded soon. Now there’s two notebooks explaining how to analyse ppg signals from smartwatches and smart rings.
Colorblind support has been added, see this notebook in the examples folder
文档中有很多案例和使用课程
翻译有点太直了什么笔记本笔记本电脑…
2 使用Pands读取数据
2.1 数据说明
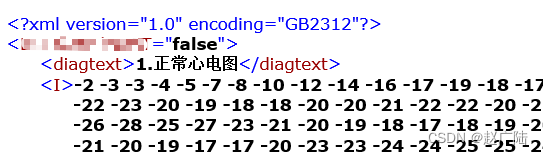
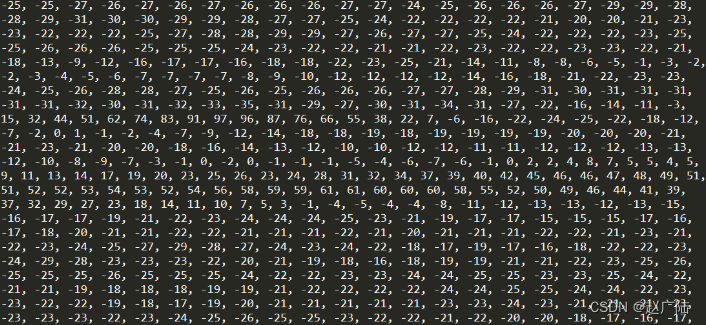
xml为各个心电厂商的心电文件,为了不泄露信息,只展示电信号振幅数据,网上找了一些案例数据,因为画波形不是很难
用浏览器打开是这个样子。
我们调用Python中的LXML库来解析,文件操作用OS和GLOB库。
from lxml import etree#导入lxml库
import os
import glob
path = 'D:\ECG' #设置路径
path_list = os.listdir(path) #获取目录中的内容
path_list.sort(key=lambda x:int(x.split('.')[0])) #整理文件数据及类型
path_file_number = glob.glob('D:\ECG\*.xml') #获取此路径下的所有XML文件并返回一个List
local = 0
sj = open(os.path.join(path,path_list[local]),'rb') #从第一个开始打开文件
tree = etree.parse(sj) #将xml解析为树结构
root = tree.getroot() #获得该树的树根
由于存储的心电数据是基于临床十二导联记录下来的,故XML文件里会有12个类似于,…,这样的12个节点,我们仅需对这12个节点做操作即可,开头的节点删去。
for child in root[1:2]: #从第二个节点开始操作
    lst1 = []
    lst1 = child.text
    lst1 = lst1.split(" ")
    lst1 = lst1[:-1:] #由于发现心电数据中最后一位总是有空格存在,故删掉最后一位。
    I = [ int(float(i)) for i in lst1 ] #将心电数据先转化为浮点型再转化为整型,用于绘制心电图
    #print(I)
for child in root[2:3]:
    lst2 = []
    lst2 = child.text
    lst2 = lst2.split(" ")
    lst2 = lst2[:-1:]
    II = [ int(float(i)) for i in lst2 ]
    #print(II)
for child in root[3:4]:
    lst3 = []
    lst3 = child.text
    lst3 = lst3.split(" ")
    lst3 = lst3[:-1:]
    III = [ int(float(i)) for i in lst3 ]
    #print(III)
for child in root[4:5]:
    lst4 = []
    lst4 = child.text
    lst4 = lst4.split(" ")
    lst4 = lst4[:-1:]
    AVF = [ int(float(i)) for i in lst4 ]
    #print(AVF)
for child in root[5:6]:
    lst5 = []
    lst5 = child.text
    lst5 = lst5.split(" ")
    lst5 = lst5[:-1:]
    AVR = [ int(float(i)) for i in lst5 ]
    #print(AVR)
for child in root[6:7]:
    lst6 = []
    lst6 = child.text
    lst6 = lst6.split(" ")
    lst6 = lst6[:-1:]
    AVL = [ int(float(i)) for i in lst6 ]
    #print(AVL)
for child in root[7:8]:
    lst7 = []
    lst7 = child.text
    lst7 = lst7.split(" ")
    lst7 = lst7[:-1:]
    V1 = [ int(float(i)) for i in lst7 ]
    #print(V1)
for child in root[8:9]:
    lst8 = []
    lst8 = child.text
    lst8 = lst8.split(" ")
    lst8 = lst8[:-1:]
    V2 = [ int(float(i)) for i in lst8 ]
    #print(V2)
for child in root[9:10]:
    lst9 = []
    lst9 = child.text
    lst9 = lst9.split(" ")
    lst9 = lst9[:-1:]
    V3 = [ int(float(i)) for i in lst9 ]
    #print(V3)
for child in root[10:11]:
    lst10 = []
    lst10 = child.text
    lst10 = lst10.split(" ")
    lst10 = lst10[:-1:]
    V4 = [ int(float(i)) for i in lst10 ]
    #print(V4)
for child in root[11:12]:
    lst11 = []
    lst11 = child.text
    lst11 = lst11.split(" ")
    lst11 = lst11[:-1:]
    V5 = [ int(float(i)) for i in lst11 ]
    #print(V5)
for child in root[12:13]:
    lst12 = []
    lst12 = child.text
    lst12 = lst12.split(" ")
    lst12 = lst12[:-1:]
    V6 = [ int(float(i)) for i in lst12 ]
    #print(V6)
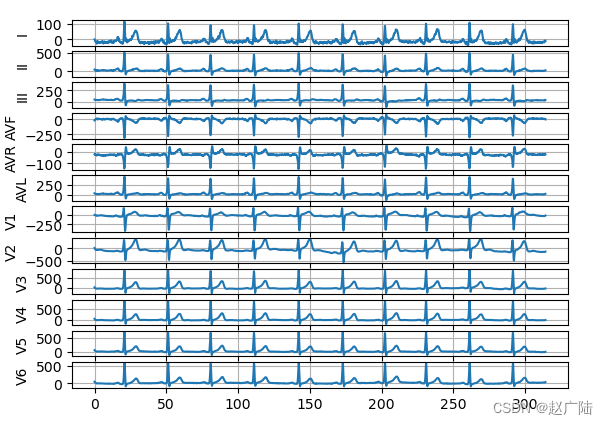
我们截取其中一个节点的信息,可以看到已经成功解析并读取上来。
2.2 心电图的绘制
成功得到心电数据之后,我们调用Python中的2D绘图库Matplotlib来进行心电图的绘制。
导入相关模块
import matplotlib.pyplot as  plt
import matplotlib
import numpy as  np
from matplotlib.backends.backend_tkagg import FigureCanvasTkAgg,NavigationToolbar2Tk
from matplotlib.backend_bases import key_press_handler
from matplotlib.figure import Figure
我们将心电数据中的12个节点依次绘制出心电信号曲线,组成一张完整的十二导联心电图。
a = plt.subplot(12,1,1); #12张中的第一张
plt.plot(np.linspace(0, 100 * np.pi, 5000),I) #5000个数据就给5000个点
plt.ylabel('I')
plt.plot()
plt.grid()

a = plt.subplot(12,1,2);
plt.plot(np.linspace(0, 100 * np.pi, 5000),II)
plt.ylabel('II')
plt.plot()
plt.grid()

a = plt.subplot(12,1,3);
plt.plot(np.linspace(0, 100 * np.pi, 5000),III)
plt.ylabel('III')
plt.plot()
plt.grid()

a = plt.subplot(12,1,4);
plt.plot(np.linspace(0, 100 * np.pi, 5000),AVF)
plt.ylabel('AVF')
plt.plot()
plt.grid()

a = plt.subplot(12,1,5);
plt.plot(np.linspace(0, 100 * np.pi, 5000),AVR)
plt.ylabel('AVR')
plt.plot()
plt.grid()

a = plt.subplot(12,1,6);
plt.plot(np.linspace(0, 100 * np.pi, 5000),AVL)
plt.ylabel('AVL')
plt.plot()
plt.grid()

a = plt.subplot(12,1,7);
plt.plot(np.linspace(0, 100 * np.pi, 5000),V1)
plt.ylabel('V1')
plt.plot()
plt.grid()

a = plt.subplot(12,1,8);
plt.plot(np.linspace(0, 100 * np.pi, 5000),V2)
plt.ylabel('V2')
plt.plot()
plt.grid()

a = plt.subplot(12,1,9);
plt.plot(np.linspace(0, 100 * np.pi, 5000),V3)
plt.ylabel('V3')
plt.plot()
plt.grid()

a = plt.subplot(12,1,10);
plt.plot(np.linspace(0, 100 * np.pi, 5000),V4)
plt.ylabel('V4')
plt.plot()
plt.grid()

a = plt.subplot(12,1,11);
plt.plot(np.linspace(0, 100 * np.pi, 5000),V5)
plt.ylabel('V5')
plt.plot()
plt.grid()

a = plt.subplot(12,1,12);
plt.plot(np.linspace(0, 100 * np.pi, 5000),V6)
plt.ylabel('V6')
plt.plot()
plt.grid()
plt.show()
结果:
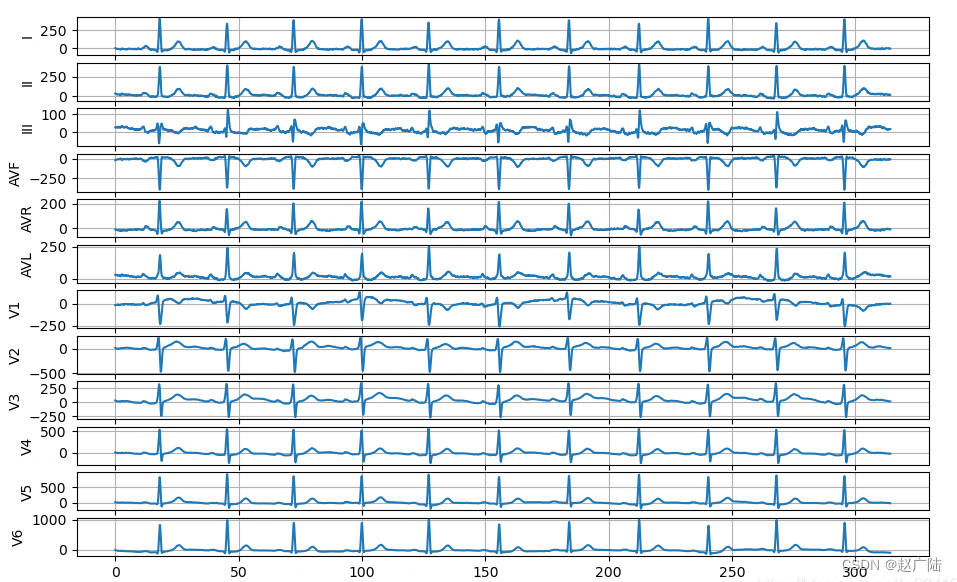
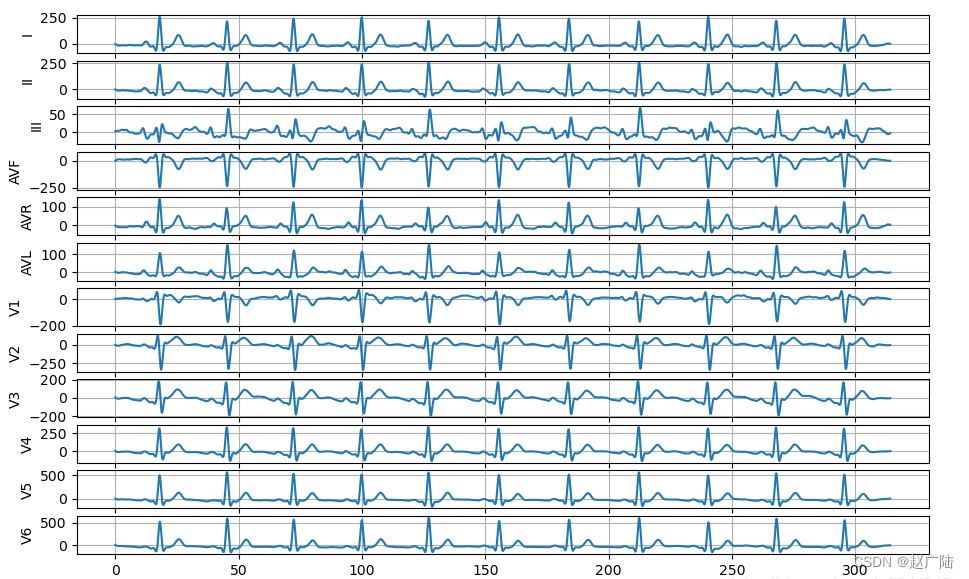
3 心电滤波
滤波的目的是去出噪音,使心电波形更加平滑。这里用到了第三方库heartpy,它是专门用于处理心电数据的python库。
import heartpy as hp
import pandas as pd
import matplotlib.pyplot as plt

"""
   高通滤波
   低通滤波
   带通滤波
"""
#高通滤波
def high_filter():
    path = 'D:\ECG'
    path_list = os.listdir(path)
    path_list.sort(key=lambda x:int(x.split('.')[0]))
    #print(path_list)
    global local
    local = local
    fw = open(os.path.join(path,path_list[local]),'rb')
    tree = etree.parse(fw)
    root = tree.getroot()
    for child in root[1:2]:
        lst1 = []
        lst1 = child.text
        lst1 = lst1.split(" ")
        lst1 = lst1[:-1:]
        I = [ int(float(i)) for i in lst1 ]
        I = hp.filter_signal(I, cutoff=0.75, sample_rate=500.0, order=3, filtertype='highpass')
        #print(I)

#低通滤波
        I = hp.filter_signal(I, cutoff=15, sample_rate=500.0, order=3, filtertype='lowpass')

#带通滤波
        I = hp.filter_signal(I, cutoff=[0.75, 15], sample_rate=500.0, order=3, filtertype='bandpass')
正常
带滤波
4 心电特性数据读取处理
还是一样利用Heartpy这个专门处理心电数据的第三方库来帮我们处理
    I = hp.scale_data(I)
    working_data, measures = hp.process(I, 500.0)

    print(working_data)
    print(measures)
通过输出结果我们可以很轻易地从里面提取到有用的信息,例如R峰的定位、各类波的间期持续时间、以及得到HRV分析的一些常用数据指标。
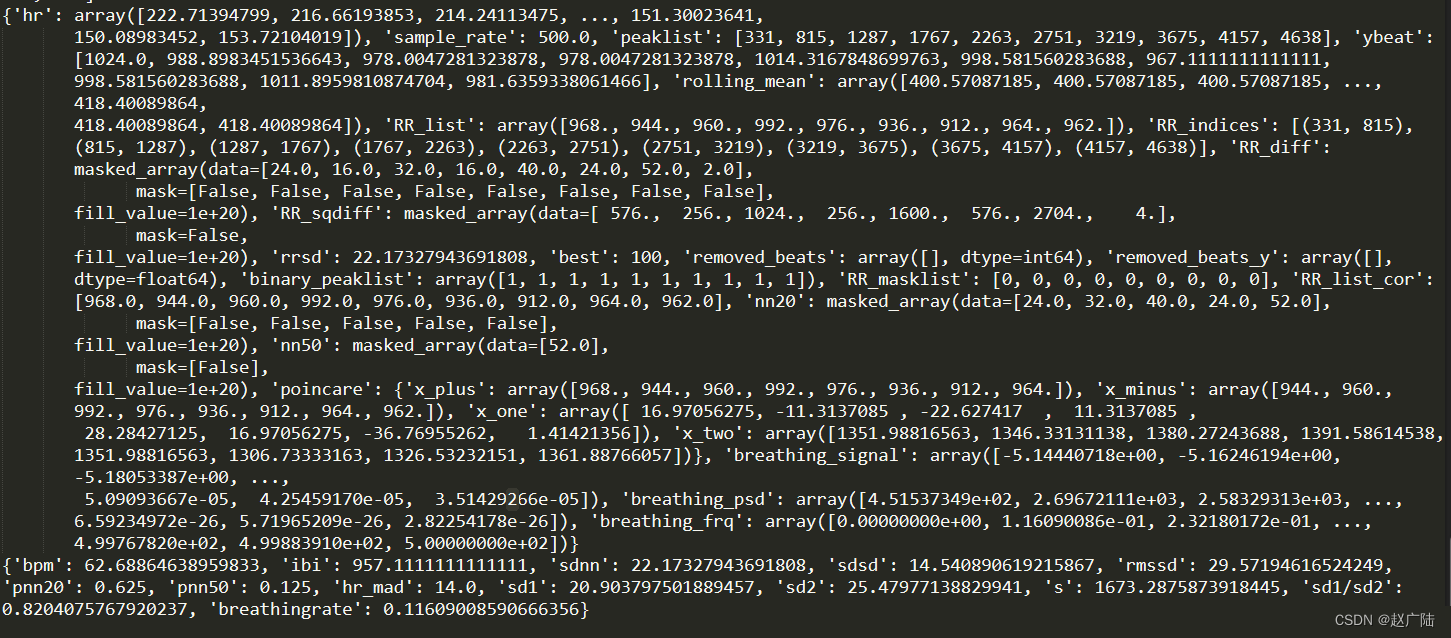
可以从中看到一些心率,心率间隔,rr间期之类的。
5 ECG信号处理相关的开源Python库
5.1 NeuroKit2
详细信息,可以查看具体文档https://neuropsychology.github.io/NeuroKit/
安装方法:
conda install neurokit2
# 或者
pip install neurokit2
该库提供了一些比较有用的ECG处理方向:
- 基于ECG信号的呼吸分析
- 呼吸率变异分析
- 心率变异分析
- P,Q,S,T的定位
- 输出模拟信号:ECG,RSP,EMG和EDA
5.2 hrv
该库主要针对心率变异性分析,具体可查看文档https://hrv.readthedocs.io/en/latest/index.html
文章出处登录后可见!