文章目录
- 一、pyecharts 绘制时间线柱状图
- 1、时间线 Timeline 简介
- 2、时间线 Timeline 柱状图开发要点
- 3、代码示例 – 时间线 Timeline 柱状图
- 二、pyecharts 绘制时间线柱状图其它设置
- 1、时间线 Timeline 播放设置
- 2、时间线 Timeline 主题设置
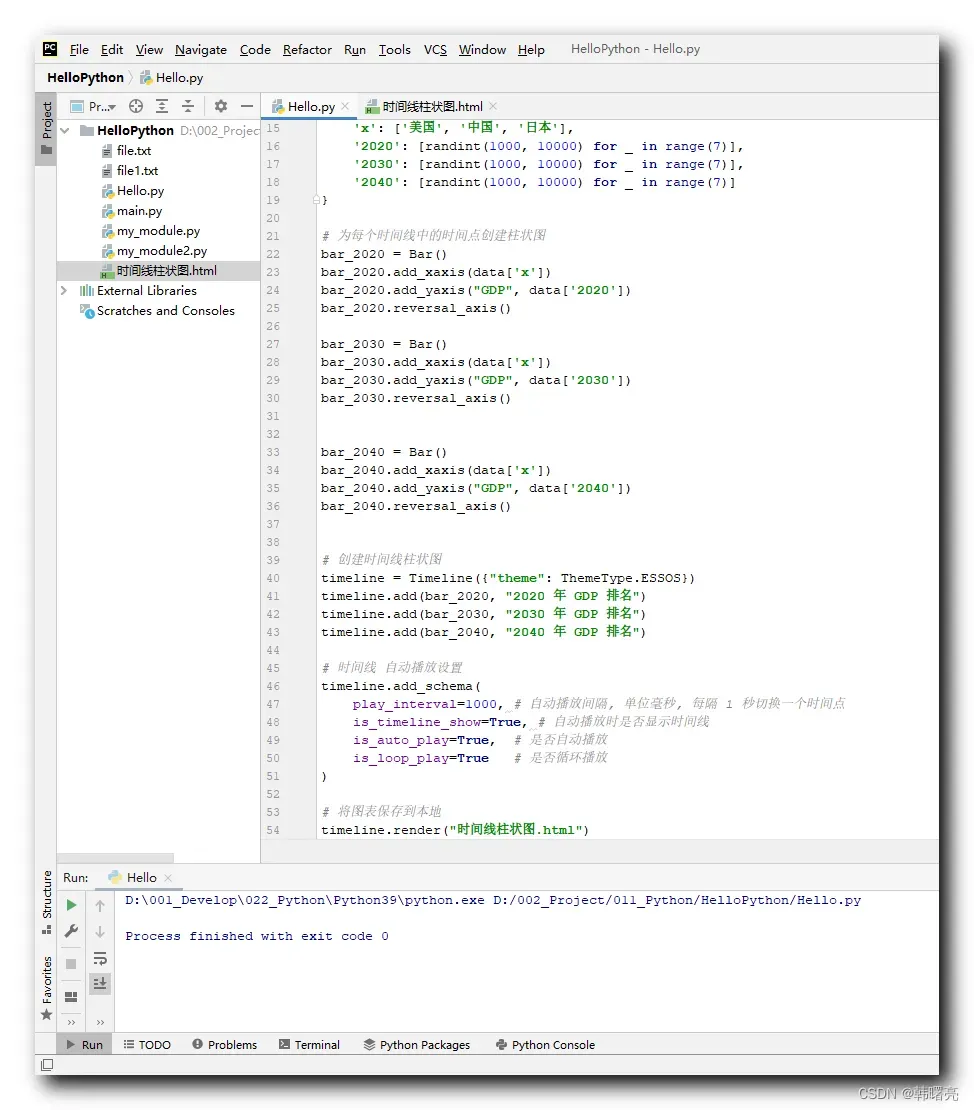
- 3、代码示例 – 时间线特殊设置
pyecharts 画廊网站 : https://gallery.pyecharts.org/#/
- 在该网站可查看官方示例
一、pyecharts 绘制时间线柱状图
1、时间线 Timeline 简介
pyecharts 时间线柱状图 中的 时间线 , 就是与 x 轴平行的一个 时间轴 ;
时间线 的类是 Timeline , 定义在 pyecharts.charts 模块中 ;
在 时间线 上的每个点 , 都代表一个时间点 ,
为 时间线 上的 每个 时间点 都提供一个柱状图 ,
当 时间线 开始播放时 , 随着时间线向前推进 , 推进到不同点 , 就会显示该点对应的 柱状图 ;
时间线柱状图 的 本质就是 在不同的 时间点 , 切换不同的 柱状图图表 ;
2、时间线 Timeline 柱状图开发要点
首先 , 导入 Timeline 时间线包 , 和 Bar 柱状图包 , 这两个类都定义在 pyecharts.charts 模块中 ;
# 导入柱状图核心类
from pyecharts.charts import Bar, Timeline
然后 , 定义数据 , 可以将数据定义在一个字典中 , x 轴的标识只需要定义一次 , 然后为每个时间点的 y 轴数据定义一个列表即可 , 之类使用随机数生成了 列表 容器数据 , 范围是 1000 到 10000 之间 ;
# 定义数据
data = {
    'x': ['美国', '中国', '日本'],
    '2020': [randint(1000, 10000) for _ in range(7)],
    '2030': [randint(1000, 10000) for _ in range(7)],
    '2040': [randint(1000, 10000) for _ in range(7)]
}
再后 , 为 时间线 上的每个时间点生成一个 Bar 柱状图 , 之后将 Bar 实例对象设置给 Timeline 实例对象 ;
# 为每个时间线中的时间点创建柱状图
bar_2020 = Bar()
bar_2020.add_xaxis(data['x'])
bar_2020.add_yaxis("GDP", data['2020'])
bar_2020.reversal_axis()

bar_2030 = Bar()
bar_2030.add_xaxis(data['x'])
bar_2030.add_yaxis("GDP", data['2030'])
bar_2030.reversal_axis()


bar_2040 = Bar()
bar_2040.add_xaxis(data['x'])
bar_2040.add_yaxis("GDP", data['2040'])
bar_2040.reversal_axis()
再后 , 创建 Timeline 实例对象 , 为不同的时间点设置不同的 Bar 柱状图实例对象 , 第二个参数就是时间点的名称 , 第一个参数是 Bar 柱状图实例对象 ;
# 创建时间线柱状图
timeline = Timeline()
timeline.add(bar_2020, "2020 年 GDP 排名")
timeline.add(bar_2030, "2030 年 GDP 排名")
timeline.add(bar_2040, "2040 年 GDP 排名")
最后 , 调用 Timeline#render 函数 , 生成 时间线柱状图 图表 ; render 函数可以传入字符串参数 , 这个参数可以作为 生成网页的名称 ;
# 将图表保存到本地
timeline.render("时间线柱状图.html")
3、代码示例 – 时间线 Timeline 柱状图
代码示例 :
"""
pyecharts 时间线柱状图 代码示例
"""


# 导入产生随机数工具类
from random import randint
# 导入柱状图核心类
from pyecharts.charts import Bar, Timeline

# 定义数据
data = {
    'x': ['美国', '中国', '日本'],
    '2020': [randint(1000, 10000) for _ in range(7)],
    '2030': [randint(1000, 10000) for _ in range(7)],
    '2040': [randint(1000, 10000) for _ in range(7)]
}

# 为每个时间线中的时间点创建柱状图
bar_2020 = Bar()
bar_2020.add_xaxis(data['x'])
bar_2020.add_yaxis("GDP", data['2020'])
bar_2020.reversal_axis()

bar_2030 = Bar()
bar_2030.add_xaxis(data['x'])
bar_2030.add_yaxis("GDP", data['2030'])
bar_2030.reversal_axis()


bar_2040 = Bar()
bar_2040.add_xaxis(data['x'])
bar_2040.add_yaxis("GDP", data['2040'])
bar_2040.reversal_axis()


# 创建时间线柱状图
timeline = Timeline()
timeline.add(bar_2020, "2020 年 GDP 排名")
timeline.add(bar_2030, "2030 年 GDP 排名")
timeline.add(bar_2040, "2040 年 GDP 排名")

# 将图表保存到本地
timeline.render("时间线柱状图.html")
执行结果 : 执行后 , 生成 ” 时间线柱状图.html ” 网页 , 使用 Chrome 浏览器查看该网页 ;
网页内容如下 ( 仅做参考 ) :
<!DOCTYPE html>
<html>
<head>
<meta charset="UTF-8">
<title>Awesome-pyecharts</title>
<script type="text/javascript" src="https://assets.pyecharts.org/assets/v5/echarts.min.js"></script>
</head>
<body >
<div id="7c11d418d95d447488d6009f99f64bf3" class="chart-container" style="width:900px; height:500px; "></div>
<script>
var chart_7c11d418d95d447488d6009f99f64bf3 = echarts.init(
document.getElementById('7c11d418d95d447488d6009f99f64bf3'), 'white', {renderer: 'canvas'});
var option_7c11d418d95d447488d6009f99f64bf3 = {
"baseOption": {
"series": [
{
"type": "bar",
"name": "GDP",
"legendHoverLink": true,
"data": [
6958,
3301,
1993,
1401,
5696,
4703,
6844
],
"realtimeSort": false,
"showBackground": false,
"stackStrategy": "samesign",
"cursor": "pointer",
"barMinHeight": 0,
"barCategoryGap": "20%",
"barGap": "30%",
"large": false,
"largeThreshold": 400,
"seriesLayoutBy": "column",
"datasetIndex": 0,
"clip": true,
"zlevel": 0,
"z": 2,
"label": {
"show": true,
"margin": 8
}
}
],
"timeline": {
"axisType": "category",
"currentIndex": 0,
"orient": "horizontal",
"autoPlay": false,
"controlPosition": "left",
"loop": true,
"rewind": false,
"show": true,
"inverse": false,
"bottom": "-5px",
"progress": {},
"data": [
"2020 \u5e74 GDP \u6392\u540d",
"2030 \u5e74 GDP \u6392\u540d",
"2040 \u5e74 GDP \u6392\u540d"
]
},
"xAxis": [
{
"show": true,
"scale": false,
"nameLocation": "end",
"nameGap": 15,
"gridIndex": 0,
"inverse": false,
"offset": 0,
"splitNumber": 5,
"minInterval": 0,
"splitLine": {
"show": true,
"lineStyle": {
"show": true,
"width": 1,
"opacity": 1,
"curveness": 0,
"type": "solid"
}
}
}
],
"yAxis": [
{
"show": true,
"scale": false,
"nameLocation": "end",
"nameGap": 15,
"gridIndex": 0,
"inverse": false,
"offset": 0,
"splitNumber": 5,
"minInterval": 0,
"splitLine": {
"show": true,
"lineStyle": {
"show": true,
"width": 1,
"opacity": 1,
"curveness": 0,
"type": "solid"
}
},
"data": [
"\u7f8e\u56fd",
"\u4e2d\u56fd",
"\u65e5\u672c",
"\u5fb7\u56fd",
"\u82f1\u56fd",
"\u6cd5\u56fd",
"\u52a0\u62ff\u5927"
]
}
],
"legend": [
{
"data": [
"GDP"
],
"selected": {}
}
]
},
"options": [
{
"series": [
{
"type": "bar",
"name": "GDP",
"legendHoverLink": true,
"data": [
8031,
7856,
3541,
7392,
2628,
4117,
5979
],
"realtimeSort": false,
"showBackground": false,
"stackStrategy": "samesign",
"cursor": "pointer",
"barMinHeight": 0,
"barCategoryGap": "20%",
"barGap": "30%",
"large": false,
"largeThreshold": 400,
"seriesLayoutBy": "column",
"datasetIndex": 0,
"clip": true,
"zlevel": 0,
"z": 2,
"label": {
"show": true,
"margin": 8
}
}
],
"xAxis": [
{
"show": true,
"scale": false,
"nameLocation": "end",
"nameGap": 15,
"gridIndex": 0,
"inverse": false,
"offset": 0,
"splitNumber": 5,
"minInterval": 0,
"splitLine": {
"show": true,
"lineStyle": {
"show": true,
"width": 1,
"opacity": 1,
"curveness": 0,
"type": "solid"
}
}
}
],
"yAxis": [
{
"show": true,
"scale": false,
"nameLocation": "end",
"nameGap": 15,
"gridIndex": 0,
"inverse": false,
"offset": 0,
"splitNumber": 5,
"minInterval": 0,
"splitLine": {
"show": true,
"lineStyle": {
"show": true,
"width": 1,
"opacity": 1,
"curveness": 0,
"type": "solid"
}
},
"data": [
"\u7f8e\u56fd",
"\u4e2d\u56fd",
"\u65e5\u672c",
"\u5fb7\u56fd",
"\u82f1\u56fd",
"\u6cd5\u56fd",
"\u52a0\u62ff\u5927"
]
}
],
"tooltip": {
"show": true,
"trigger": "item",
"triggerOn": "mousemove|click",
"axisPointer": {
"type": "line"
},
"showContent": true,
"alwaysShowContent": false,
"showDelay": 0,
"hideDelay": 100,
"enterable": false,
"confine": false,
"appendToBody": false,
"transitionDuration": 0.4,
"textStyle": {
"fontSize": 14
},
"borderWidth": 0,
"padding": 5,
"order": "seriesAsc"
},
"color": [
"#5470c6",
"#91cc75",
"#fac858",
"#ee6666",
"#73c0de",
"#3ba272",
"#fc8452",
"#9a60b4",
"#ea7ccc"
]
},
{
"series": [
{
"type": "bar",
"name": "GDP",
"legendHoverLink": true,
"data": [
1018,
8874,
7545,
9780,
8622,
5800,
5960
],
"realtimeSort": false,
"showBackground": false,
"stackStrategy": "samesign",
"cursor": "pointer",
"barMinHeight": 0,
"barCategoryGap": "20%",
"barGap": "30%",
"large": false,
"largeThreshold": 400,
"seriesLayoutBy": "column",
"datasetIndex": 0,
"clip": true,
"zlevel": 0,
"z": 2,
"label": {
"show": true,
"margin": 8
}
}
],
"xAxis": [
{
"show": true,
"scale": false,
"nameLocation": "end",
"nameGap": 15,
"gridIndex": 0,
"inverse": false,
"offset": 0,
"splitNumber": 5,
"minInterval": 0,
"splitLine": {
"show": true,
"lineStyle": {
"show": true,
"width": 1,
"opacity": 1,
"curveness": 0,
"type": "solid"
}
}
}
],
"yAxis": [
{
"show": true,
"scale": false,
"nameLocation": "end",
"nameGap": 15,
"gridIndex": 0,
"inverse": false,
"offset": 0,
"splitNumber": 5,
"minInterval": 0,
"splitLine": {
"show": true,
"lineStyle": {
"show": true,
"width": 1,
"opacity": 1,
"curveness": 0,
"type": "solid"
}
},
"data": [
"\u7f8e\u56fd",
"\u4e2d\u56fd",
"\u65e5\u672c",
"\u5fb7\u56fd",
"\u82f1\u56fd",
"\u6cd5\u56fd",
"\u52a0\u62ff\u5927"
]
}
],
"tooltip": {
"show": true,
"trigger": "item",
"triggerOn": "mousemove|click",
"axisPointer": {
"type": "line"
},
"showContent": true,
"alwaysShowContent": false,
"showDelay": 0,
"hideDelay": 100,
"enterable": false,
"confine": false,
"appendToBody": false,
"transitionDuration": 0.4,
"textStyle": {
"fontSize": 14
},
"borderWidth": 0,
"padding": 5,
"order": "seriesAsc"
},
"color": [
"#5470c6",
"#91cc75",
"#fac858",
"#ee6666",
"#73c0de",
"#3ba272",
"#fc8452",
"#9a60b4",
"#ea7ccc"
]
},
{
"series": [
{
"type": "bar",
"name": "GDP",
"legendHoverLink": true,
"data": [
6958,
3301,
1993,
1401,
5696,
4703,
6844
],
"realtimeSort": false,
"showBackground": false,
"stackStrategy": "samesign",
"cursor": "pointer",
"barMinHeight": 0,
"barCategoryGap": "20%",
"barGap": "30%",
"large": false,
"largeThreshold": 400,
"seriesLayoutBy": "column",
"datasetIndex": 0,
"clip": true,
"zlevel": 0,
"z": 2,
"label": {
"show": true,
"margin": 8
}
}
],
"xAxis": [
{
"show": true,
"scale": false,
"nameLocation": "end",
"nameGap": 15,
"gridIndex": 0,
"inverse": false,
"offset": 0,
"splitNumber": 5,
"minInterval": 0,
"splitLine": {
"show": true,
"lineStyle": {
"show": true,
"width": 1,
"opacity": 1,
"curveness": 0,
"type": "solid"
}
}
}
],
"yAxis": [
{
"show": true,
"scale": false,
"nameLocation": "end",
"nameGap": 15,
"gridIndex": 0,
"inverse": false,
"offset": 0,
"splitNumber": 5,
"minInterval": 0,
"splitLine": {
"show": true,
"lineStyle": {
"show": true,
"width": 1,
"opacity": 1,
"curveness": 0,
"type": "solid"
}
},
"data": [
"\u7f8e\u56fd",
"\u4e2d\u56fd",
"\u65e5\u672c",
"\u5fb7\u56fd",
"\u82f1\u56fd",
"\u6cd5\u56fd",
"\u52a0\u62ff\u5927"
]
}
],
"tooltip": {
"show": true,
"trigger": "item",
"triggerOn": "mousemove|click",
"axisPointer": {
"type": "line"
},
"showContent": true,
"alwaysShowContent": false,
"showDelay": 0,
"hideDelay": 100,
"enterable": false,
"confine": false,
"appendToBody": false,
"transitionDuration": 0.4,
"textStyle": {
"fontSize": 14
},
"borderWidth": 0,
"padding": 5,
"order": "seriesAsc"
},
"color": [
"#5470c6",
"#91cc75",
"#fac858",
"#ee6666",
"#73c0de",
"#3ba272",
"#fc8452",
"#9a60b4",
"#ea7ccc"
]
}
]
};
chart_7c11d418d95d447488d6009f99f64bf3.setOption(option_7c11d418d95d447488d6009f99f64bf3);
</script>
</body>
</html>
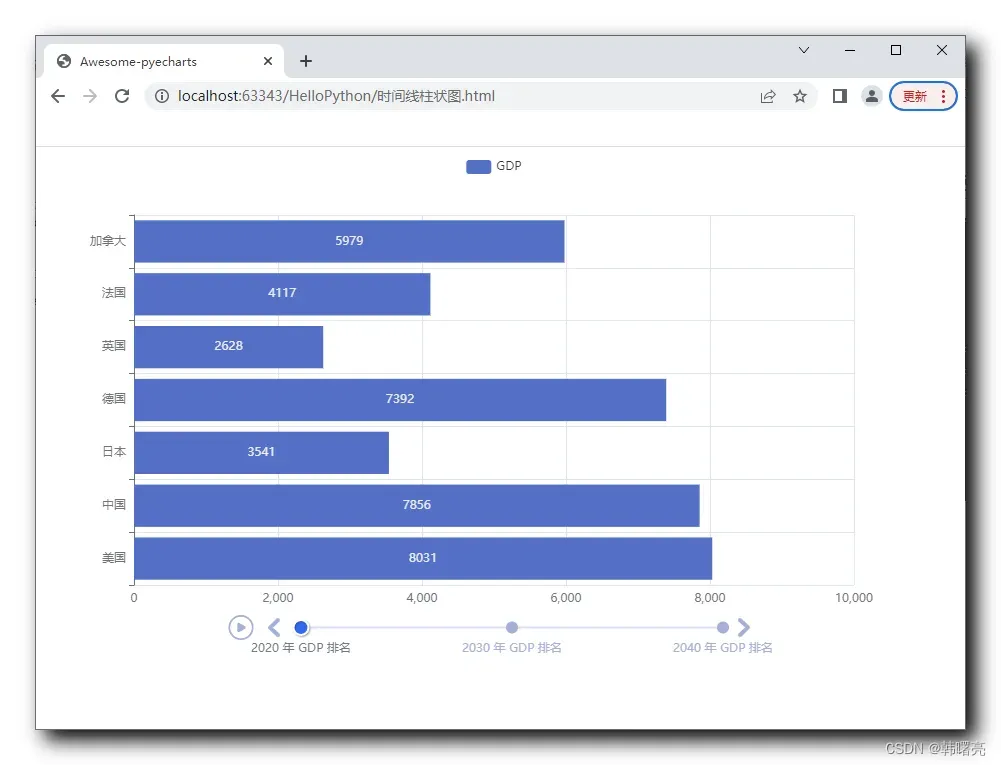
初始状态如下 , 时间点在 2020 年 , 显示的是该时间点的 GDP ;
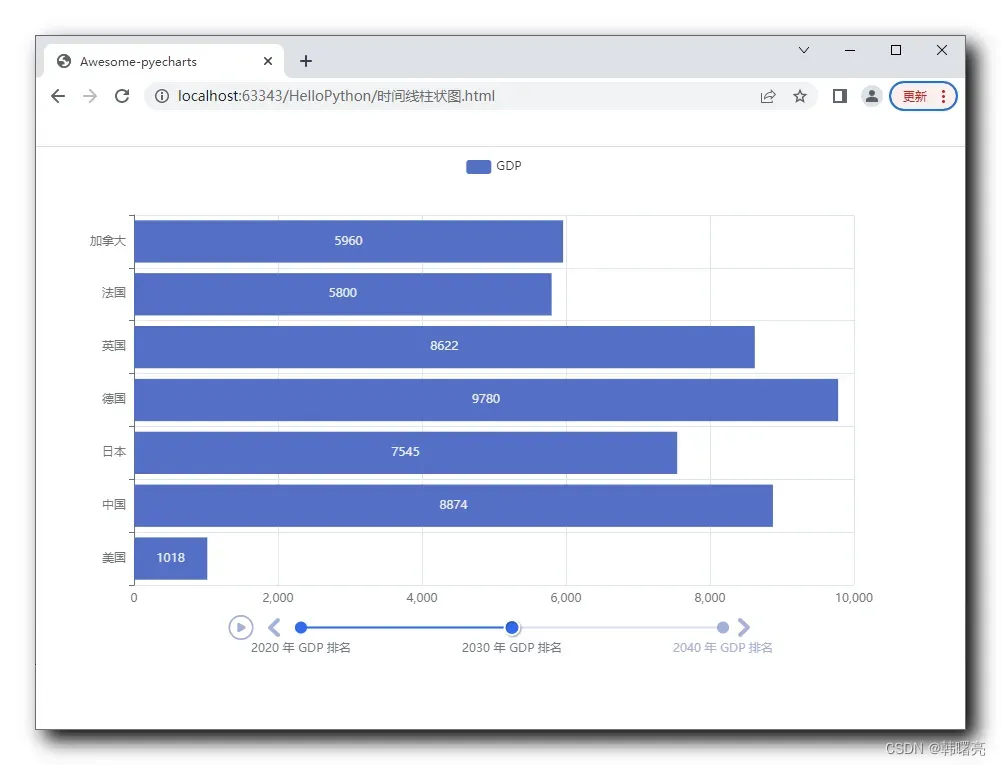
鼠标点击 2030 年 , 得到如下效果 ;
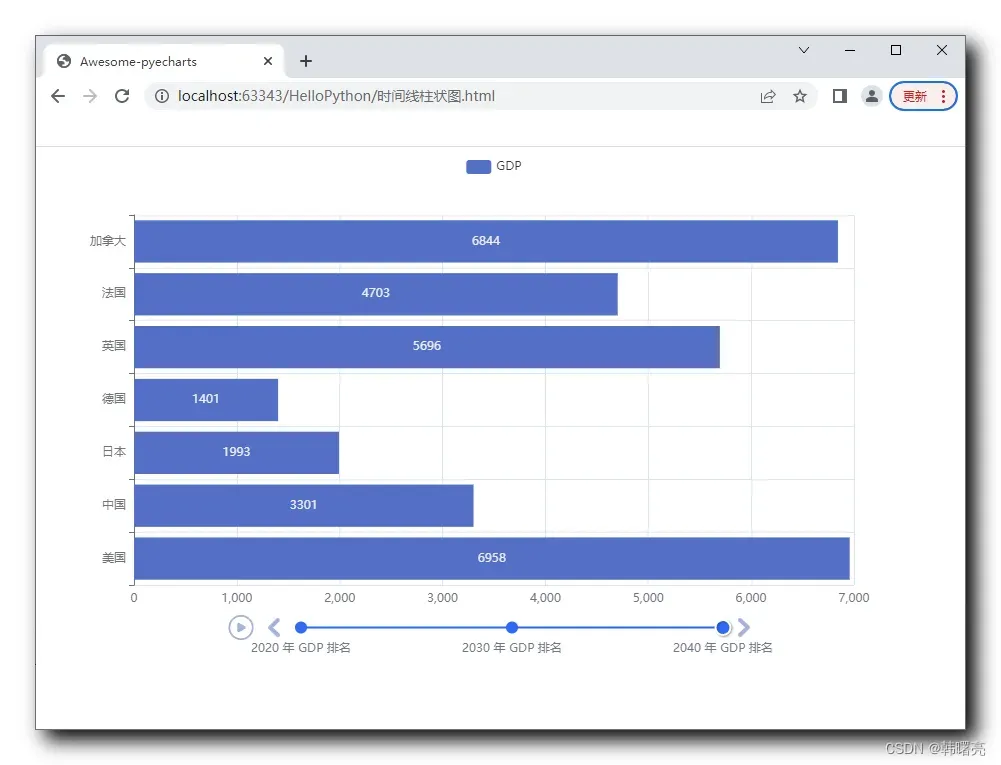
鼠标点击 2040 年 , 得到如下效果 :
点击 时间线 左侧的播放按钮 , 可以 按照时间线 自动播放 柱状图 ;
二、pyecharts 绘制时间线柱状图其它设置
1、时间线 Timeline 播放设置
调用 Timeline#add_schema 函数 , 可以设置 时间线 的 自动播放设置 ;
使用关键字方式设置参数 ,
play_interval 关键字参数设置播放间隔 , 单位毫秒, 下面的代码中 , 每隔 1 秒切换一个时间点 ;
play_interval=1000, # 自动播放间隔, 单位毫秒, 每隔 1 秒切换一个时间点
is_timeline_show 关键字参数设置是否在自动播放时显示时间线 ;
is_timeline_show=True, # 自动播放时是否显示时间线
is_auto_play 关键字参数设置是否自动播放 ,
is_auto_play=True, # 是否自动播放
is_loop_play 关键字参数设置是否循环播放 ;
is_loop_play=True # 是否循环播放
完整代码 :
# 时间线 自动播放设置
timeline.add_schema(
    play_interval=1000, # 自动播放间隔, 单位毫秒, 每隔 1 秒切换一个时间点
    is_timeline_show=True, # 自动播放时是否显示时间线
    is_auto_play=True,  # 是否自动播放
    is_loop_play=True   # 是否循环播放
)
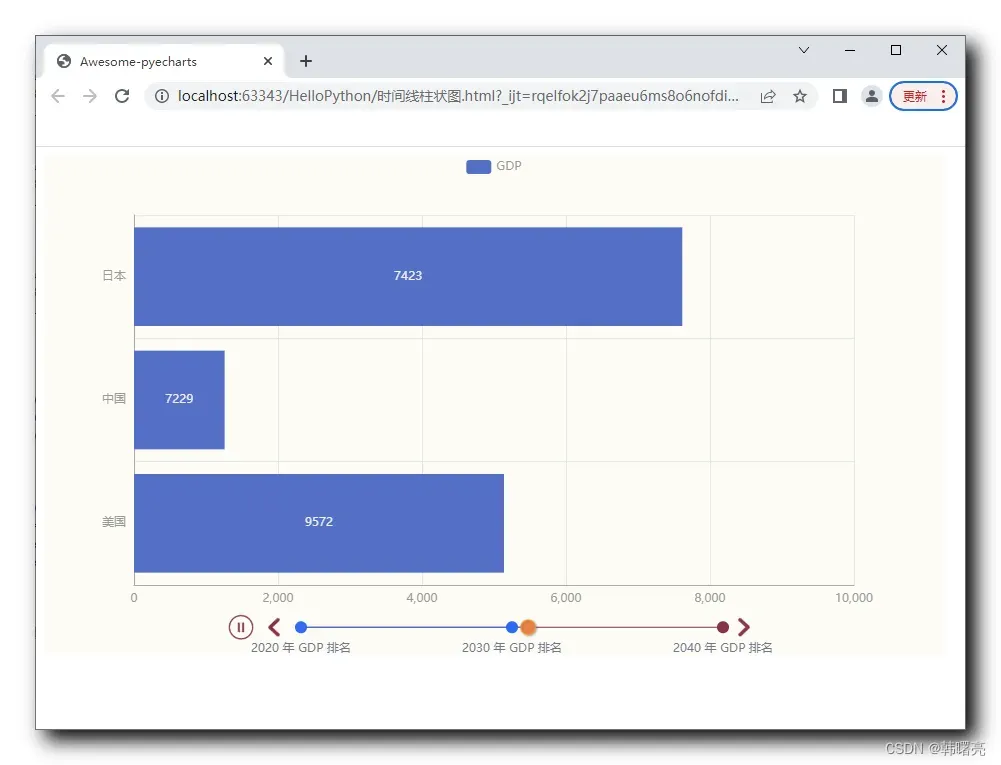
2、时间线 Timeline 主题设置
设置 主题之前 , 需要先导入 ThemeType 类 , 该类定义在 pyecharts.globals 模块中 ;
# 导入主题
from pyecharts.globals import ThemeType
创建时间线时 , 可以在构造函数中 , 传入字典数据作为参数 , 下面的代码可以设置 时间线 Timeline 主题 ;
设置的是 红黄 暖色系 主题 ;
# 创建时间线柱状图
timeline = Timeline({"theme": ThemeType.ESSOS})
效果如下 :
常见的主题如下 :
class _ThemeType:
    BUILTIN_THEMES = ["light", "dark", "white"]
    LIGHT = "light"	# 红蓝粉 高亮颜色
    DARK = "dark"	# 红蓝 黑色背景
    WHITE = "white" # 红蓝 默认颜色 与 Bar 相同
    CHALK: str = "chalk"	# 红蓝绿 黑色背景
    ESSOS: str = "essos"	# 红黄 暖色系
    INFOGRAPHIC: str = "infographic"	# 红蓝黄 偏亮
    MACARONS: str = "macarons"	# 紫绿
    PURPLE_PASSION: str = "purple-passion"	# 粉紫
    ROMA: str = "roma"	# 红黑灰
    ROMANTIC: str = "romantic"	# 红粉蓝
    SHINE: str = "shine"
    VINTAGE: str = "vintage"
    WALDEN: str = "walden"
    WESTEROS: str = "westeros"
    WONDERLAND: str = "wonderland"
    HALLOWEEN: str = "halloween"
3、代码示例 – 时间线特殊设置
代码示例 :
"""
pyecharts 时间线柱状图 代码示例
"""


# 导入产生随机数工具类
from random import randint
# 导入柱状图核心类
from pyecharts.charts import Bar, Timeline
# 导入主题
from pyecharts.globals import ThemeType

# 定义数据
data = {
    'x': ['美国', '中国', '日本'],
    '2020': [randint(1000, 10000) for _ in range(7)],
    '2030': [randint(1000, 10000) for _ in range(7)],
    '2040': [randint(1000, 10000) for _ in range(7)]
}

# 为每个时间线中的时间点创建柱状图
bar_2020 = Bar()
bar_2020.add_xaxis(data['x'])
bar_2020.add_yaxis("GDP", data['2020'])
bar_2020.reversal_axis()

bar_2030 = Bar()
bar_2030.add_xaxis(data['x'])
bar_2030.add_yaxis("GDP", data['2030'])
bar_2030.reversal_axis()


bar_2040 = Bar()
bar_2040.add_xaxis(data['x'])
bar_2040.add_yaxis("GDP", data['2040'])
bar_2040.reversal_axis()


# 创建时间线柱状图
timeline = Timeline({"theme": ThemeType.ESSOS})
timeline.add(bar_2020, "2020 年 GDP 排名")
timeline.add(bar_2030, "2030 年 GDP 排名")
timeline.add(bar_2040, "2040 年 GDP 排名")

# 时间线 自动播放设置
timeline.add_schema(
    play_interval=1000, # 自动播放间隔, 单位毫秒, 每隔 1 秒切换一个时间点
    is_timeline_show=True, # 自动播放时是否显示时间线
    is_auto_play=True,  # 是否自动播放
    is_loop_play=True   # 是否循环播放
)

# 将图表保存到本地
timeline.render("时间线柱状图.html")
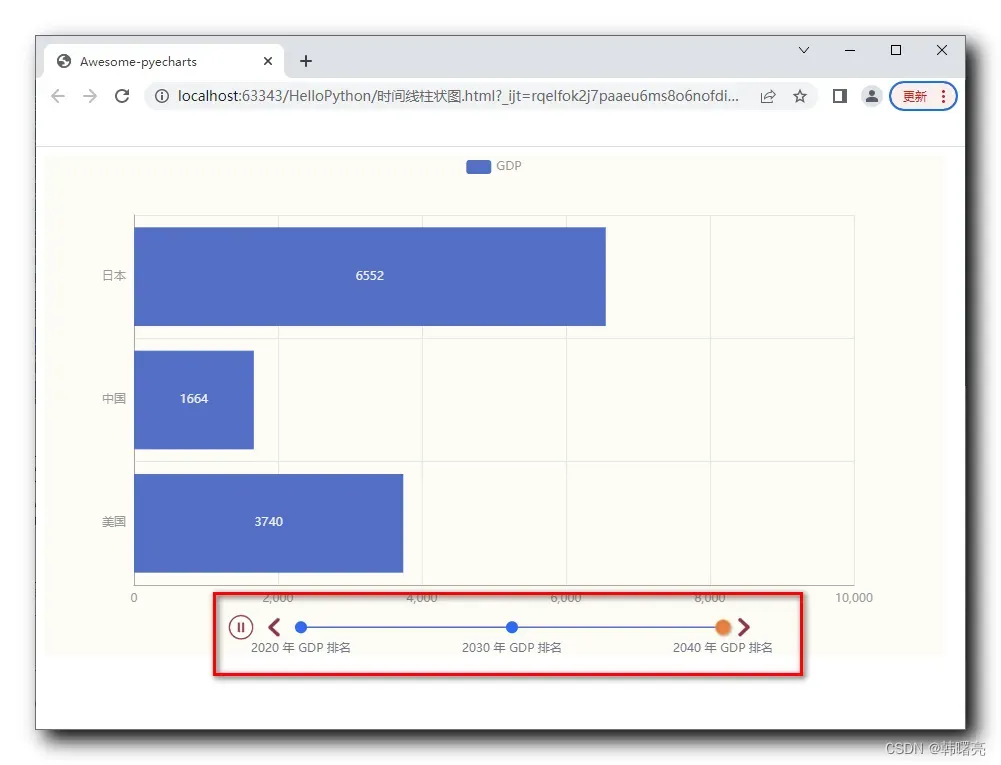
执行结果 : 执行后生成 ” 时间线柱状图.html ” 网页文件 ;
打开该网页文件 , 效果如下 : 打开后 , 时间线会自动播放 ;
文章出处登录后可见!