【Python】数据挖掘与机器学习(一)
大家好 我是寸铁👊
总结了一篇【Python】数据挖掘与机器学习(一)sparkles:
喜欢的小伙伴可以点点关注 💝
【实验1】预测鲍鱼年龄
问题描述
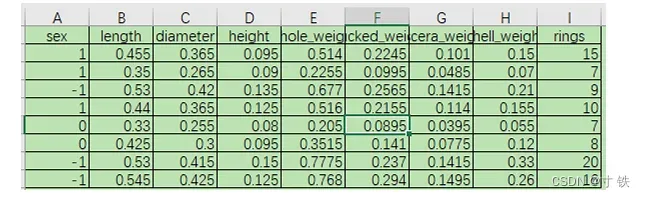
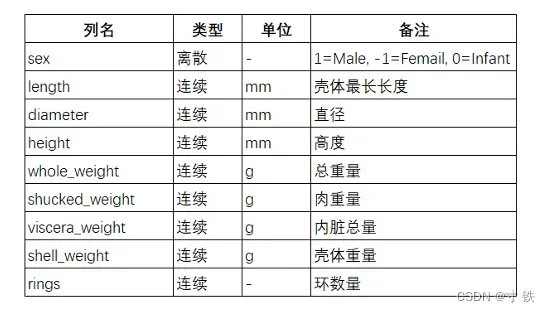
请从一份数据中预测鲍鱼的年龄,数据集在abalone.cvs中,数据集一共有4177 个样本,每个样本有9个特征。其中rings为鲍鱼环数,鲍鱼每一年长一环,类似树轮,是预测
变量,sex属性已经经过处理,M=1表示雄性、F=-1表示雌性、I=0表示幼体。 有9列数据,分别是:
要求
(1)给出回归模型,给出线性回归模型的回归系数,以及
(2)需要分训练数据与测试数据,采用训练数据学习,给出R2,采用测试数据计算MSE.
代码
import sklearn
import tensorflow as tf
import numpy as np
import pandas
import sklearn.model_selection as ms
import matplotlib.pyplot as plt


def main():
    df = pandas.read_csv('abalone.csv')
    df = df.values

    y = df[:, [-1]].astype('float32')  # 提取第9 列
    x = df[:, 1:8].astype('float32')  # 提取1-8 列
    sex = df[:, 0].astype('float32')  # 取出第0 列,后续要转换成2 个哑元
    male = sex == 1
    female = sex == -1
    oneMa = np.zeros((len(sex), 1), dtype='float32')  # 雄性
    oneFe = np.zeros((len(sex), 1), dtype='float32')  # 雌性
    oneMa[male] = 1
    oneFe[female] = 1
    ones = np.ones((len(x), 1), dtype='float32')  # 全是 1 的向量
    x = np.hstack((ones, oneMa, oneFe, x))  # 凑成一个 X 大矩阵
    print(x.shape)
    rows, cols = x.shape
    weight = tf.Variable(tf.random.normal([cols, 1]), name='weight')

    # 生成一个 包含 bias 的 weight,对应 x 的列数
    def loss_fn(X, y):
        y_ = tf.matmul(X, weight)
        assert (y.shape == y_.shape)  # 确认维数一致,这一步很容易出错
        return tf.reduce_mean(tf.square(y_ - y)) / 2

    x_train, x_test, y_train, y_test = ms.train_test_split(x, y, test_size=0.3, random_state=32)
    print(x_train.shape)
    print(x_test.shape)
    print(y_train.shape)
    print(y_test.shape)

    print(weight)

    yy_ = tf.matmul(x_train, weight)
    err = sklearn.metrics.mean_squared_error(y_train, yy_)
    print(f'训练集 MSE: {err}')
    y_ = tf.matmul(x_test, weight)
    err = sklearn.metrics.mean_squared_error(y_test, y_)
    print(f'测试集 MSE: {err}')  # 测试集的 MSE
    R2 = sklearn.metrics.r2_score(y_train, yy_)
    print(f'R2 = {R2}')

    plt.show()
【实验2】成年男性的听力实验
数据集hearing_test.csv 是对 5000 名参与者进行了一项实验,以研究年龄和身体健康对听力损失的影响,尤其是听高音的能力。此数据显示了研究结果对参与者进行了身体能力的评估和评分,然后必须进行音频测试(通过/不通过),以评估他们听到高频的能力。
特征:1.年龄age;2. 健康得分physical_score
标签:1通过/0不通过
要求
(1)采用以下方法读取数据,并给出可视化的显示效果
import seaborn as sns
import pandas as pd
(绘图包, pip install seaborn)
import matplotlib.pyplot as plt
df = pd.read_csv('hearing_test.csv')
sns.scatterplot(x='age',y='physical_score',data=df,hue='test_result')
sns.pairplot(df,hue='test_result')
plt.show()
由于show默认是阻塞,看完图后,要把它放在代码最后面
(2)采用以下方法得到数据
df = df.values
x = df[:, [0, 1]]
头两列对应age与physical_score - 3 -
y = df[:, 2]
 第三列对应是否通过
(3)把数据拆分为训练集与测试集,最后采用测试数据来验证模型
from sklearn.model_selection import train_test_split
x_train, x_test, y_train, y_test = train_test_split(x, y,
 test_size=0.4, random_state=2022)
(4)给出Logistic回归分类方法,给出二分类模型的权重,给出测试数据的散点图;
(5)模型性能评估:给出训练集与测试集的准确率 Accuracy、精确度 Precision 和召
回率Recall、F1score。
(6)选做:给出两类数据的分割直线。
代码
import seaborn as sns
import pandas as pd
import matplotlib.pyplot as plt
from sklearn.linear_model import LogisticRegression
from sklearn.model_selection import train_test_split
from tensorflow.python.ops.confusion_matrix import confusion_matrix
from sklearn.metrics import accuracy_score
from sklearn.metrics import precision_score
from sklearn.metrics import recall_score
from sklearn.metrics import f1_score

df = pd.read_csv('hearing_test.csv')
testA = df[df["test_result"] == 0].values
testB = df[df["test_result"] == 1].values
sns.scatterplot(x='age', y='physical_score', data=df, hue='test_result')
sns.pairplot(df, hue='test_result')
df = df.values
x = df[:, [0, 1]]  # 头两列对应 age 与 physical_score
y = df[:, 2]  # 第三列对应是否通过
x_train, x_test, y_train, y_test = train_test_split(x, y,
                                                    test_size=0.4, random_state=2022)
model = LogisticRegression(fit_intercept=True).fit(x_train, y_train)
weight = model.coef_
bias = model.intercept_
print('权重:', weight, bias)
print('训练集准确率:', model.score(x_train, y_train))
print('测试集准确率:', model.score(x_test, y_test))
y_pred = model.predict(x_test)
print('混淆矩阵:\n', confusion_matrix(y_test, y_pred))

print('accuracy:', accuracy_score(y_test, y_pred))
print('precision:', precision_score(y_test, y_pred))
print('recall:', recall_score(y_test, y_pred))
print('f1 score:', f1_score(y_test, y_pred))
x1_boundary, x2_boundary = [], []

plt.figure()
plt.scatter(x1_boundary, x2_boundary, c='b', s=10)
plt.scatter(testA[:, 0], testA[:, 1], c='r', s=1)
plt.scatter(testB[:, 0], testB[:, 1], c='g', s=1)
plt.show()
看到这里的小伙伴,恭喜你又掌握了一个技能👊
希望大家能取得胜利,坚持就是胜利💪
我是寸铁!我们下期再见💕
往期好文💕
保姆级教程
【保姆级教程】Windows11下go-zero的etcd安装与初步使用
【保姆级教程】Windows11安装go-zero代码生成工具goctl、protoc、go-zero
【Go-Zero】手把手带你在goland中创建api文件并设置高亮
报错解决
【Go-Zero】Error: user.api 27:9 syntax error: expected ‘:‘ | ‘IDENT‘ | ‘INT‘, got ‘(‘ 报错解决方案及api路由注意事项
【Go-Zero】Error: only one service expected goctl一键转换生成rpc服务错误解决方案
【Go-Zero】【error】 failed to initialize database, got error Error 1045 (28000):报错解决方案
【Go-Zero】Error 1045 (28000): Access denied for user ‘root‘@‘localhost‘ (using password: YES)报错解决方案
【Go-Zero】type mismatch for field “Auth.AccessSecret“, expect “string“, actual “number“报错解决方案
【Go-Zero】Error: user.api 30:2 syntax error: expected ‘)‘ | ‘KEY‘, got ‘IDENT‘报错解决方案
【Go-Zero】Windows启动rpc服务报错panic:context deadline exceeded解决方案
Go面试向
【Go面试向】defer与time.sleep初探
【Go面试向】defer与return的执行顺序初探
【Go面试向】Go程序的执行顺序
【Go面试向】rune和byte类型的认识与使用
【Go面试向】实现map稳定的有序遍历的方式
版权声明:本文为博主作者:寸 铁原创文章,版权归属原作者,如果侵权,请联系我们删除!