自从YOLO诞生依赖,关于YOLO的各种版本迭代更新就从未停止过,前不久的时候官方也推出了全新一代的YOLOv7模型,在各大主流视觉任务上都取得了很大的进步。
官方项目地址在这里,首页截图如下所示:
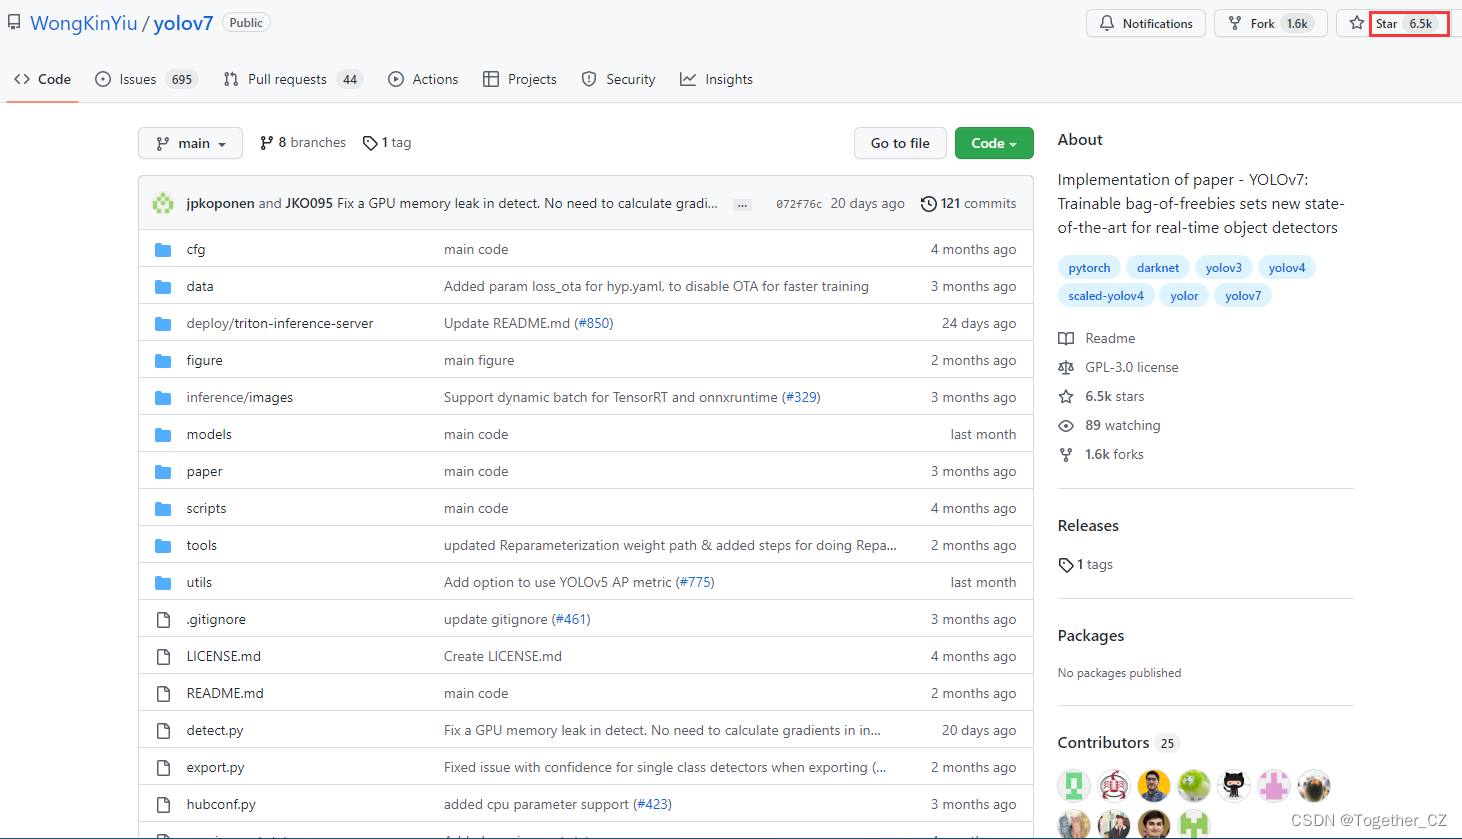
截止目前已经有超过6.5K的star量了,还是很强的。
感兴趣的话可以自行前去学习了解,闲话就说到这里了,接下来进入正文,首先来看效果:
裂缝检测系统演示
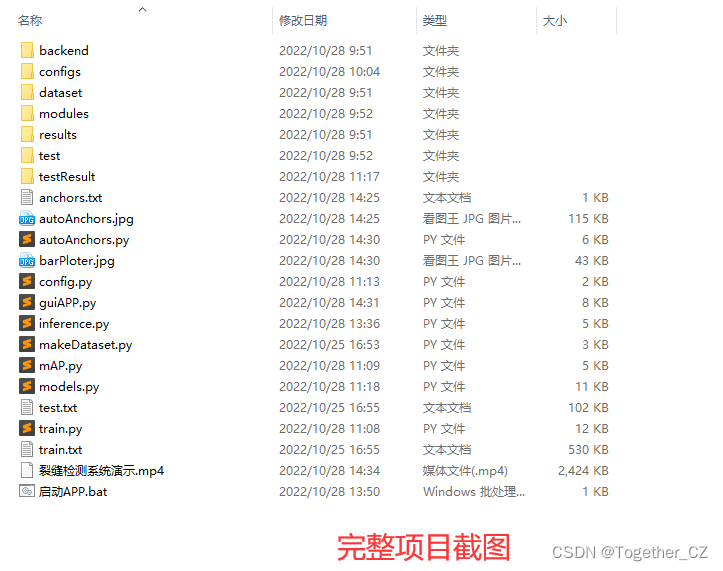
接下来看下完整项目详情:
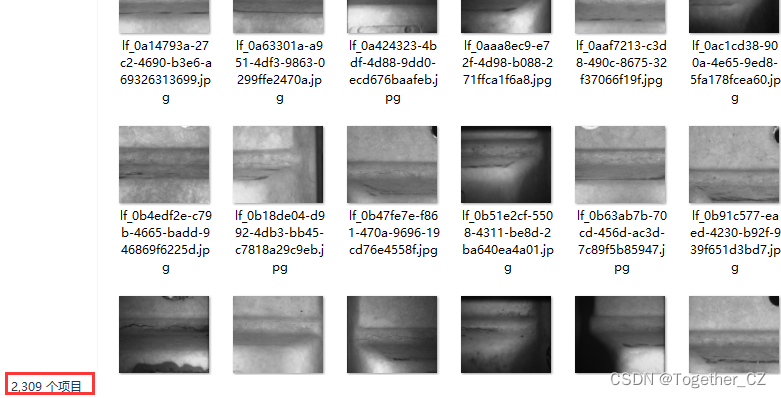
首先看下数据集:
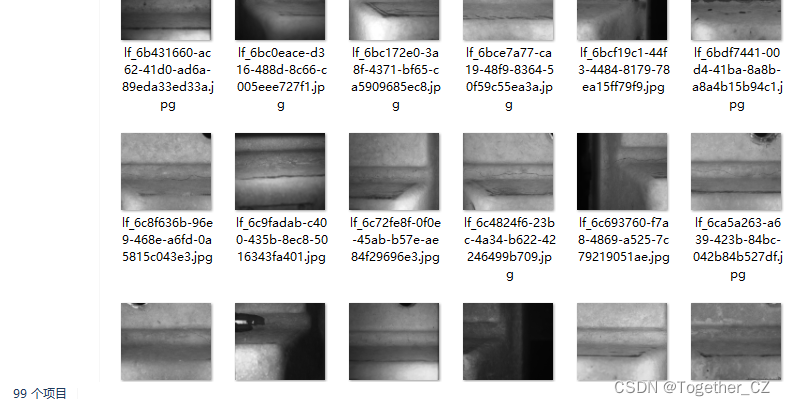
【图像数据】
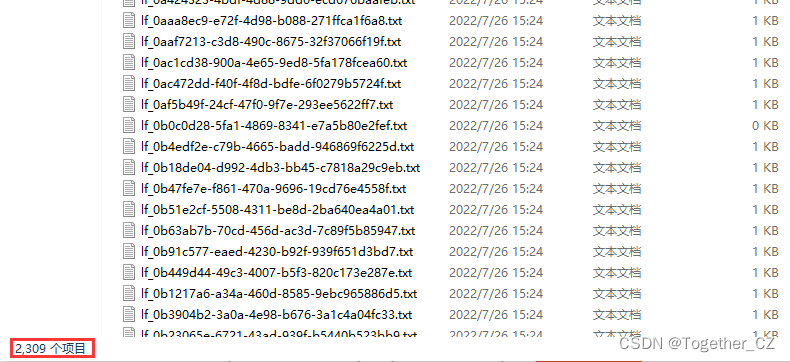
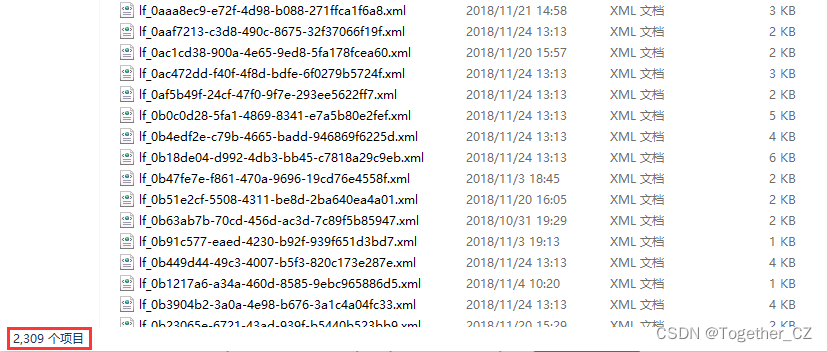
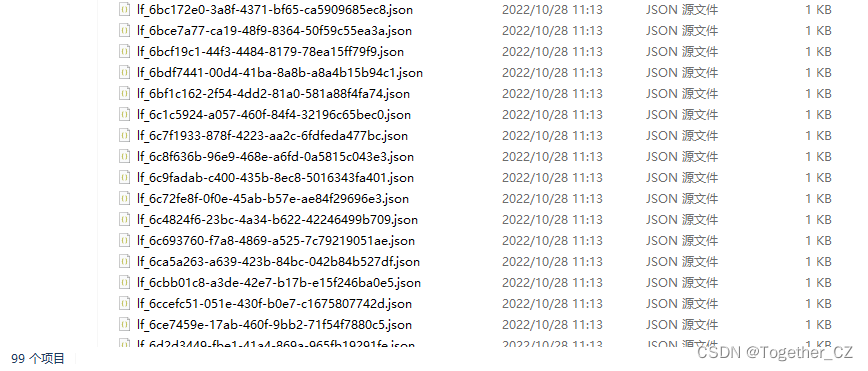
【标注数据】
【xml数据】
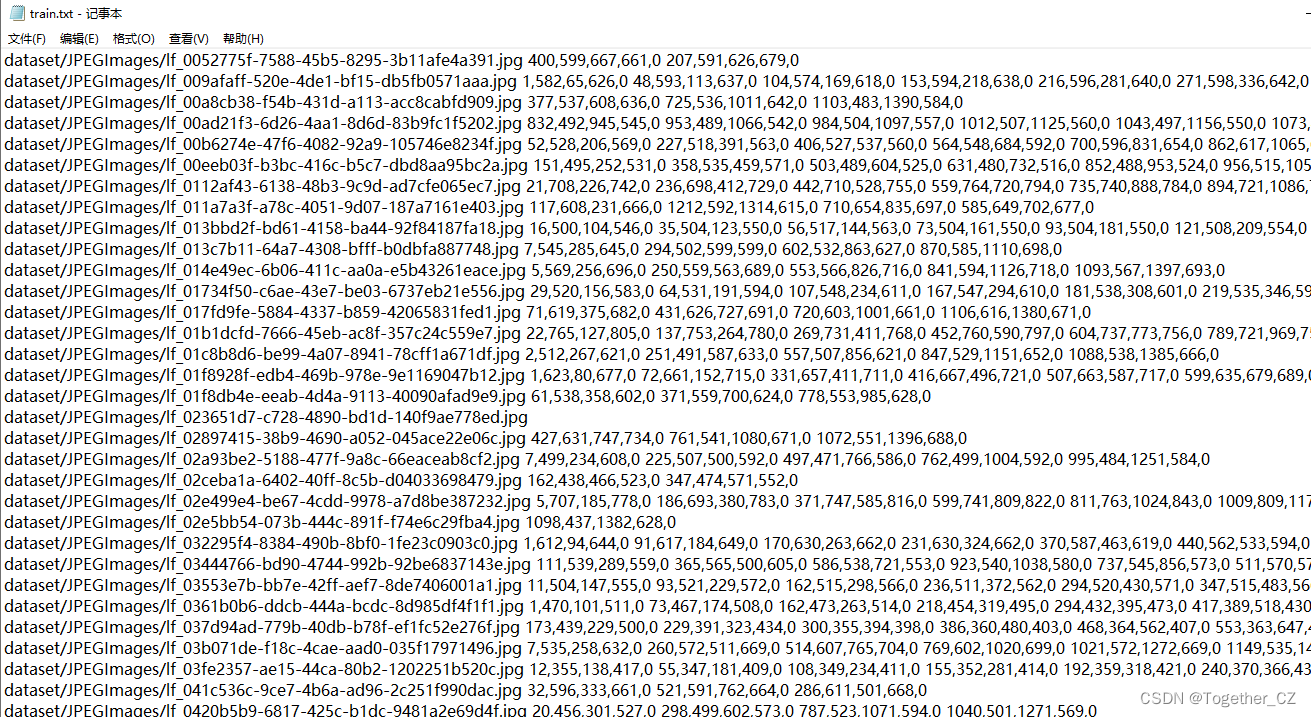
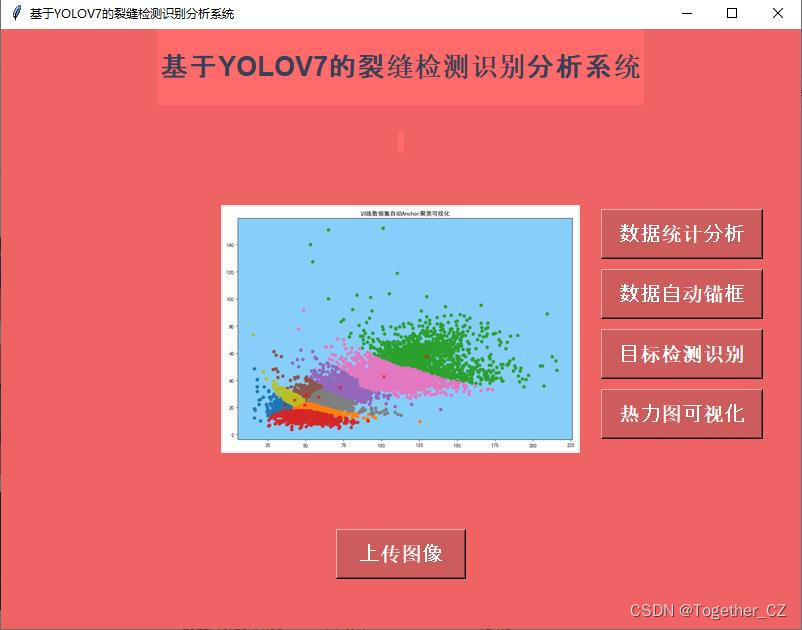
如果不想直接使用作者基于COCO或者是VOC数据集计算出来的anchor数据的话,也可以基于autoAnchors.py模块完成对自建数据集训练数据的自动anchor聚类计算,主要使用的就是kmeans聚类算法,详细原理可以自行百度了解即可,这里看下训练数据集train.txt,截图如下所示:
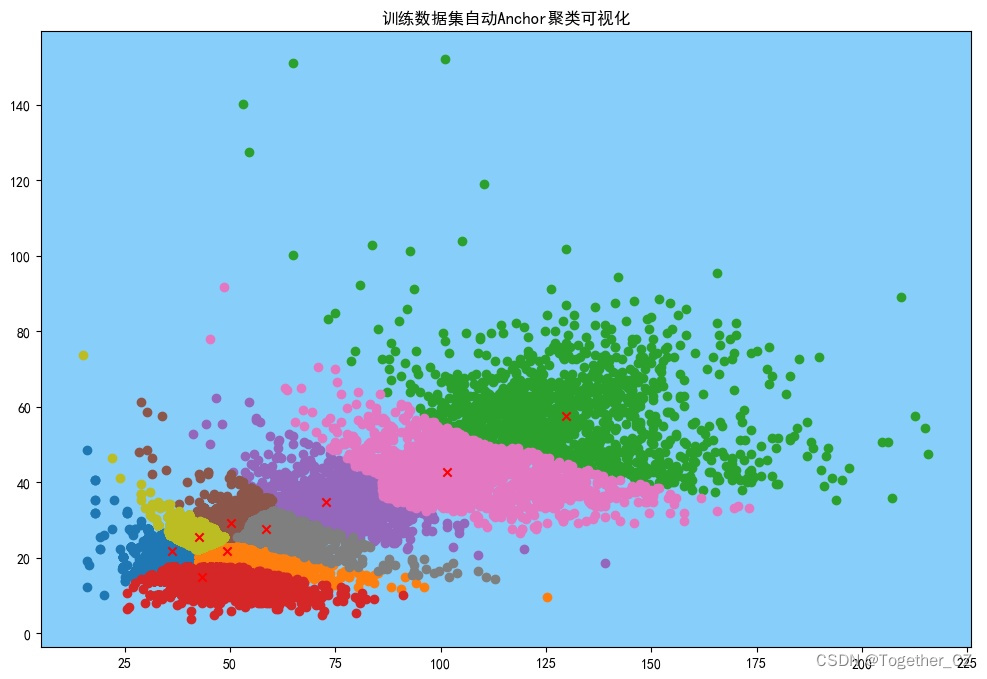
基于autoAnchors.py模块自动计算得到的anchor数据如下所示:
43,14, 36,21, 49,21, 42,25, 50,29, 58,27, 72,34, 101,42, 129,57为了直观呈现数据聚类分布情况,这里对其进行了可视化,如下所示:
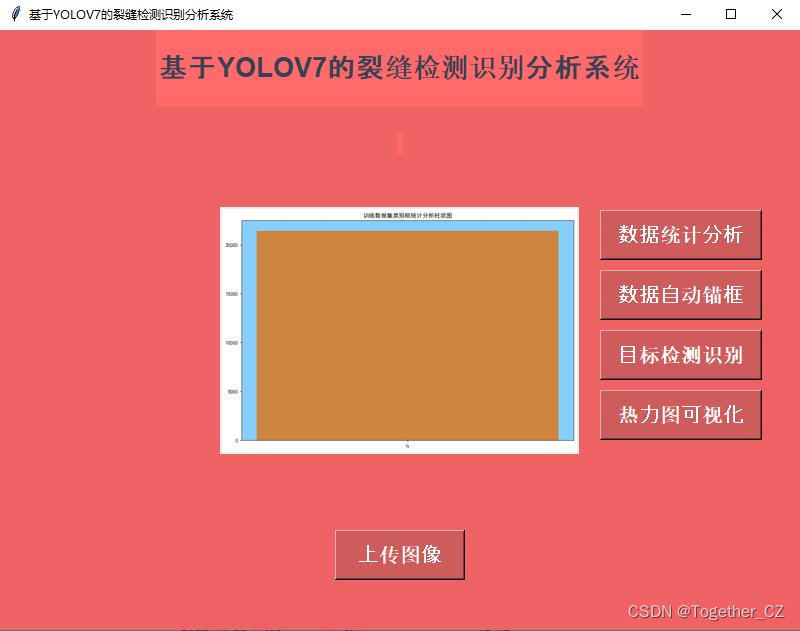
为了对整体数据集标注类别分布情况做统计分析,这里简单以柱状图形式进行可视化,核心实现如下所示:
data_dict={}
with open("train.txt") as f:
    train_data=[one.strip().split(" ")[1:] for one in f.readlines() if one.strip()]
for one_list in train_data:
    for one_line in one_list:
        one_label=one_line.split(",")[-1].strip()
        if one_label in data_dict:
            data_dict[one_label]+=1
        else:
            data_dict[one_label]=1
barPloter(data_dict, "训练数据集类别框统计分析柱状图",savepath="barPloter.jpg")
可视化结果如下所示:
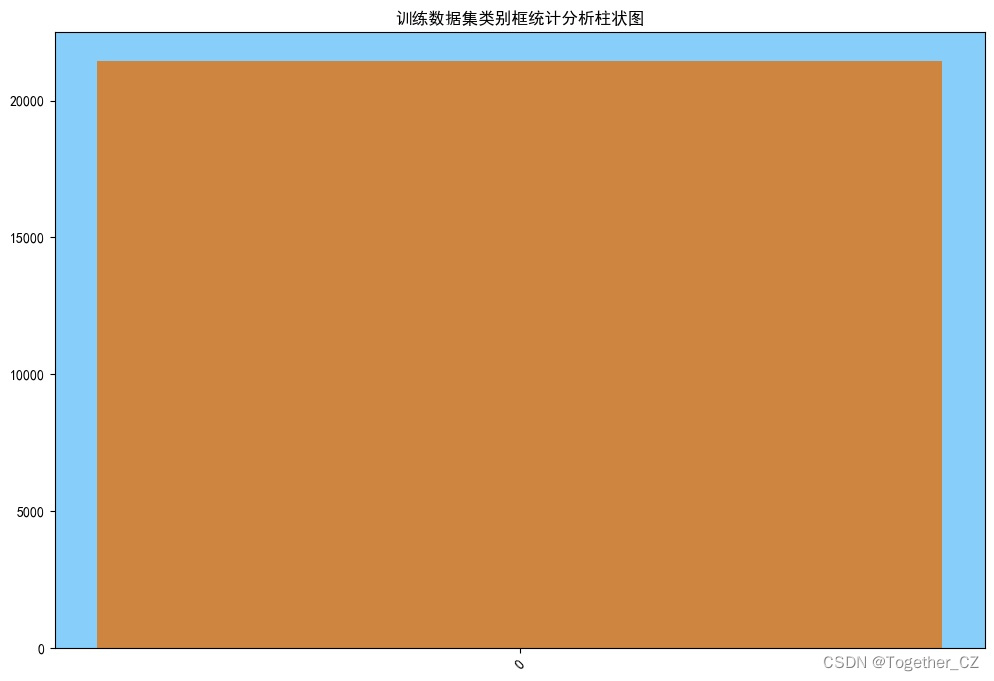
这里比较特殊,因为我这里的标注对象只有一个就是裂缝,所以柱状图展现出来就是比较突兀,如果你的是多个类别的话这个就会对比比较明显了。
为了更加方便地自由创建训练集-测试集,这里我开发了makeDataset.py模块,实现一键完成数据集的创建,核心实现如下所示:
def convert(image_id, list_file):
    in_file = open("dataset/xmls/%s.xml" % (image_id), encoding="utf-8")
    tree = ET.parse(in_file)
    root = tree.getroot()
    for obj in root.iter("object"):
        difficult = 0
        if obj.find("difficult") != None:
            difficult = obj.find("difficult").text
        cls = obj.find("name").text
        if cls not in classes or int(difficult) == 1:
            continue
        cls_id = classes.index(cls)
        xmlbox = obj.find("bndbox")
        b = (
            int(xmlbox.find("xmin").text),
            int(xmlbox.find("ymin").text),
            int(xmlbox.find("xmax").text),
            int(xmlbox.find("ymax").text),
        )
        list_file.write(" " + ",".join([str(a) for a in b]) + "," + str(cls_id))


prefix = ""
for image_set in sets:
    image_ids = open("dataset/%s.txt" % (image_set)).read().strip().split()
    list_file = open("%s.txt" % (image_set), "w")
    for image_id in image_ids:
        one_line_prefix = prefix + "dataset/JPEGImages/" + image_id + ".jpg"
        list_file.write(one_line_prefix)
        convert(image_id, list_file)
        list_file.write("\n")
    list_file.close()
终端执行完成之后就会在同级目录下面自动生成train.txt和test.txt 两个数据集文件了。
之后就可以启动训练了,训练完成后随机选取测试数据进行模型的测试,如下:
核心推理实现如下:
def batchImgsDetect(dataDir="test/", saveDir="testResult/"):
    """
    批量数据检测计算
    """
    picDir = saveDir + "picture/"
    jsonDir = saveDir + "json/"
    if not os.path.exists(picDir):
        os.makedirs(picDir)
    if not os.path.exists(jsonDir):
        os.makedirs(jsonDir)
    for one_pic in tqdm(os.listdir(dataDir)):
        try:
            one_path = dataDir + one_pic
            print("Loading From: ", one_path)
            one_id = one_pic.split(".")[0].strip()
            one_img = Image.open(one_path)
            resImg, resData = yolo.detect_image(one_img)
            print("resData: ", resData)
            one_save_pic_path = picDir + one_id + ".jpg"
            one_save_json_path = jsonDir + one_id + ".json"
            if one_save_pic_path:
                resImg.save(one_save_pic_path, quality=95, subsampling=0)
            if one_save_json_path:
                with open(one_save_json_path, "w") as f:
                    f.write(json.dumps(resData))
            print("Saving resImg To: ", one_save_pic_path)
            print("Saving resData To: ", one_save_json_path)
        except Exception as e:
            print("Exception: ", e)
结果会同时存储检测结果数据与结果图像数据,如下:
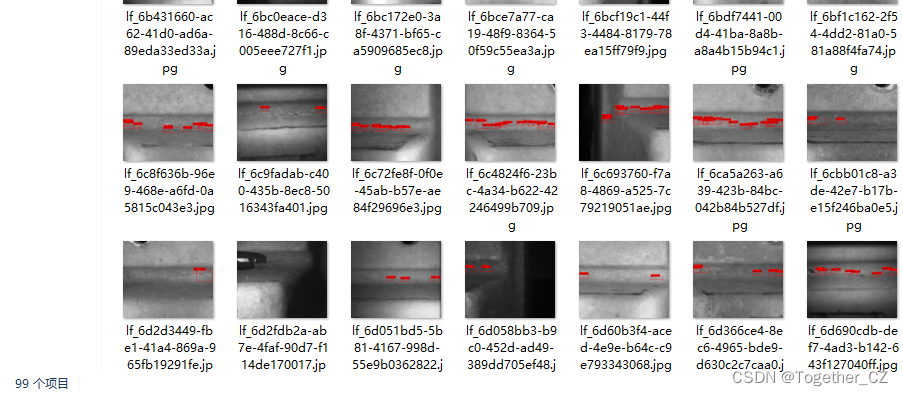
我们随机选取单张图像,样例如下:
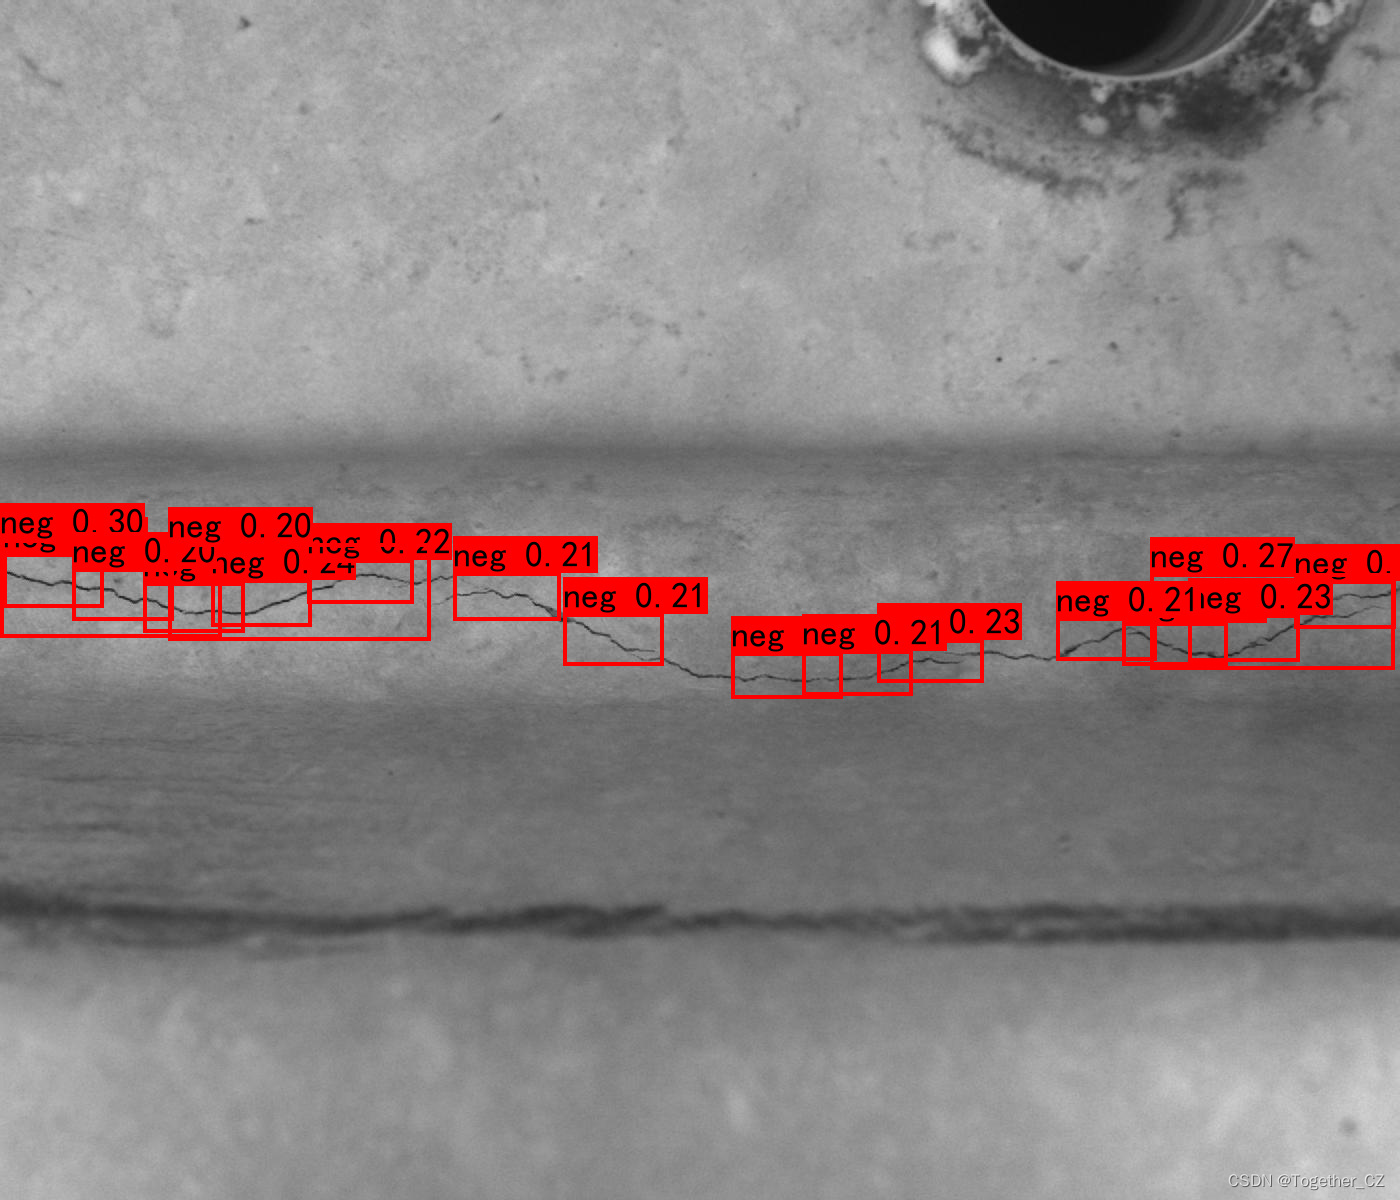
检测结果数据如下:
{
"neg": [
[
0.35188737511634829,
[
553,
3,
607,
103
]
],
[
0.3090079426765442,
[
580,
1294,
628,
1395
]
],
[
0.2989051342010498,
[
539,
0,
637,
221
]
],
[
0.2701702117919922,
[
573,
1150,
669,
1394
]
],
[
0.2558406889438629,
[
582,
143,
632,
244
]
],
[
0.23760168254375459,
[
579,
211,
626,
311
]
],
[
0.23735187947750092,
[
622,
1122,
665,
1227
]
],
[
0.2307254672050476,
[
639,
877,
682,
983
]
],
[
0.22685378789901734,
[
614,
1188,
661,
1299
]
],
[
0.21937736868858338,
[
652,
731,
698,
842
]
],
[
0.21803757548332215,
[
559,
307,
603,
413
]
],
[
0.2148183137178421,
[
572,
453,
620,
560
]
],
[
0.21115651726722718,
[
617,
1056,
660,
1156
]
],
[
0.21088728308677674,
[
613,
563,
665,
663
]
],
[
0.20798684656620027,
[
650,
802,
695,
912
]
],
[
0.20459488034248353,
[
568,
72,
620,
173
]
],
[
0.20070792734622956,
[
543,
168,
640,
430
]
]
]
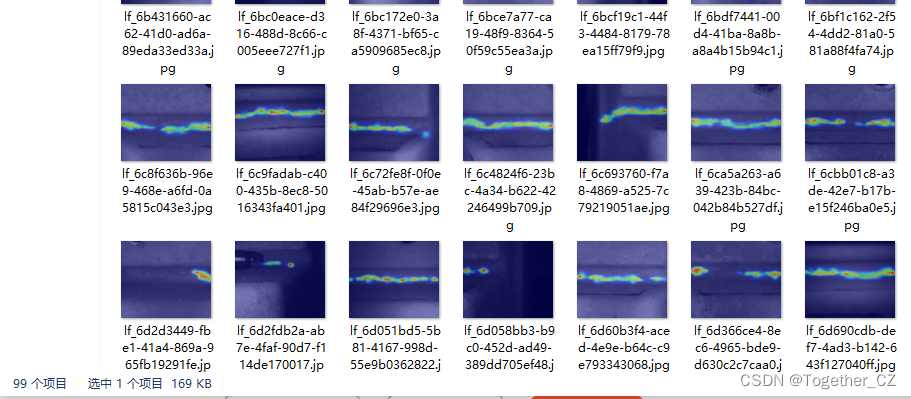
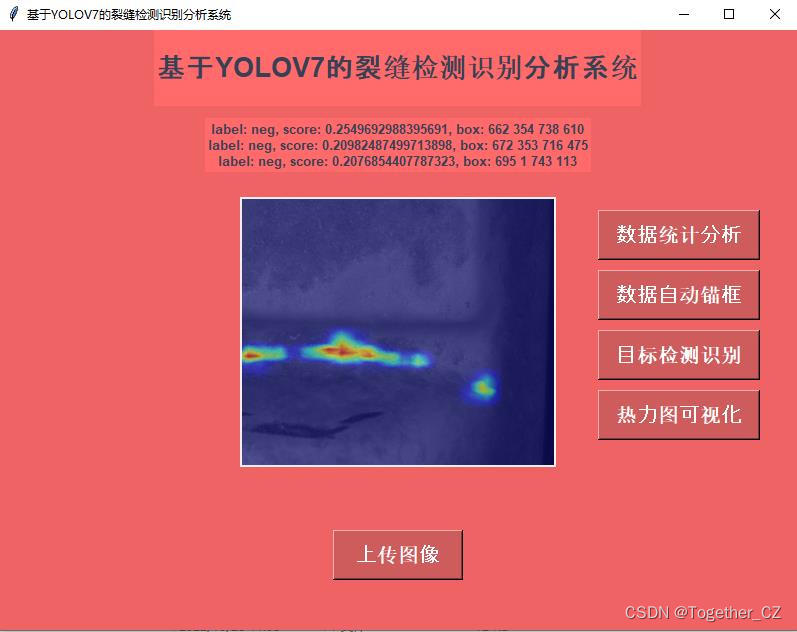
}同时对其检测热力图也进行了可视化:
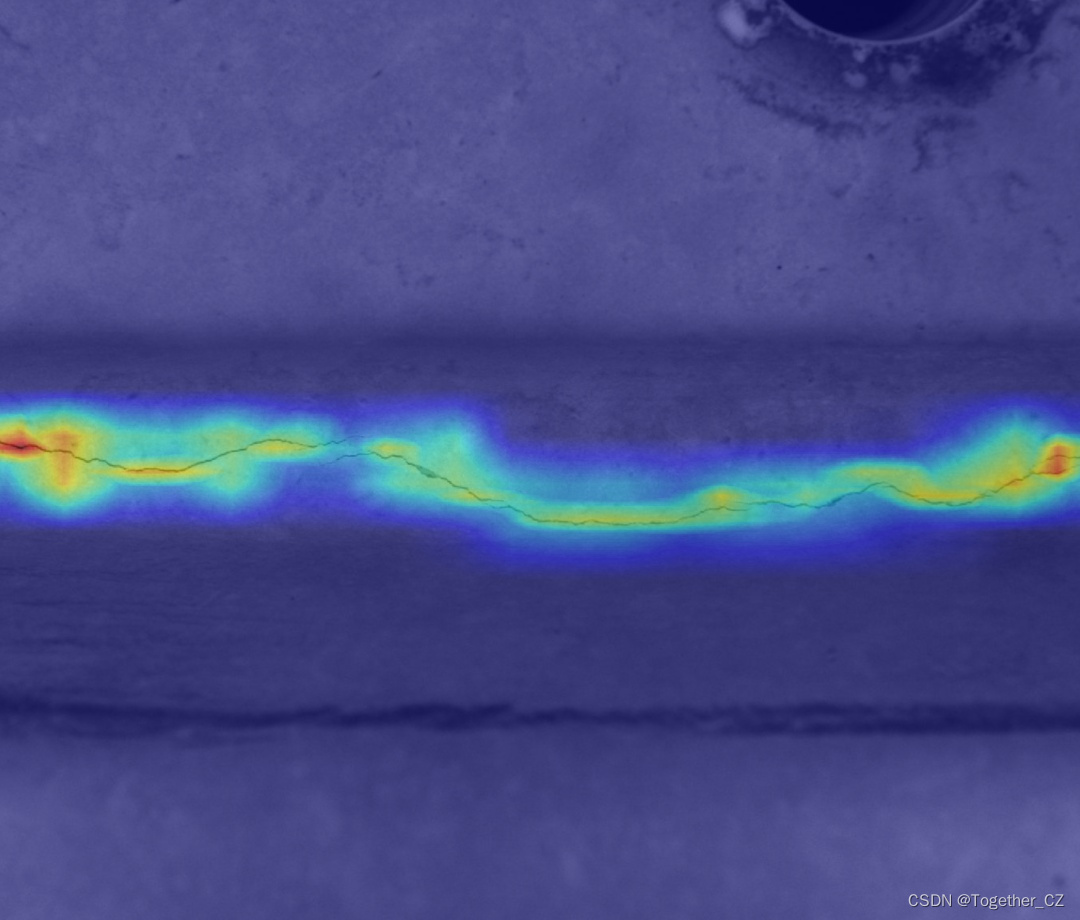
可以看到:模型整体检测结果显示出来的热力区域都是缠绕在图像中的裂缝区域周边的,还是不错的,唯一感觉不好的就是检测框的置信度普遍不是很高,不知道是不是数据太少的问题。
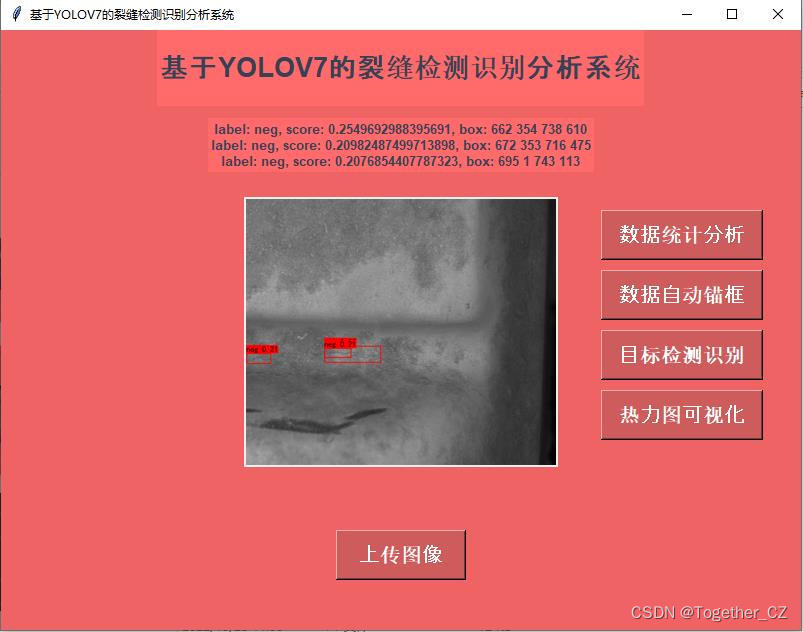
最后,为了能够构架直观便利地使用整套模型服务,这里我开发了专门的界面,使用效果如下:
【训练数据集类别统计分析可视化】
【训练数据集自动锚框计算可视化】
【图像数据目标检测识别】
【检测模型热力图可视化】
文章出处登录后可见!