论文链接: 2103.Learning Transferable Visual Models From Natural Language Supervision
项目官网: CLIP: Contrastive Language–Image Pre-training——Connecting Text and Images
代码:https://github.com/openai/CLIP
概述
- CLIP(
ContrastiveLanguage–Image Pre-training)基于对比学习的语言-图像预训练)建立在零样本迁移(zero-shot transfer)、自然语言监督学习( natural language supervision, ) 和多模态学习方面的大量工作之上。
CLIP是一个预训练模型,就像BERT、GPT、ViT等预训练模型一样。首先使用大量数据训练这些模型,然后训练好的模型就能实现,
输入一段文本(或者一张图像),输出文本(图像)的向量表示。CLIP和BERT、GPT、ViT的区别在于,CLIP是多模态的,包含图像处理以及文本处理两个方面内容,而BERT、GPT是单文本模态的,ViT是单图像模态的。
————————————————
原文链接:https://blog.csdn.net/me_yundou/article/details/123033447
摘要
- SOTA计算机视觉系统被训练来预测一组固定的预定的(predetermined)物体类别。这种受限的监督形式(restricted form of supervision)限制了它们的通用性(generality)和可用性(usability),因为(since)需要额外的标记数据(additional labeled data)来指定任何其他视觉概念(visual concept)。
- 直接从
原始文本(raw text )中学习关于图像的知识是一种很有前途的选择,它利用了(leverages)更广泛的监督来源(broader source of supervusion)。 - 我们证明了简单的预训练任务,
预测哪个标题(文字)与哪个图像相匹配,是一种有效的和可伸缩的方法,从互联网收集的4亿(图像-文本对(pairs))数据集学习SOTA图像表示。 - 预训练后,自然语言被用来参考学习到的视觉概念(或描述新的视觉概念),使模型的
zero-shot迁移到下游任务(downstrem tasks) - 我们研究了30多个不同的计算机视觉数据集的性能,跨越任务(spanning),如OCR、视频中的动作识别、地理定位(geo-localization)和许多类型的细粒度( fine-grained )对象分类。
- 该模型非平凡地转移到大多数任务,并且通常与完全监督的基线竞争,而
不需要任何特定数据集的训练 - . 例如,我们在ImageNet上达到原始ResNet50的准确性,而不需要使用它所训练的128万个训练示例中的任何一个。
参考CLIP中文解析
- 知乎@卡卡猡特——详解CLIP (一) | 打通文本-图像预训练实现ImageNet的zero-shot分类,比肩全监督训练的ResNet50/101
- csdn@me_yundou——以问答形式,阐述了:题目解读(可迁移)、什么是CLIP、CLIP贡献、CLIP动机、人物
数据来源于训练方法
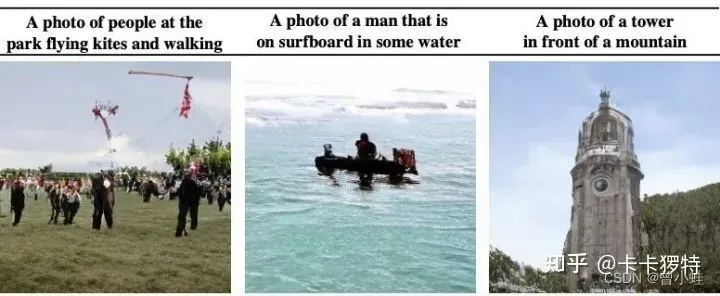
Open AI团队通过收集4亿(400 million)个文本-图像对((image, text) pairs),以用来训练其提出的CLIP模型。文本-图像对的示例如下:
模型结构
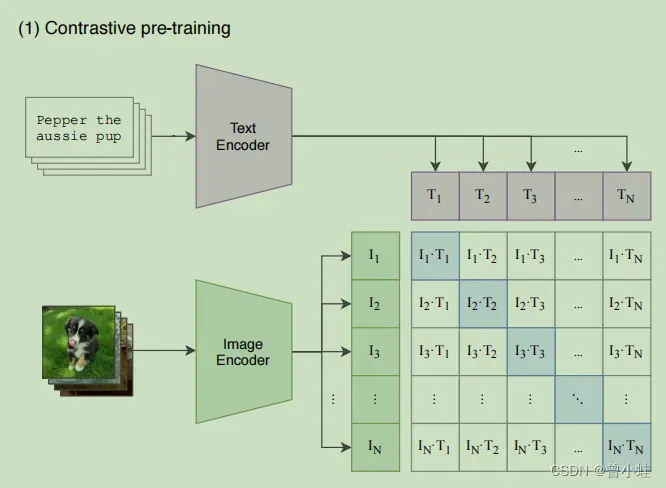
图1概述:
CLIP联合训练一个图像编码器和一个文本编码器来预测一批(图像()、文本(
))训练示例的正确配对。我们通过计算与
的之间的
余弦相似度(cosine similarity) 用来度量相应的文本与图像之间的对应关系。余弦相似度越大.
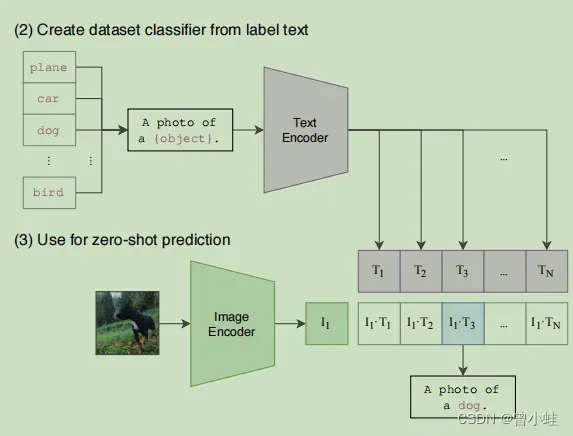
CLIP模型直接(zero_shot)用于图像分类 (应用一方面)
将1000个IMAGENET的图像标签简化为
结论
- 我们已经研究了(investigated)是否有可能将NLP中 与任务无关的 (task-agnostic)、 网络规模(web-sacle)(上亿数据)预训练的成功转移到另一个领域。。我们发现,采用这一方法(formula)会导致计算机视觉领域出现类似的行为,并讨论了这一研究领域的社会意义。
- 为了优化其训练目标,CLIP模型在训练前学习执行各种各样的任务
- 然后,可以通过
自然语言提示,使zero-shot transfer 到许多现有数据集。 - 在足够的规模下,这种方法的性能可以与特定任务的监督模型竞争,尽管仍有很大的改进空间。
官方代码示例
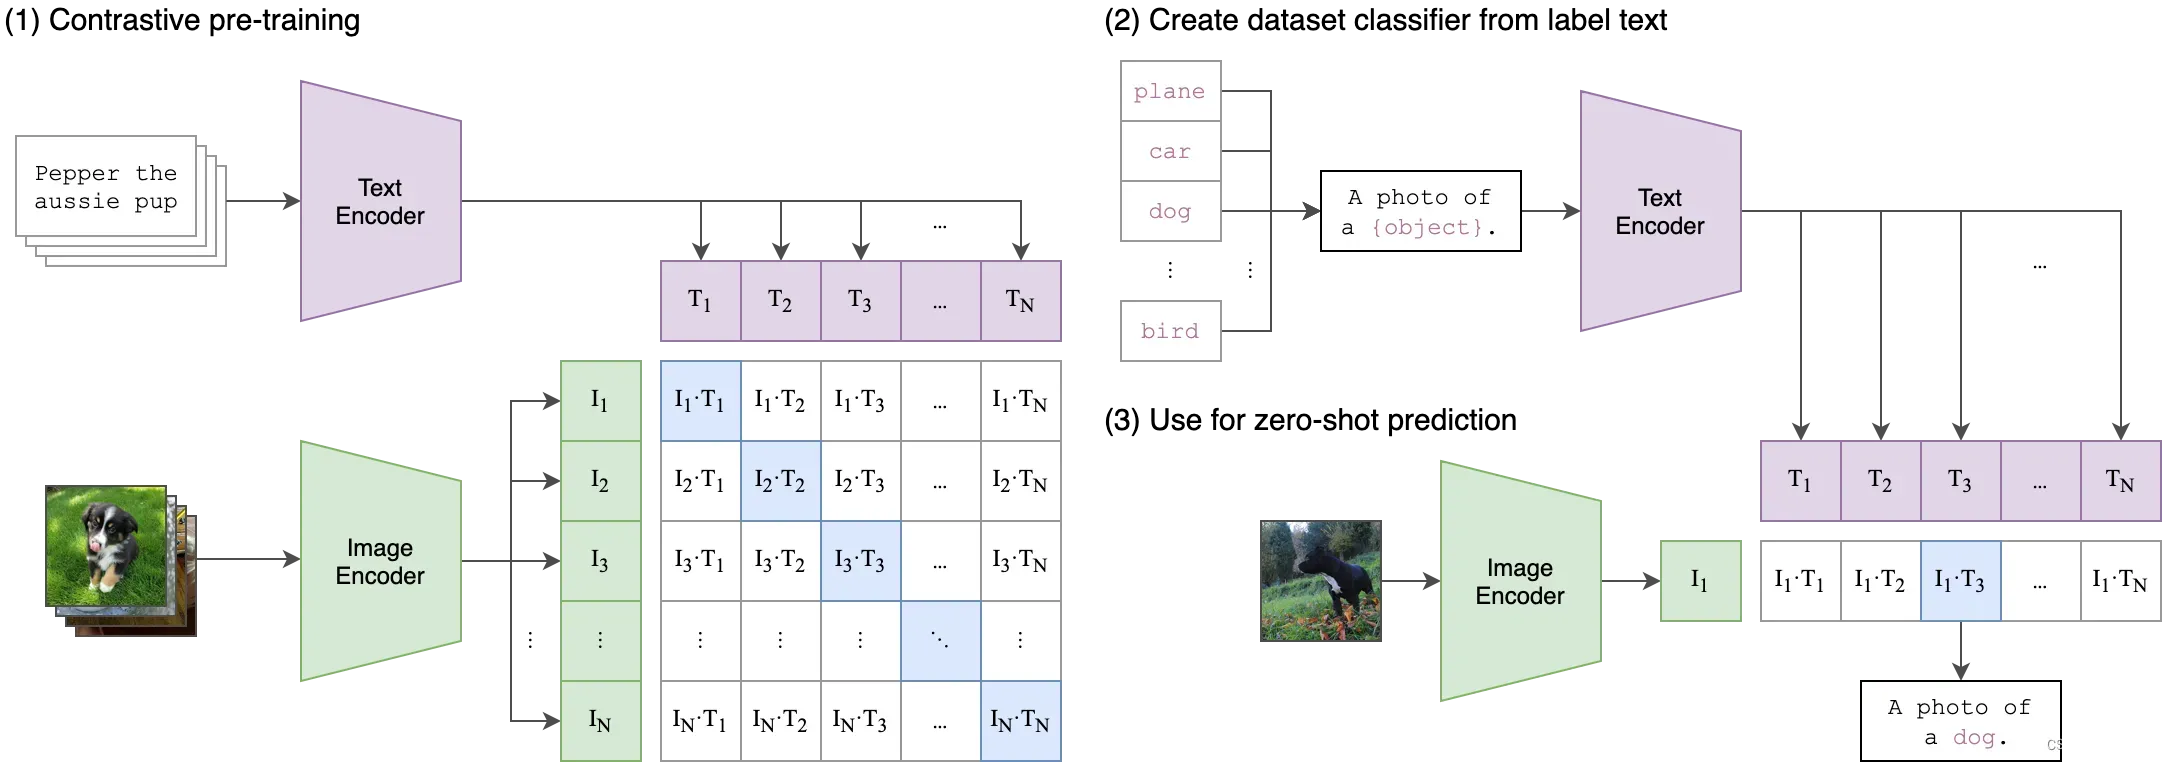
示例1——预测下图与哪个文字配对
- “a diagram”, “a dog”, “a cat”
配对代码
结果是 “a diagram”
import torch
import clip
from PIL import Image

device = "cuda" if torch.cuda.is_available() else "cpu"
model, preprocess = clip.load("ViT-B/32", device=device)

image = preprocess(Image.open("CLIP.png")).unsqueeze(0).to(device)
text = clip.tokenize(["a diagram", "a dog", "a cat"]).to(device)

with torch.no_grad():
    image_features = model.encode_image(image)
    text_features = model.encode_text(text)

    logits_per_image, logits_per_text = model(image, text)
    probs = logits_per_image.softmax(dim=-1).cpu().numpy()

print("Label probs:", probs)  # prints: [[0.9927937  0.00421068 0.00299572]]
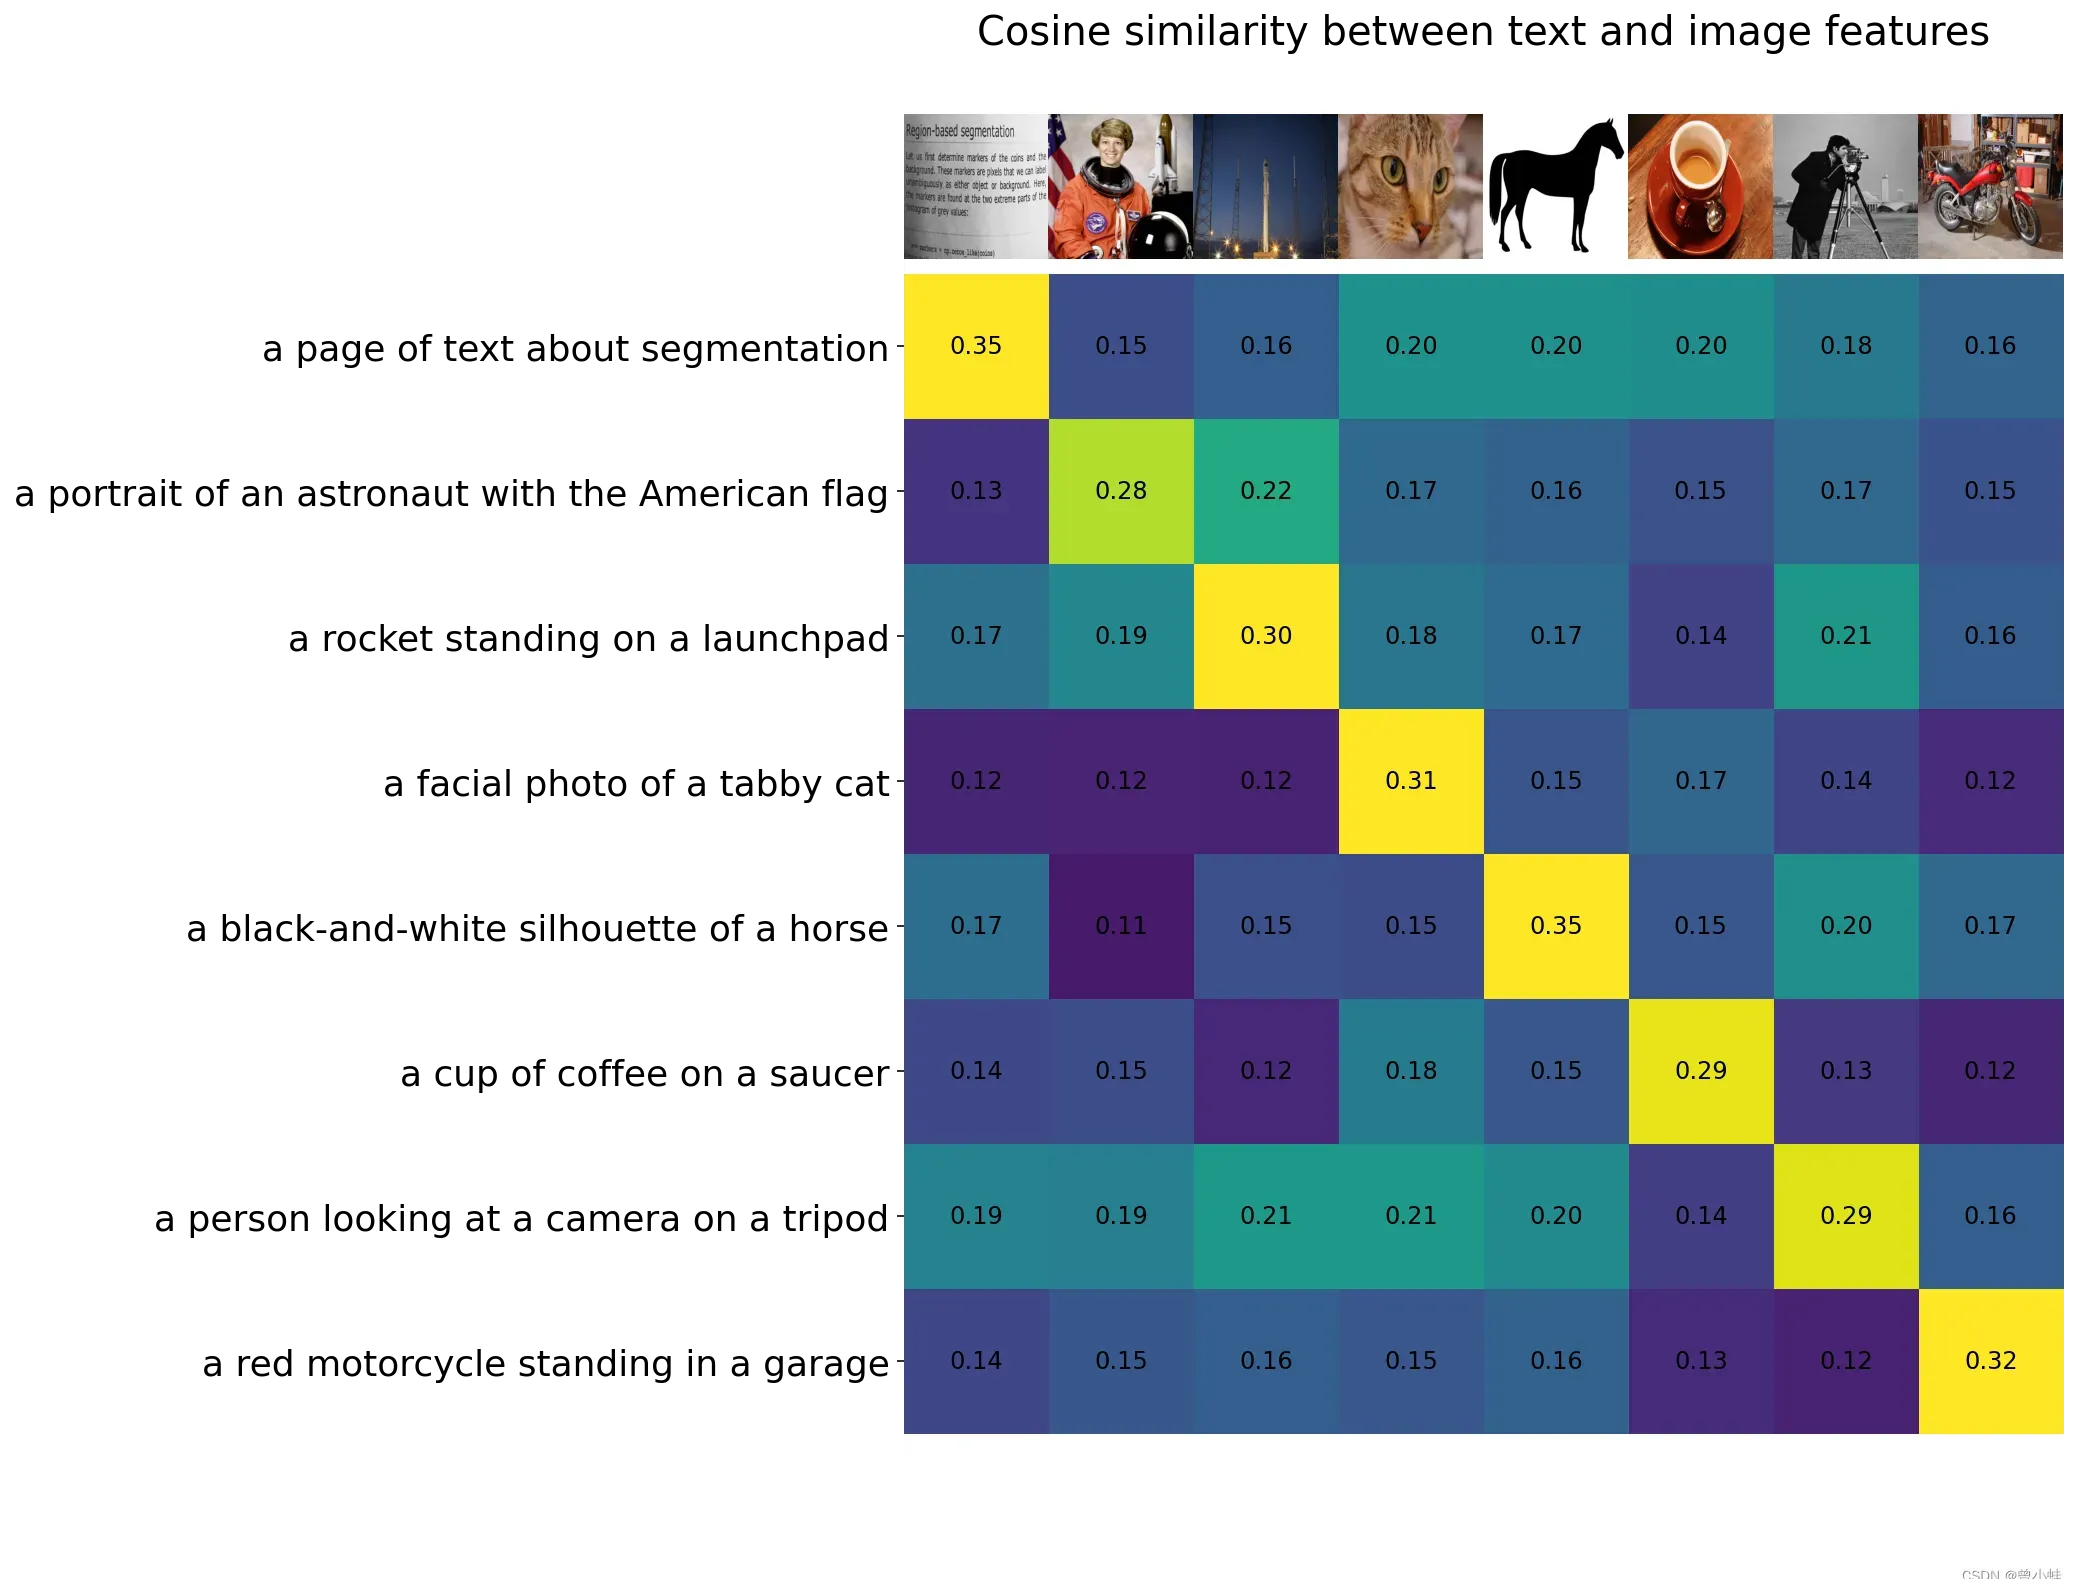
示例2——预测多图多文字配对 colab
图片

图片文字描述
# images in skimage to use and their textual descriptions
descriptions = {
    "page": "a page of text about segmentation",
    "chelsea": "a facial photo of a tabby cat",
    "astronaut": "a portrait of an astronaut with the American flag",
    "rocket": "a rocket standing on a launchpad",
    "motorcycle_right": "a red motorcycle standing in a garage",
    "camera": "a person looking at a camera on a tripod",
    "horse": "a black-and-white silhouette of a horse",
    "coffee": "a cup of coffee on a saucer"
}
部分代码
.......................略去部分代码,见colab完整代码
for filename in [filename for filename in os.listdir(skimage.data_dir) if filename.endswith(".png") or filename.endswith(".jpg")]:
    name = os.path.splitext(filename)[0]
    if name not in descriptions:
        continue

    image = Image.open(os.path.join(skimage.data_dir, filename)).convert("RGB")
    original_images.append(image)
    images.append(preprocess(image))
    texts.append(descriptions[name])


image_input = torch.tensor(np.stack(images)).cuda()
text_tokens = clip.tokenize(["This is " + desc for desc in texts]).cuda()

with torch.no_grad():
    image_features = model.encode_image(image_input).float()
    text_features = model.encode_text(text_tokens).float()

# Calculating cosine similarity
image_features /= image_features.norm(dim=-1, keepdim=True)
text_features /= text_features.norm(dim=-1, keepdim=True)
similarity = text_features.cpu().numpy() @ image_features.cpu().numpy().T


# 结果可视化
count = len(descriptions)

plt.figure(figsize=(20, 14))
plt.imshow(similarity, vmin=0.1, vmax=0.3)
# plt.colorbar()
plt.yticks(range(count), texts, fontsize=18)
plt.xticks([])
for i, image in enumerate(original_images):
    plt.imshow(image, extent=(i - 0.5, i + 0.5, -1.6, -0.6), origin="lower")
for x in range(similarity.shape[1]):
    for y in range(similarity.shape[0]):
        plt.text(x, y, f"{similarity[y, x]:.2f}", ha="center", va="center", size=12)

for side in ["left", "top", "right", "bottom"]:
  plt.gca().spines[side].set_visible(False)

plt.xlim([-0.5, count - 0.5])
plt.ylim([count + 0.5, -2])

plt.title("Cosine similarity between text and image features", size=20)
配对结果
文章出处登录后可见!
已经登录?立即刷新
